PSMAC Subcommittee on People Resourcing
Appendix A: Statistics Associated with the People Resourcing Continuum of How People Enter, Move Around Within and Leave the Public Service of Canada
Purpose
This document outlines data and statistics relative to the people resourcing continuum that illustrate how people enter, move around (internal mobility) and leave the public service.See footnote [20]
Context
The continuum is meant to illustrate the flow or schematic of how people move through the public service people resourcing system and was developed to support the work of the PSMAC Deputy Minister Subcommittee on People Resourcing.
The intent of this document is not that it be used for staffing and hiring decisions but rather that it be seen as a piece of a larger picture during discussions about people resourcing.
People Resourcing Continuum
There are a variety of mechanisms that allow individuals to enter the public service. They may enter through external advertised and non-advertised processes and often enter through one of several PSC-managed programs, such as the Post-Secondary Recruitment program or through general recruitment. They may also come in as temporary employees through student placement (co-op placement, the Federal Student Work Experience Program (FSWEP), and the Research Affiliate Program) or through Interchange Canada. The amount of time for which individuals are hired may vary. Some are hired as casuals or for a specified term, while others are hired as indeterminate employees.
How People Enter
The data and statistics in this document were gathered from the Public Service Commission 2008-2009 Annual Report unless otherwise stated. The information has been organized in accordance with the people resourcing continuum illustrated in Figure 2. For the purpose of this document, "how people enter" refers to all individuals affected by the public service people resourcing system, notwithstanding their status (i.e., whether they are considered to be an employee under the PSEA or not), and includes but is not limited to the following:
- Term employees;
- Indeterminate employees;
- Students;
- Casual workers; and
- Employees of a temporary employment agency that offer a provision of service.
How People Move Around (internal mobility)
Once an individual enters the people resourcing system of the public service, chances are that throughout the individual's career, he or she will move internally through a variety of mechanisms. For example, the individual may apply to internal staffing processes or may leave one department to go and work for another. For the purpose of this document, "how people move around" (internal mobility) includes but is not limited to the following:
- Acting appointments;
- Lateral movements;
- Downward movements;
- Promotions;
- Secondments; and
- Deployments.
How People Leave
Individuals generally leave the public service through retirement; however, other forms of separations also include:
- Transition to a separate employer;
- Resignation;
- Dismissal;
- Layoff;
- Rejection on probation; and
- The Alternative Service Delivery initiative (ASD).
The ASD is the transfer of any work, undertaking or business of the public service to any body or corporation that is a separate employer or that is outside the public service. When individuals have been brought in temporarily, they usually leave when their term or contract has expired.
Figure 2. The People Resourcing Continuum

Figure 2. The People Resourcing Continuum - Text version
1. How People Enter the Public ServiceSee footnote [21]
1.1 Overall public service growth
- In 2008–09, the public service continued to experience growth. As of March 2009, there were 208,947 individuals in organizations for which the PSC had delegated its authority to make appointments to deputy heads, an increase of 4.5 per cent from March 2008.
1.2 Overall public service hiring activities
- The number of new indeterminate hires from outside the public service increased to 12,705 appointments from 10,579 in 2007–08 (an increase of 20.1 per cent), representing 22.4 per cent of all new hires;
- In addition to these appointments, 11,039 specified term hires, 18,699 casual hires and 14,247 student hires were made in 2008–09;
- While the number of student hires increased to 14,247 from 13,600 the previous year (an increase of 4.8 per cent), the number of appointments to term positions and casuals decreased slightly (by 2.0 per cent and 3.1 per cent respectively); and
- Hiring activity (total of all hiring activities) to the public service totalled 56,690 during 2008–09, an increase of 3.6 per cent from the previous fiscal year.
Figure 3. Overall Public Service Hiring Activities 2008-09
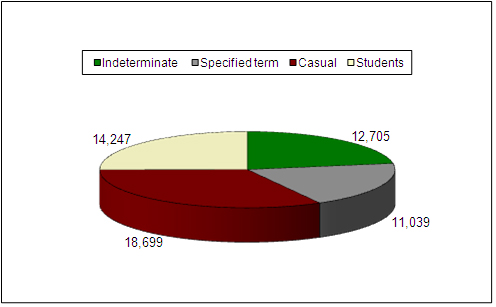
Source: PSC
hiring and staffing activities files
Figure 3. Overall Public Service Hiring Activities 2008-09 - Text version
Figure 4. Overall Public Service Hiring Activities 2007–08
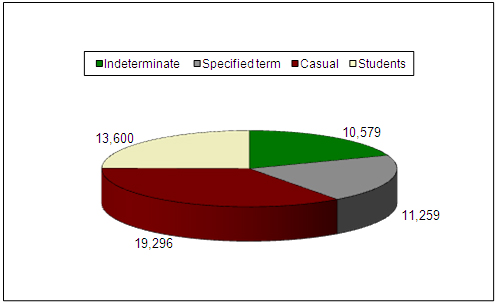
Source: PSC
hiring and staffing activities files
Figure 4. Overall Public Service Hiring Activities 2007–08 - Text version
1.3 Recruitment of post-secondary graduates and general external recruitment
- In 2008–09, about 1,700 graduates were hired from the PSC's Post-Secondary Recruitment program, which represents approximately 42 per cent of the public service renewal target of 4,000 graduates; and
- In 2008–09, 48 candidates qualified for the Recruitment of Policy Leaders program, and 26 were appointed to the public service.
Table 1. Appointments to the Public Service
| Post-Secondary Recruitment program | Recruitment of Policy Leaders program | General | Total | ||||
|---|---|---|---|---|---|---|---|
| Indeterminate | Term | Indeterminate | Term | Indeterminate | Term | Indeterminate | Term |
| 1,363 | 334 | 26 | 0 | 11,316 | 10,705 | 12,705 | 11,039 |
| Total: 1,697 | Total: 26 | Total: 22,021 | Total: 23,744 | ||||
Source: Public Service Commission 2008-2009 Annual Report
1.4 Recruitment of students for temporary employment
- In 2008–09, FSWEP attracted 63,100 applicants, which led to 9,932 student hires;
- Compared with 2007–08, this represents a 7-per-cent increase in students applying to FSWEP;
- These students submitted a total of 150,123 applications to be considered for the general FSWEP inventory, as well as for the 23 targeted departmental student programs. Of these applications, there were 9,932 hires (6.6 per cent);
Table 2. Federal Student Work Experience Program activities
| Year | 2006-07 | 2007-08 | 2008-09 |
|---|---|---|---|
| Number of applicants | 71,402 | 58,681 | 63,100 |
| Hires | 9,574 | 9,810 | 9,932 |
Source: Public Service Resourcing System and PSC hiring and staffing activities files
- In 2008–09, more than 4,200 placements were made from the Post-Secondary Co‑op/Internship Program;
- The co-op/internship program has seen an increasing number of appointments over the years; and
- In 2008–09, 99 placements were made through the Research Affiliate Program (RAP).
Table 3. Student hiring activities 2008–09
| FSWEP | RAP | Co-op | Total |
|---|---|---|---|
| 9,932 | 99 | 4,216 | 14,247 |
Source: Public Service Commission 2008-2009 Annual Report
1.5 Time to staff
According to the Public Service Commission 2008-2009 Annual Report:
- The average time required to staff indeterminate advertised positions increased following the coming into force of the PSEA in December 2005. It then decreased as organizations started to adapt to the new staffing regime.
As reported in the PSC's Time to Staff in the Federal Public Service—An Update (October 2009), the average time required to staff an indeterminate advertised position was as follows:
- For the period from January 2000 to December 2003, it took an average of 22.8 weeks for appointments;
- This increased to an average of 24.1 weeks for the period from April 2006 to September 2007; and
- The average number of weeks for appointments fell to 23.5 for the period from October 2007 to September 2008.
In the same study, it was determined that there were a number of influential factors:
- More processes have become open to the public and now have a national area of selection; and
- The number of collective staffing processes has increased, and the processes take a longer time to staff.
1.6 Temporary help services
- A total of approximately $317 million was spent in 2008–09 on temporary help services. Temporary help services are defined in the Public Accounts of Canada as temporary services acquired for general office help, secretarial, stenographic technical or other temporary help, etc. (Source: Public Accounts of Canada 2008-2009);
- The PSC is concerned that temporary help agencies are being used as a means to circumvent the PSEA and accelerate the hiring process. When work is of an ongoing or lengthy, albeit temporary, nature, the PSC believes that merit-based appointment processes should be the norm. The PSC is also concerned that individuals hired through temporary help agencies may have an unfair advantage accessing Core Public Administration (CPA) appointments. To examine this issue further, the PSC is undertaking an audit across the CPA to examine whether temporary help services are being used to circumvent the legislated requirements and hiring process; and
- It should be noted that the use of temporary help agencies is governed by the Treasury Board's Contracting Policy. Individuals hired through this type of arrangement remain employees of the temporary help agency. Their employment is not governed by either the PSEA or the Public Service Labour Relations Act.
2. Internal MobilitySee footnote [22]
2.1 Overall public service hiring activities
- Growth, along with retirements and continued strong internal mobility, resulted in persistent high levels of staffing activity in 2008–09; and
- Organizations for which the PSC has delegated its authority to make appointments conducted a total of 69,961 internal staffing activities in 2008–09.
Figure 5. Overall Public Service Internal Staffing Activities 2008-09
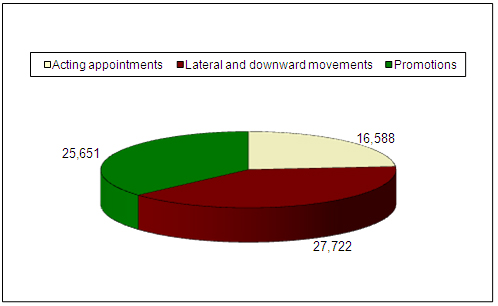
Figure 5. Overall Public Service Internal Staffing Activities 2008-09 - Text version
Figure 6. Overall Public Service Internal Staffing Activities 2007-08
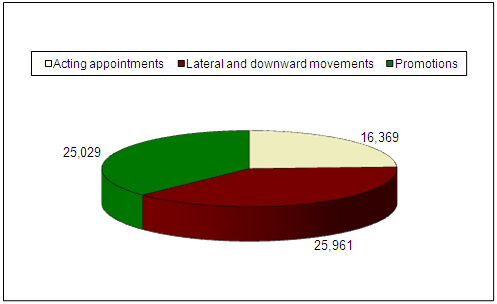
Source: PSC
hiring and staffing activities files
Figure 6. Overall Public Service Internal Staffing Activities 2007-08 - Text version
2.2 Number of positions filled by priority placement
Table 4 shows the number of positions filled by priority placement.
| Priority type | Carry- over See footnote (a) | New cases | Total (carry-over + new cases) | Appointed | Resigned and/or retired | Expired | Other removal See footnote (b) | Total outflows | Active at end of period |
|---|---|---|---|---|---|---|---|---|---|
|
Notes:
|
|||||||||
| Leave of absence (sec. 41) | 309 | 266 | 575 | 146 | 23 | 34 | 33 | 236 | 339 |
| Layoff (sec. 41) | 4 | 15 | 19 | 2 | 0 | 3 | 0 | 5 | 14 |
| TOTAL — Statutory priorities | 313 | 281 | 594 | 148 | 23 | 37 | 33 | 241 | 353 |
| Surplus (sec. 5) | 165 | 107 | 272 | 102 | 24 | 0 | 49 | 175 | 97 |
| Disabled employee (sec. 7) | 46 | 71 | 117 | 19 | 1 | 17 | 12 | 49 | 68 |
| Medically released CF/RCMP (sec. 8) | 233 | 259 | 492 | 205 | 2 | 44 | 0 | 251 | 241 |
| Relocation of spouse (sec. 9) | 348 | 425 | 773 | 206 | 13 | 32 | 137 | 388 | 385 |
| Reinstatement to higher level (sec. 10) | 117 | 105 | 222 | 31 | 3 | 111 | 1 | 146 | 76 |
| Governor General's exempt staff (sec. 6) | 1 | 0 | 1 | 0 | 0 | 1 | 0 | 1 | 0 |
| TOTAL — Regulatory priorities | 910 | 967 | 1,877 | 563 | 43 | 205 | 199 | 1,010 | 867 |
| GRAND TOTAL | 1,223 | 1,248 | 2,471 | 711 | 66 | 242 | 232 | 1,251 | 1,220 |
2.3 Internal time to staff
The findings of PSC's Time to Staff in the Federal Public Service—An Update (October 2009) are consistent with the findings of PSC's analysis of the time elapsed between job postings and first notification of appointment for internal indeterminate advertised staffing processes on Publiservice (see Table 5).
The analysis of Publiservice data uses a different methodology and shows that the average time to staff for distinct processes dropped from 18.9 weeks (132 calendar days) in 2007–08 to 17.7 weeks (124 calendar days) in 2008–09.
The average time to staff for collective processes remained essentially the same, i.e. 22.1 weeks (155 calendar days) in 2007-2008 and 22 weeks (154 calendar days) in 2008-09.
Table 5. Average Length of Time for Internal Indeterminate Staffing Processes
| Type of process | Distinct processes | Collective processes | ||||
|---|---|---|---|---|---|---|
| Year | 2006–07 | 2007–08 | 2008–09 | 2006–07 | 2007–08 | 2008–09 |
Source: PSC Staffing Management Accountability Framework statistics Notes:
|
||||||
| Average time to staff (in days) See footnote 1 | 121 | 132 | 124 | 142 | 155 | 154 |
| Average time to staff (in days) for "best performing organizations" See footnote 2 | 93 | 102 | 80 | 100 | 117 | 106 |
2.4 Internal mobility in the public service
OCHRO's People Management Information Analysis and Survey Operations indicates the following:
- Over the past decade, the average time that employees stay in a position in the public service is approximately 4.5 years;See footnote [23] and
- The average time employees stay in a particular group and level is not available as it is affected by reclassifications; this obscures historical trends that might indicate mobility patterns.
2.5 Employees on leave without pay
- The number of employees on leave without pay over the last 10 years has been an average of 5.9 per cent, with the highest percentage in the last 3 years.
Table 6. Number of Employees on Leave Without Pay 2000–09
| March | Active | Leave Without Pay | % Leave Without Pay | Total |
|---|---|---|---|---|
|
Note: Data are from each year-end, March 31, 2000, to March 31, 2009. |
||||
| 2000 | 152,069 | 7,579 | 4.7% | 159,648 |
| 2001 | 161,505 | 8,511 | 5.0% | 170,016 |
| 2002 | 170,779 | 9,831 | 5.4% | 180,610 |
| 2003 | 174,581 | 10,425 | 5.6% | 185,006 |
| 2004 | 177,136 | 11,042 | 5.8% | 188,178 |
| 2005 | 184,083 | 12,077 | 6.1% | 196,160 |
| 2006 | 189,280 | 12,813 | 6.3% | 202,093 |
| 2007 | 192,683 | 13,809 | 6.6% | 206,492 |
| 2008 | 200,575 | 14,678 | 6.8% | 215,253 |
| 2009 | 209,523 | 15,395 | 6.8% | 224,918 |
2.6 Days worked versus days paid
- In the CPA for 2008–09, there were approximately 193,109 full-time equivalents (FTEs), each working an estimated 260 days in that year;
- Including 11 paid holidays, there were 9,744,381 paid days not worked over a total of 50,208,413 paid days, giving 19.4 per cent as the percentage of paid days not worked in that year;
- If paid holidays are not included, then there were 7,620,179 paid days not worked over the total 50,208,413 paid days, giving 15.2 per cent as the percentage of paid days not worked in that year; and
- Overtime is not included in the paid days since that information is not readily available in a usable form. There is no readily available data on when employees are being paid time and a half, double time, etc.
Table 7. Paid Days Worked Versus Days Paid Not Worked
| FTE | Paid Days Per FTE | Total Paid Days | Total Paid Leave Days | % of Paid Days Not Worked | Total Paid Holidays | % of Paid Days Not Worked Including Paid Holidays |
|---|---|---|---|---|---|---|
| 193,109.3 | 260 | 50,208,412.8 | 7,620,179 | 15.2% | 2,124,202.08 | 19.4% |
Source: OCHRO's People Management Information Analysis and Survey Operations
FTE converts all employees into units representing a full-time employee working for the whole year, regardless of their full-time or part-time status or whether they worked for a full year or for part of the year.
An employee's FTE is reduced when the employee works for part of the year or part-time. For example, if an employee has worked only 6 months out of 12, the employee is considered as 0.5 FTE instead of 1 FTE.
If an employee works 25 hours a week instead of a normal work week of 37.5 hours, the employee is considered as 0.667 FTE instead of 1 FTE. An employee who works 25 hours a week instead of a normal work week of 37.5 hours and has worked only 6 months out of 12 is considered as 0.333 FTE instead of 1 FTE.
2.7 Intradepartmental and Interdepartmental MobilitySee footnote [24]
- A higher percentage of individuals move within departments, and the rate has remained relatively constant over the last three years.
Figure 7. CPA Indeterminate Mobility Rates Within and Between Departments
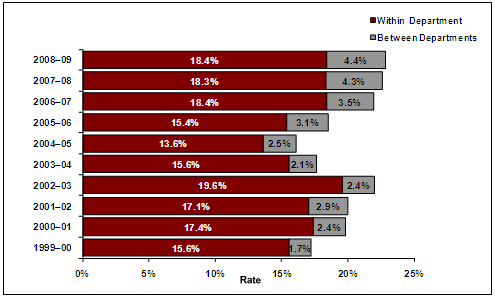
Note: Data are from
each year-end, March 31, 2000, to March 31, 2009.
Figure 7. CPA Indeterminate Mobility Rates Within and Between Departments - Text version
2.8 Promotion and transfer rates
- A few groups account for over
two thirds of all promotions over the 10-year-period
1999–2009:- CR—Clerical and Regulatory
- PM—Program Administration
- AS—Administrative Services
- ES/EC—Economics, Sociology and Statistics
- CS—Computer Systems Administration
- The majority of lateral transfers originated in these same groups.
- The
majority of movements occurred in the following departments:
- Department of Human Resources and Skills Development
- Department of National Defence
- Correctional Service of Canada
- Department of Public Works and Government Services
- Department of Health
- Department of Fisheries and Oceans
- More than half of all such movements originated in the above departments.
Figure 8. CPA Promotion and Transfer Rates
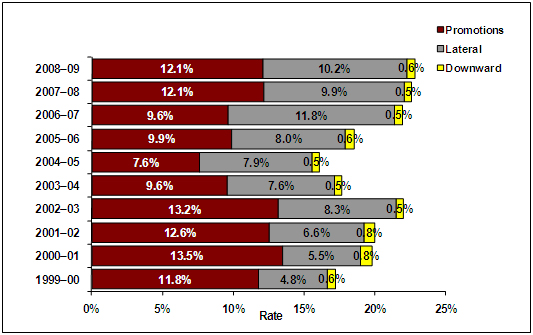
Note: Data are from
each year-end, March 31, 2000, to March 31 2009.
Figure 8. CPA Promotion and Transfer Rates - Text version
3. How People Leave the Public Service
- Of the approximately 9,700 indeterminate employees who left the public service in 2008–09, most left through retirement; and
- Resignations represented only 1.4 per cent of the indeterminate population.
3.1 Departures from the Core Public Administration
- Figure 9 indicates the indeterminate departure rate by type of departure and shows that retirements have steadily increased since 2003–04.
Figure 9. Indeterminate CPA Departure Rates by Type
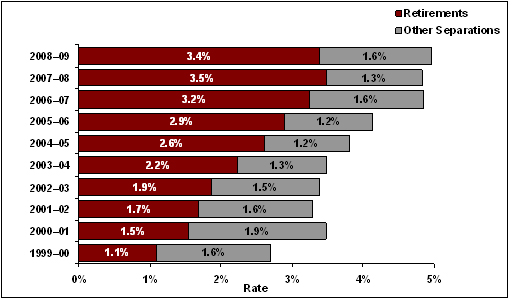
Note: Data are from each
year-end, March 31, 2000, to March 31 2009.
Figure 9. Indeterminate CPA Departure Rates by Type - Text version
3.2 Other separations
Reasons for other separations are resignations, dismissals, layoffs, ASD, movement to a separate employer and others (see Table 8).
Table 8. Volumes of Separations in the Core Public Administration by Reason
| Reason | 1999–2000 | 2000–01 | 2001–02 | 2002–03 | 2003–04 | 2004–05 | 2005–06 | 2006–07 | 2007–08 | 2008–09 |
|---|---|---|---|---|---|---|---|---|---|---|
|
Notes:
|
||||||||||
| Resignation | 1,695 | 1,838 | 1,532 | 1,254 | 1,224 | 1,241 | 1,379 | 1,622 | 1,692 | 1,941 |
| Dismissal | 108 | 77 | 112 | 120 | 148 | 126 | 138 | 115 | 147 | 183 |
| Layoff | 82 | 54 | 43 | 79 | 35 | 32 | 29 | 11 | 16 | 31 |
| ASD* | 114 | 4 | 58 | 243 | 31 | 9 | 0 | 512 | 6 | 228 |
| To Separate Employer | 54 | 99 | 257 | 226 | 228 | 281 | 431 | 835 | 598 | 618 |
| All other | 447 | 337 | 250 | 260 | 308 | 274 | 334 | 299 | 311 | 313 |
| Total | 2,500 | 2,409 | 2,252 | 2,182 | 1,974 | 1,963 | 2,311 | 3,394 | 2,770 | 3,314 |
Table 9. Rejection during Probation by Fiscal Year
| 1999– 2000 | 2000– 01 | 2001– 02 | 2002– 03 | 2003– 04 | 2004– 05 | 2005– 06 | 2006– 07 | 2007– 08 | 2008– 09 |
|---|---|---|---|---|---|---|---|---|---|
| 20 | 30 | 25 | 36 | 50 | 32 | 36 | 32 | 74 | 100 |
Figure 10 indicates other separation volumes in the CPA by voluntary and involuntary reason.
Figure 10. Other CPA Separation Volumes by Reason
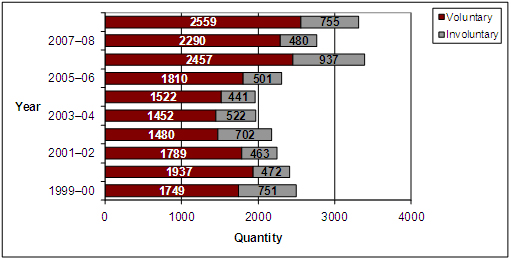
Figure 10. Other CPA Separation Volumes by Reason - Text version
Note: Data are from each year-end, March 31, 2000, to March 31 2009.
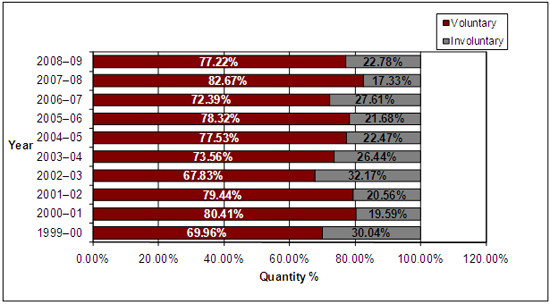
Figure 11 indicates other separation volumes in the CPA by voluntary and involuntary reason, separated as percentages.
Please note that there is no exact standard for defining what voluntary and involuntary departures are; the information provided in Figure 11 should be used as an approximation only.
Figure 11. Other Separation Volumes by Reason Separated as Percentages
Note: Data are from each
year-end, March 31, 2000, to March 31 2009.
Figure 11. Other Separation Volumes by Reason Separated as Percentages - Text version
Table 10 indicates the indeterminate departure rate by type of departure and department.
Table 10. Indeterminate Departure Rates by Department for 2008–09
| Department/Organization | Other Separations |
Retirements | Total |
|---|---|---|---|
|
Note: Data are from each year-end, March 31, 2000, to March 31 2009. |
|||
| Atlantic Canada Opportunities Agency | 0.4% | 2.5% | 2.9% |
| Department of Agriculture and Agri-Food | 1.7% | 3.2% | 5.0% |
| Public Health Agency of Canada | 1.6% | 1.5% | 3.2% |
| Canadian Artists and Producers Professional Relations Tribunal | 0.0% | 0.0% | 0.0% |
| Canadian Transportation Agency | 2.8% | 8.9% | 11.7% |
| Library and Archives of Canada | 1.0% | 5.0% | 6.1% |
| Canadian International Trade Tribunal | 1.4% | 2.9% | 4.3% |
| Canada Border Services Agency | 1.2% | 2.4% | 3.6% |
| Courts Administration Service | 0.9% | 3.2% | 4.1% |
| Canadian Dairy Commission | 0.0% | 0.0% | 0.0% |
| Office of the Chief Electoral Officer | 1.8% | 1.8% | 3.7% |
| Canada School of Public Service | 1.0% | 4.0% | 5.0% |
| Canadian Grain Commission | 1.5% | 2.8% | 4.3% |
| Canadian Intergovernmental Conference Secretariat | 0.0% | 9.5% | 9.5% |
| Canada Industrial Relations Board | 2.2% | 4.4% | 6.7% |
| Office of the Commissioner of Official Languages | 2.1% | 4.1% | 6.2% |
| Copyright Board | 0.0% | 0.0% | 0.0% |
| Military Police Complaints Commission | 0.0% | 16.7% | 16.7% |
| Canadian Space Agency | 1.8% | 1.5% | 3.3% |
| Department of Human Resources and Skills Development | 2.1% | 4.2% | 6.3% |
| NAFTA Secretariat – Canadian Section | 0.0% | 0.0% | 0.0% |
| Office of the Co-ordinator, Status of Women | 7.2% | 1.2% | 8.4% |
| Department of Fisheries and Oceans | 1.4% | 3.9% | 5.3% |
| Department of National Defence | 1.5% | 3.3% | 4.8% |
| Department of the Environment | 1.4% | 3.3% | 4.7% |
| Department of Industry | 1.1% | 3.8% | 4.9% |
| Department of Veterans Affairs | 1.3% | 3.2% | 4.5% |
| Canadian Environmental Assessment Agency | 2.7% | 2.0% | 4.8% |
| Department of Foreign Affairs and International Trade | 1.4% | 3.8% | 5.2% |
| Canadian Forces Grievance Board | 4.9% | 0.0% | 4.9% |
| Department of Finance | 2.6% | 2.8% | 5.4% |
| Office of the Commissioner for Federal Judicial Affairs | 0.4% | 4.7% | 5.2% |
| National Farm Products Council | 0.0% | 6.7% | 6.7% |
| Economic Development Agency of Canada for the Regions of Quebec | 0.5% | 2.7% | 3.2% |
| Office of the Governor General's Secretary | 1.3% | 2.0% | 3.3% |
| Canadian Human Rights Commission | 4.5% | 5.1% | 9.6% |
| Public Service Human Resources Management Agency of Canada | 0.8% | 5.8% | 6.6% |
| Department of Indian Affairs and Northern Development | 2.4% | 3.2% | 5.6% |
| Indian Specific Claims Commission | 17.1% | 5.7% | 22.9% |
| Canadian International Development Agency | 1.1% | 3.7% | 4.8% |
| International Joint Commission | 4.2% | 12.5% | 16.7% |
| Department of Citizenship and Immigration | 1.0% | 2.9% | 3.9% |
| Office of Infrastructure of Canada | 0.0% | 0.9% | 0.9% |
| Office of the Information Commissioner of Canada | 0.0% | 5.2% | 5.2% |
| Indian Residential Schools Resolution Canada | 2.6% | 0.6% | 3.2% |
| Immigration and Refugee Board | 3.8% | 2.7% | 6.4% |
| Department of Justice | 1.1% | 1.9% | 3.0% |
| Office of the Commissioner of Lobbying | 0.0% | 4.5% | 4.5% |
| Hazardous Materials Information Review Commission | 0.0% | 0.0% | 0.0% |
| Department of Transport | 1.3% | 3.7% | 4.9% |
| Department of Health | 2.5% | 2.2% | 4.6% |
| National Parole Board | 0.9% | 4.8% | 5.8% |
| Department of Canadian Heritage | 0.8% | 2.5% | 3.2% |
| Privy Council Office | 0.9% | 2.0% | 2.9% |
| Correctional Service of Canada | 1.4% | 2.9% | 4.3% |
| Passport Canada | 4.4% | 1.7% | 6.1% |
| Public Service Commission | 0.9% | 4.9% | 5.8% |
| Department of Public Safety and Emergency Preparedness | 0.6% | 2.6% | 3.2% |
| Canadian Human Rights Tribunal | 0.0% | 0.0% | 0.0% |
| Patented Medicine Prices Review Board | 7.1% | 2.4% | 9.5% |
| Assisted Human Reproduction Agency of Canada | 0.0% | 0.0% | 0.0% |
| Royal Canadian Mounted Police (Civilian Staff) | 2.8% | 2.9% | 5.6% |
| Registry of the Competition Tribunal | 0.0% | 0.0% | 0.0% |
| Royal Canadian Mounted Police External Review Committee | 0.0% | 0.0% | 0.0% |
| Royal Canadian Mounted Police Public Complaints Commission | 15.4% | 0.0% | 15.4% |
| Department of Natural Resources | 1.0% | 3.8% | 4.8% |
| Canadian Radio-television and Telecommunications Commission | 1.2% | 6.7% | 7.9% |
| Statistics Canada | 1.0% | 4.7% | 5.7% |
| Office of the Registrar of the Supreme Court of Canada | 0.0% | 4.1% | 4.1% |
| Department of Public Works and Government Services | 1.1% | 4.7% | 5.8% |
| Transportation Appeal Tribunal of Canada | 0.0% | 0.0% | 0.0% |
| Treasury Board Secretariat | 1.2% | 3.5% | 4.7% |
| Canadian Transportation Accident Investigation and Safety Board | 1.0% | 4.9% | 5.8% |
| Public Service Staffing Tribunal | 4.2% | 0.0% | 4.2% |
| Department of Western Economic Diversification | 3.8% | 3.8% | 7.6% |
Appendix A1—Comparison of Mobility Analysis Methodologies of the Public Service Commission and the Office of the Chief Human Resources Officer
| Population Base | Public Service Commission | Office of the Chief Human Resources Officer | |
|---|---|---|---|
|
|
||
| Population Flows | Hires |
|
|
| Promotions |
|
|
|
| Lateral and Downward Transfers |
|
|
|
| Acting Appointments |
|
|
|
| Separations |
|
|
|
|
|||
- Date modified: