PSMAC Subcommittee on People Resourcing
Table of Contents
- People Resourcing Subcommittee Members
- Executive Summary: Report at a Glance
- Glossary
- I. Background
- II. Approach
- III. Findings
- IV. Gapsand Recommendations
- Appendix A: Statistics Associated with the People Resourcing Continuum of How People Enter, Move Around Within and Leave the Public Service of Canada
- Appendix B: Methodology
- Appendix C: Characteristics of an Optimal People Resourcing System
People Resourcing Subcommittee Members
The People Resourcing Subcommittee was established with the following membership:
- Department of Indian Affairs and Norther Development
Michael Wernick (Chair) - Department of Health
Glenda Yeates - Canadian Food Inspection Agency
George Da Pont - Department of Canadian Heritage
Stephen Wallace - Office of the Chief Human Resources Officer
Daphne Meredith (ex officio)
Executive Summary: Report at a Glance
In March 2010, a subcommittee of the Public Service Management Advisory Committee (PSMAC) was established to examine issues and challenges regarding people resourcing in the public service. The Subcommittee quickly agreed that "people resourcing" is a wider lens than "staffing." It is a continuum of activities by which people enter, move around within, and leave the public service. A schematic can be found in Appendix A.
The Subcommittee gathered and examined data regarding people resourcing and has included a compendium to this report as Appendix A to foster further evidence-based discussion.
The Subcommittee set as its overall objective "to efficiently and effectively place the right people in the right jobs at the right time." It then reached out to gather the perspectives of human resources (HR) advisors, managers and employees in order to assess current people resourcing across the public service—where it is working well, where it falls short of an optimal system, and where there are priority issues to be tackled. The methodology and details of the engagement are set out in Appendix B.
The engagement revealed, and the Subcommittee acknowledges, that the context for people resourcing is far from static. It is still being affected by the 2003 Public Service Modernization Act (PSMA), by the sustained focus on public service renewal over the past several years, and by recent changes to the machinery of government in this area. There are important pockets of innovation across the public service. Aspects of the people resourcing continuum have been the subject of detailed and useful scrutiny, such as integrated planning, the possibilities of new Web‑based technologies, and post-secondary recruitment. Other important exercises are under way, including the administrative services review, a review of the PSMA, and an examination of the organization of work. This Subcommittee aspires to offer a picture of people resourcing that can complement and perhaps influence these other exercises.
The Subcommittee concludes that the most important gaps to be tackled are as follows:
- Continued weakness in planning by many departments and agencies that has yet to fully capture the links between identification of current and future business needs, assessment of current workforce composition, and concrete people resourcing strategies;
- The lack of basic tools and common processes by which sub-organizations within and especially across departments and agencies can combine their resourcing activities for greater effectiveness at lower cost;
- A yawning gap of mutual misunderstanding and mistrust between the management community and the human resources community, stemming from lack of clarity about expectations, roles and risk tolerance, which is feeding a cumulative pattern of risk aversion and inefficiency; and
- A credibility gap between the rhetoric of public service branding and the real experience of would-be entrants.
These gaps can be closed; the Subcommittee provides recommendations to the deputy heads who will drive people management in each organization and to the Centre.See footnote[1]
The key recommendations are as follows:
- Deputy heads should lead, and be seen to lead, serious engagement with their management teams in crafting each year's integrated business/HR plans, and should insist on regular reporting and forecasting that connects the silos of salary budgets, "body counts" and space allocation;
- Deputy heads should ensure a serious and authentic discussion within their respective organizations to clarify the expectations, roles and accountabilities of hiring managers and human resources, and insist on codifying these roles and responsibilities and setting baseline service standards as a starting point for further collaboration;
- Deputy heads must drive, and be seen to drive, the swift adoption of the emerging Common Human Resources Business Process and common interoperable information technology (IT), and stamp out any drift into customized processes and systems. The Centre should mandate this convergence and cease creating its own customized applications;
- The Centre should use off-the-shelf Web 2.0 platforms to accelerate the efficient interdepartmental sharing of integrated business/HR plans. The same technology will enable the sharing of best practices and resourcing and staffing tools (job descriptions, selection tools, interview guides, etc.) for hiring managers and HR advisors. This will help stop spending scarce operating resources on "reinventing the wheel;"
- The Centre should use off-the-shelf Web 2.0 platforms to create an interdepartmental "marketplace" where departments can identify their proposed resourcing activities before formally launching a staffing process; to look at priority referrals and pre-qualified candidates created by activities elsewhere in the public service; and to look for opportunities to combine efforts with other organizations with similar needs;
- Shared resourcing processes within and across departments should steadily become the norm from which exceptions are rare and difficult to obtain, especially for resourcing in the small set of occupational groups and levels that currently account for most resourcing activities. Managers should be expected to use them, and departments should be expected to collaborate. To this end, the Centre should encourage further work on tools that pre-screen large pools of candidates to obtain smaller numbers in which hiring managers can have confidence and from which they can quickly select candidates who fit;
- The Centre and departments must take steps together to slow down the churn (excessive mobility) and shortages within the HR community and to foster professional development and adaptation to new tools and approaches; and
- External recruitment should be more candid about the likely number of hires. There is no evidence that there will be a lack of good external candidates, except in some niches. The public service should aspire not just to being an "employer of choice" but also to being "a choosy employer" that seeks people who aspire to excellence and to making a difference. Efforts to attract new recruits should be targeted based on real job opportunities rather than on recruiting for the public service in general.
Glossary
- Collective staffing process
- Is an approach that allows for one appointment process to fill several similar positions within or between departments and agencies.
- Distinct staffing process
- Is an approach that is normally intended to staff a single position.
- Integrated planning
- Is the process by which an organization aligns its human, financial, asset and information resources with its current and future business needs.
- People resourcing
- Refers to, for the purpose of this initiative, the range of complex and interrelated functions, activities and mechanisms used to place the right people in the right jobs at the right time.
- The Centre
- Constitutes central agencies of the Government of Canada, i.e., the Canada School of Public Service, the Department of Finance, the Privy Council Office, the Public Service Commission and the Office of the Chief Human Resources Officer at the Treasury Board Secretariat.
- Web 2.0
- Are Web applications that facilitate interactive information sharing, interoperability, and collaboration on the World Wide Web (e.g., GCPEDIA).
I. Background
In March 2010, the People Resourcing Subcommittee of the Public Service Management Advisory Committee (PSMAC) was established to focus on what steps could be taken within the existing system of HR management to:
- Improve the capacity of the public service to efficiently and effectively place the right people in the right jobs at the right time; and
- Enhance departments' ability to work collectively to meet common people resourcing needs.
The work of the Subcommittee represents just one of a number of initiatives underway that are contributing to improving people resourcing in the public service. In addition to individual departmental efforts, the following are some of the other initiatives taking place:
- Public Service Modernization Act legislative review;
- The Public Service Renewal Action Plan;
- The Administrative Services Review;
- Review of the occupational group structure;
- Redesign of post-secondary recruitment;
- The Public Service Staffing Modernization Project;
- Extreme Hiring Makeover; and
- The Common Human Resources Business Process.
II. Approach
The following outlines the approach followed by the Subcommittee in managing this initiative.
Objectives
- Identify the most important gaps of the current people resourcing system; and
- Provide recommendations to deputy heads and the Centre to address these critical gaps.
Guiding Principles
- All recommendations put forward should be based on evidence;
- Where possible, the recommended actions and activities should offer prompt, high- impact solutions to common challenges or concerns;
- Where possible, work should build on and link to what has already been done or is ongoing;
- Other initiatives underway that may contribute to addressing certain recommendations should be recognized;
- The focus should be on:
- What we can do better within the existing legislated system;
- The elements that seemed to represent the most significant gaps; and
- Areas we can build upon that would benefit from additional deputy head support; and
- Deputy heads will play a key role in addressing and resolving the gaps identified in this report at both the public service–wide and departmental levels.
Scope
Recognizing that an optimal people resourcing system requires a range of complex and interrelated management functions and activities, it was determined that this analysis would focus on a limited number of gaps and recommend actions for both short- and longer-term strategies.
The scope was therefore focused on:
- Identification of the most significant, timely and relevant gaps, given the fiscal environment, that would benefit the most from the attention of senior management;
- Identification of areas that would contribute to advancing the direction set out in the HR strategic review; and
- Recommendations that offer practical means to close the gaps.
Methodology
The Subcommittee was tasked with developing and recommending options to address the concerns of stakeholders involved in decision-making processes related to people resourcing. Previous work, projects, reports and initiatives conducted on the same issues were consulted and used as building blocks for this report, including the following:
- "Diagnostic of the State of HRM Capacity Challenges Facing Line Managers" (2008);
- "HR Capacity Building for Line Managers: Addressing Current and Future Needs" (2008);
- Footage and interviews from the 8th Annual National Managers' Community Development Forum (2008);
- National Managers' Community focus group sessions: "Dialogue with Senior Leaders—A Follow-Up on E-Polling Results";
- The HR Capacity Building Strategy (2005);
- PE Community: Potential Recruitment Model 2005–06 to 2010–11;
- Demographic of the PE Occupational Group (2010); and
- Lessons learned from the Deputy Minister University Champion Program.
To obtain different perspectives on the current people resourcing system, consultations were initiated with various representatives of the managers and HR communities to identify existing gaps and propose options for improvement. In addition, quantitative analysis of all available dataSee footnote[2] for each aspect of the people resourcing continuum was undertaken to identify areas of concern or interest.
The following representatives were consulted through brainstorming sessions and focus group discussions to determine the perspective of managers and HR professionals:
- Representatives from the Subcommittee members' departments;
- HR representatives from various departments (from the regions and the National Capital Region (NCR));
- Representatives from the National Managers' Community (NMC) (from the regions and the NCR);
- Chairs of the Human Resources Planning Interdepartmental Network (HRPIN);
- Chairs of the National Staffing Council (NSC); and
- Chair of the Organization and Classification Council (OCC).
Brainstorming and focus group session participants were asked to discuss the following:
- Features of an optimal people resourcing system;
- Their respective departments' most important gaps in dealing with the current system; and
- Strategies and actions that would support the public service in achieving an optimal people resourcing system.
The perspectives of candidates and employees have been based on individual consultations and feedback from the following:
- New employees who had recently gone through the hiring process;
- Individuals who have recently applied to positions advertised to the public; and
- Graduating students/participants at public service career fairs (2008–09).
See Appendix B for a detailed description of the methodology used.
III. Findings
General Observations
Focus groups with managers, HR professionals, candidates and employees confirmed that these communities have similar views on the critical gaps of the current people resourcing system. The groups led the Subcommittee to identify four gaps requiring immediate attention.
Furthermore, data analysis highlighted the sheer volume of transactions, and time frames pointed to the urgent need to improve staffing. This supported the feedback that was received in the consultations.
People resourcing encompasses a broad spectrum of activities, including recruitment, staffing, classification, learning and development, performance management and more. Little was heard from either managers or HR communities regarding topics such as the time it takes to acquire security screening, the time and effort needed to address official languages issues, or the impact of employment equity and diversity. These processes appear to be less "top of mind" with managers and HR professionals.
On the other hand, we heard a great deal about staffing. It is the number one area of concern for managers and HR professionals alike. Given the volume of staffing activity, any improvement will provide important benefits to managers, candidates and HR service providers.
Growth, along with retirements and continued strong internal mobility, resulted in persistent high levels of staffing activity this year [2008–09]. Organizations for which the PSC has delegated its authority to make appointments conducted a total of 126 651 staffing activities in 2008-2009. This represents an increase of 3.7% over the previous fiscal year.
—Public Service Commission 2008-2009 Annual Report
Focus group discussions also revealed that stakeholders perceive public service–wide initiatives with a degree of cynicism. In particular, the following views were expressed:
- Although several initiatives were undertaken in the past (e.g., Public Service 2000 and the Universal Classification Standard) with a view to improving the overall efficiency and effectiveness of the people resourcing system, only a few projects were successful and provided tangible operational results;
- Issues described by participants during focus group discussions have been brought to the attention of senior management on several occasions over the years, but there has been little significant progress; and
- Despite this situation, managers and HR professionals consider this initiative to be relevant and timely, and are confident that it could constitute a cornerstone in addressing existing systemic gaps.
Characteristics of an Optimal People Resourcing System
According to stakeholders consulted, an optimal people resourcing system would feature the following characteristics and elements:
- Flexibility and efficiency in a system that is adaptive, responsive and risk smart;
- Effective workforce planning and management over the long term that is based on needs and given appropriate follow-up;
- A distinctive brand that has a cohesive branding strategy;
- Healthy relationships between employees, managers and HR professionals;
- Reliable, practical tools that are standardized and accessible; and
- Sound governance that is clear, engaged and accountable.
See Appendix C for a detailed description.
IV. Gaps and Recommendations
Gap 1: Planning
The continued weakness in planning by many departments and agencies has yet to fully capture the links between identifying current and future business needs, assessing current workforce composition, and developing concrete people resourcing strategies.
Key Facts
- As of March 2009, there were 208,947 individuals in the Core Public Administration, an increase of 4.5 per cent from March 2008. This trend continued into 2010 as the public service grew another 3.4 per cent to 216,045 as of March 2010;See footnote [3]
- There is a freeze on operating budgets from fiscal year 2010–11 to 2013–14 that will limit growth;
- Overall, departure rates for the indeterminate Core Public Administration population have risen only from 4.8 per cent in 2006–07 to 5.0 per cent in 2008–09.See footnote [4] This is predicted to plateau in the coming years;
- The overall indeterminate mobility rate for the Core Public Administration in 2007–08 was 22.6 per cent;See footnote [5] and
- The departmental HR plans available for analysis were inconsistent in format and did not present standardized information; most did not clearly link business and HR needs, and where future HR needs were stated, the information was not specific enough to be useful.
In consultations with managers and HR professionals, both communities indicated the following:
- Managers receive insufficient demographic data in support of planning;
- The current process is too heavy and has somehow become more important than the needs. Streamlining the process is part of the solution. We also need to clearly integrate HR planning with business planning, thus moving away from transactional position-based planning; and
- Key players have not embraced integrated HR planning as a meaningful driver for staffing and people management (e.g., not a future-focused or strategic approach to managing succession).
What do the facts tell us?
- As a result of the operating budget freeze and lower than expected retirement rates, the public service is unlikely to continue to grow at the same rate. This should result in fewer external opportunities, leading to the need to strategically manage internal resources to meet current and future business needs;
- Current planning is focused on vacancy management (micro) instead of organization-wide planning (macro);
- The availability and relevancy of data to inform planning and decision making needs to be improved;
- HR planning is not integrated, standardized or streamlined; and
- Churn will always be a factor within the public service, and plans need to be developed that consider current and anticipated churn rates.
Therefore, deputies heads should do the following:
- Lead, and be seen to lead, serious engagement with their management teams in crafting each year's integrated business/HR plans;
- Insist on regular reporting and forecasting that connects the silos of salary budgets, staff complement, and space allocation;
- Ensure that senior management meets regularly to provide meaningful direction on implementation of the plans; and
- Ensure that their respective organizations have a process in place to obtain timely reports and forecasts that reconcile salary budgets, staff complement and space allocation against priorities.
Therefore, the Centre should do the following:
- Use off-the-shelf Web 2.0 platforms to accelerate the efficient interdepartmental sharing of integrated business/HR plans; and
- Support improvements in departmental plans by supplying high-quality demographic data to feed the planning process.
Gap 2: Efficiencies
There is a lack of basic tools and common processes by which sub-organizations within and especially across departments and agencies can combine their resourcing activities for greater effectiveness at lower cost.
Key Facts
- Of the departmental HR plans available for analysis, the formats and information available were inconsistent and not detailed enough to identify areas of common need;
- In 2008–09, federal organizations posted more than 380 advertisements to fill CR-03, CR-04, CR-05, AS-01 and AS-02 positions in the NCR. These postings generated over 138,000 applicants;See footnote [6]
- The Administrative Services Review is examining public service administrative processes to find efficiencies;
- Figure 1 summarizes the amount of time it takes from the date a poster for a position is launched to appointment:See footnote [7]
Figure 1. Variations in Time to Staff Across Collective and Distinct Processes
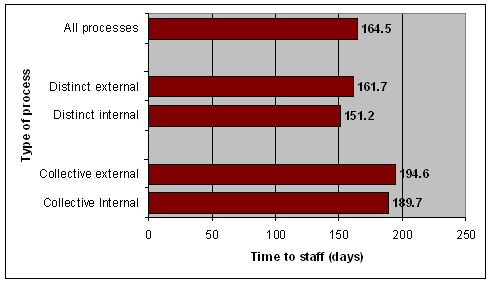
Figure 1: Variations in Time to Staff Across Collective and Distinct Processes - Text version
- Noting the time to staff as shown in Figure 1, there are several resourcing options that do not require launching a process from scratch every time. These include appointment of priority referrals, student bridging, and referrals from inventories and pools such as the Post‑Secondary Recruitment program (i.e., referrals from the Public Service Commission (PSC) can be obtained in as little as 72 hours);
- Over 70 per cent of managers surveyed indicated that slowness in pre-process preparation delayed their staffing "to some extent" or "to a great extent," a percentage that has remained fairly constant since April 2006;See footnote [8]
- Easily accessible tools to facilitate temporary replacements are lacking (i.e., 22.6 per cent mobility rate in 2008–09 and an average of 5.9 per cent in the last 10 years);
- In 2008–09, only approximately 29 per cent of individuals entitled to a priority placement were appointed (i.e., 711 out of the 2471See footnote [9]);
- Although over 299 people resourcing tools and guides exist, they are scattered in various locations and are not communicated properly. In addition, managers and HR professionals consistently mentioned that a repository of job descriptions, posters, assessment guides, etc. is needed to facilitate managing selection processes;See footnote [10] and
- The Common Human Resources Business ProcessSee footnote [11] was endorsed as the Government of Canada standard in June 2010 for full implementation by 2013–14, but engagement and implementation are incomplete. Currently, 12 departments have begun adopting the Common Human Resources Business Process, which represents over 55 per cent of the Core Public Administration workforce.
HR professionals and managers stated the following:
- There are currently no clearly identified and agreed-upon areas where there is an interest and benefit in adopting a coordinated, interdepartmental or public service–wide approach;
- Managers expressed a need for being more aware of the wide variety of staffing and contracting strategies available, depending on their operational context (e.g., urgent versus regular needs, permanent versus temporary, etc.);
- Managers have expressed concern over the time investment they have to make to complete the assessment of candidates, stating that more emphasis should be put on the benefits of asset qualifications assessment and right fit performed by the hiring managers;See footnote [12] and
- Managers expressed a lack of trust in the assessment of candidates conducted by others and believe that this contributes to multiple similar selection processes being launched every year.See footnote [13]
What do the facts tell us?
- While there is a general sense that the time to staff associated with both distinct and collective selection processes needs to be improved, we do not seem to make an optimal number of appointments from established staffing pools;
- The lack of collaboration or cohesion at departmental and interdepartmental levels leads to a significant time investment by managers, HR professionals and applicants in managing distinct selection processes;
- Using other resourcing options (established staffing pools, priority persons, etc.) can reduce staffing time from months to days;
- It is not clear that managers are using all available options to "get their work done" and are relying on conventional staffing processes that waste time and effort;
- Many guides and tools are not standardized or are "minimalist" in terms of the tasks that are required to staff; and
- Although tools can be found in several venues, confusion over where the information can be found, its accuracy or even its alignment with public service needs do not facilitate managers and HR professionals' tasks.
Therefore, deputy heads must do the following:
- Drive, and be seen to drive, swift adoption of the emerging Common Human Resources Business Process and common interoperable IT, and stamp out any drift toward customized processes and systems;
- Define a risk management framework that strikes the optimal level of delegation down to hiring managers and facilitates collaboration for common resourcing needs;
- Commit
to shared resourcing processes that should steadily become the norm within and
across departments and agencies by:
- Playing an active role in ensuring that the people resourcing needs of the organization are communicated to an interdepartmental marketplace to consolidate needs and join forces, where appropriate;
- Making it a standard practice to open staffing pools public service–wide;
- Committing to make maximum use of staffing pools and databanks wherever possible; and
- Ensuring that managers use them and that their departments collaborate.
In addition, deputy heads and their departments should:
- Consider the full range of available staffing strategies, including priority appointment, before launching distinct selection processes (e.g., casuals, terms, deployments and contracting).
Therefore, OCHRO should:
Use off-the-shelf Web 2.0 platforms to:
- Create an interdepartmental
marketplace where departments and agencies could:
- Identify their proposed resourcing activities before formally launching a selection process;
- Seek alternative sources of candidates; and/or
- Access staffing pools created by activities elsewhere in the public service.
Therefore, OCHRO and the Treasury Board Secretariat's Chief Information Officer (CIO) should:
- Mandate departments and central agencies to cease creating their own customized applications; and
- Work toward fully interoperable IT systems to support people resourcing.
Therefore, OCHRO and the PSC should:
- Conduct, as a high priority,
further work on:
- Tools to pre-screen large pools of candidates to obtain smaller numbers in which hiring managers can have confidence and from which they can draw candidates who meet the established requirements; and
- Targeted tools facilitating the assessment of specific qualifications;
The Subcommittee endorses the work of the Public Service Staffing Modernization Project and encourages continued efforts toward interoperability in IT systems to further maximize the benefits of HR modernization.
- Use
off-the-shelf Web 2.0 platforms to accelerate the efficient sharing of tools for
best practices in resourcing and staffing aimed at hiring managers and HR
professionals to maximize efficiencies (e.g., job descriptions, statement of
merit criteria, selection tools and interview guides). The central location
could include:
- Information on all active pools available, including PSC and departmental pools;
- Public service–wide data banks of various temporary and permanent opportunities, as well as employees interested in such opportunities; and
- Proactive identification of employment opportunities across the public service available to employees before they receive formal priority status, as well as a list of individuals eligible for priority appointments.
Gap 3: Hiring Culture
There is a yawning gap of mutual misunderstanding and mistrust between the management community and the HR community, stemming from lack of clarity about expectations, roles and risk tolerance. This is feeding a cumulative pattern of risk aversion and inefficiency.
Key Facts
- In seven large organizations representing 40.4 per cent of the organizations subject to the Public Service Employment Act (PSEA), sub-delegated managers indicated that better support is required from their staffing advisors and systemsSee footnote [14];
- The five-year review of the PSMA will examine the administration and operation of the Act with the objective of identifying improvements;
- The HR Community Development Working Group has been established to continue work, which will enhance the capacity of the HR community; and
- In 2007–08, the PSC study on the mobility of public servants stated that the overall mobility rate for the PE occupational group was 74 per cent.
HR professionals and managers stated the following:
- Although HR professionals are expected to encourage and promote reasonable risk taking in the staffing regime, this is often in conflict with our role in responding to the PSC or senior management's questions, should audit results not be satisfactory. For example, do the PSC and senior management want HR to be a doer, a gatekeeper or a strategic advisor and partner?;See footnote [15]
- The roles of HR and managers, as well as the type of service delivered should be clarified (e.g., managers perceive that HR owns the process while, for HR, the management of human resources is considered to be a managerial responsibility);See footnote [16]
- Managers stated that there is such a high turnover of HR advisors, particularly in the NCR, that they do not have time to acquire the skills and tools to provide the advice and services that managers need;See footnote [17] and
- We are told to use the flexibilities provided by the PSMA, yet it is unclear what these are, and when we try to use them, we are not supported.See footnote [18]
What do the facts tell us?
- It is very difficult to foster collaborative relationships between managers and HR professionals when there is a lack of clarity regarding expectations, roles and responsibilities;
- Without defined organizational risk tolerance, hiring managers and HR advisors feel personally responsible for the level of risk taken regarding staffing. This impedes the use of flexibilities and innovation; and
- Managers do not feel well served by HR, and the high mobility rate in the HR community is seen as a contributing factor.
Therefore, deputy heads should do the following:
To address churn, employees should be encouraged to remain in a position for 3‑4 years to obtain the required depth of experience.
- Ensure a serious and authentic discussion within their respective organizations to clarify the expectations, roles and accountabilities of hiring managers and HR professionals, and insist on codifying these roles and responsibilities and setting baseline service standards as a starting point for further collaboration; and
- Provide clearer expectations for people resourcing by providing clear direction on the level of risk they are prepared to accept (e.g., guiding principles on the use of non-advertised processes, etc.).
Therefore, the Centre should:
The Subcommittee endorses OCHRO's and the Human Resources Council's (HRC's) continued efforts to build HR capacity.
- Support departments in efforts to slow down the churn within the HR professional community and to foster professional development and adaptation to new tools and approaches; and
- Work with departments to align training and tools of HR professionals and managers to meet departmental needs.
Gap 4: External Recruitment
There is a credibility gap between the rhetoric of public service branding and the real experience of would-be entrants.
Key Facts
- The public service is experiencing its highest-ever volume of job seekers at 276,580, which represents over 800,000 applications in 2009–10;See footnote [19]
- Shortages are forecasted in the health sector, where the highest excess demand is projected for managers in health and education services, physicians and nurses; as well, a slight shortage is projected in the social sciences, education, government services and religion sectors. However, the number of job seekers is projected to be high enough to generally balance demand for skilled candidates. The ranking in the forecast hides the fact that several individuals who do not find work in occupations they studied for end up working in other occupational groupings;
- In addition, according to the 2008–09 career fair assessment report commissioned by OCHRO, only 51 per cent of students surveyed indicated that the slogan "One Employer—Thousands of Opportunities" attracted their attention to the public service as a future employer;
- The 2009–10 career fair assessment report states that the promotional products used during 2009–10 career fairs did not generally receive positive feedback. Regional organizers and departments also noted that the current branding products do not speak to young people; and
- The number of applicants is on the rise, while the number of available positions is on the decline.
Applicants stated the following:
- Applying for positions in the public service is complex, discouraging and time-consuming. There are so many qualifications, criteria and testing that applying for a position becomes a full-time job in itself;
- There is lack of communication, follow-up information and feedback once a candidate has submitted an application; and
- A person cannot get a job with the public service unless he or she is bilingual or knows someone "on the inside."
What do the facts tell us?
- There is no evidence that there is or will be a lack of good external candidates, except in certain specific niches. Therefore, the public service should aspire not just to being an employer of choice, but also to being a choosy employer that seeks people who aspire to excellence and to making a difference;
- There is a perceived discrepancy between the public service "brand" and would-be entrants' experience;
- Current efforts and strategies are primarily focused on entry-level recruitment; and
- The current hiring process is cumbersome and discourages some applicants.
Therefore, deputy heads should do the following:
The Subcommittee recognizes the ongoing efforts of the PSC in improving the jobs.gc.ca website to make it more user-friendly to applicants, and further enhancements are encouraged.
- Be more candid about the likely number of hires for departmental external recruitment processes; and
- Ensure timely communication with applicants throughout the departmental recruitment process.
Therefore, the Centre should:
- Be more candid about the likely number of hires for centralized external recruitment processes;
- Ensure timely communication with applicants throughout the process;
- Support the concept that the public service should be an employer of choice, but also a choosy employer that seeks people who aspire to excellence and to making a difference; and
- Implement measures to support
this approach that include:
- Streamlining the technology and tools supporting the application process to improve candidates' experience;
- Enhancing the system's screening capability to make it more efficient and better able to target the right candidates;
- Revising the current approach to public service branding and outreach to ensure it is relevant and allows for targeted (external) recruitment; and
- Basing efforts to attract new recruits on real job opportunities rather than on a generic public service brand.
Questions Deputy Heads Should Ask
In response to Gap #1: Planning, deputy heads should ask the following:
- Do I engage seriously and regularly with my senior management to provide strategic and future direction on people resourcing needs?
- Does my HR plan address the strategic and future needs of my organization rather than just focusing on filling vacancies in my current organizational structure?
- Can my organization give me timely reports and forecasts that reconcile salary budgets, staff complement and space envelope or do I have information silos?
- Does my organization have a simple dashboard that tracks how people enter, move around within and leave my department?
- Do I have a governance process inside my organization that enables identification and sharing of resourcing needs? Does my HR plan consider the collective needs of multiple departments?
- Am I aware of the churn rate within my organization for the various occupational groups?
- Am I contributing to the high mobility rate by "poaching" from others?
In response to Gap #2: Efficiencies, deputy heads should ask the following:
- Is my department using the most efficient and standardized staffing processes and tools?
- Have I explored options for bringing together and sharing information and best practices within my organization and sharing them with other departments?
- When staffing a position in my organization, am I explicitly considering all my resourcing alternatives (including use of casuals, terms, students, priority persons, deployments, assignments and contracting)?
- Have I struck a balance between delegating staffing down into my organization and making my managers collaborate on common resourcing needs?
- Do I maximize staffing efficiencies in my organization and across organizations by leveraging collective staffing opportunities, where appropriate?
In response to Gap #3: Hiring Culture, deputy heads should ask the following:
- Have I defined and codified the roles and responsibilities of HR and managers related to staffing?
- Do I have clear performance indicators and appropriate monitoring and controls?
- Have I ensured that proper departmental and interdepartmental mechanisms are in place to communicate my expectations regarding people resourcing management (e.g., risk tolerance)?
- Is my department helping or hindering the growth of a more stable HR community?
In response to Gap #4: External Recruitment, deputy heads should ask the following:
- What are my department's target audiences, and what do we know about how to reach them?
- Is my department being candid with job seekers about the number of job opportunities in my department?
- Am I empowering my hiring managers to take risks and commit to new hiring, or do I send signals that make them unduly risk averse?
- Is our branding reflective of the real-life experience when entering the public service?
Appendix A: Statistics Associated with the People Resourcing Continuum of How People Enter, Move Around Within and Leave the Public Service of Canada
Purpose
This document outlines data and statistics relative to the people resourcing continuum that illustrate how people enter, move around (internal mobility) and leave the public service.See footnote [20]
Context
The continuum is meant to illustrate the flow or schematic of how people move through the public service people resourcing system and was developed to support the work of the PSMAC Deputy Minister Subcommittee on People Resourcing.
The intent of this document is not that it be used for staffing and hiring decisions but rather that it be seen as a piece of a larger picture during discussions about people resourcing.
People Resourcing Continuum
There are a variety of mechanisms that allow individuals to enter the public service. They may enter through external advertised and non-advertised processes and often enter through one of several PSC-managed programs, such as the Post-Secondary Recruitment program or through general recruitment. They may also come in as temporary employees through student placement (co-op placement, the Federal Student Work Experience Program (FSWEP), and the Research Affiliate Program) or through Interchange Canada. The amount of time for which individuals are hired may vary. Some are hired as casuals or for a specified term, while others are hired as indeterminate employees.
How People Enter
The data and statistics in this document were gathered from the Public Service Commission 2008-2009 Annual Report unless otherwise stated. The information has been organized in accordance with the people resourcing continuum illustrated in Figure 2. For the purpose of this document, "how people enter" refers to all individuals affected by the public service people resourcing system, notwithstanding their status (i.e., whether they are considered to be an employee under the PSEA or not), and includes but is not limited to the following:
- Term employees;
- Indeterminate employees;
- Students;
- Casual workers; and
- Employees of a temporary employment agency that offer a provision of service.
How People Move Around (internal mobility)
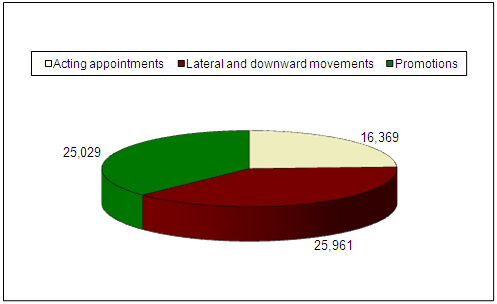
Once an individual enters the people resourcing system of the public service, chances are that throughout the individual's career, he or she will move internally through a variety of mechanisms. For example, the individual may apply to internal staffing processes or may leave one department to go and work for another. For the purpose of this document, "how people move around" (internal mobility) includes but is not limited to the following:
- Acting appointments;
- Lateral movements;
- Downward movements;
- Promotions;
- Secondments; and
- Deployments.
How People Leave
Individuals generally leave the public service through retirement; however, other forms of separations also include:
- Transition to a separate employer;
- Resignation;
- Dismissal;
- Layoff;
- Rejection on probation; and
- The Alternative Service Delivery initiative (ASD).
The ASD is the transfer of any work, undertaking or business of the public service to any body or corporation that is a separate employer or that is outside the public service. When individuals have been brought in temporarily, they usually leave when their term or contract has expired.
Figure 2. The People Resourcing Continuum

Figure 2. The People Resourcing Continuum - Text version
1. How People Enter the Public ServiceSee footnote [21]
1.1 Overall public service growth
- In 2008–09, the public service continued to experience growth. As of March 2009, there were 208,947 individuals in organizations for which the PSC had delegated its authority to make appointments to deputy heads, an increase of 4.5 per cent from March 2008.
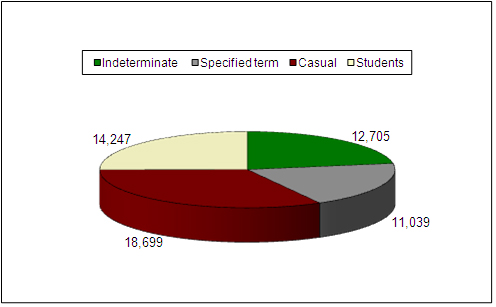
1.2 Overall public service hiring activities
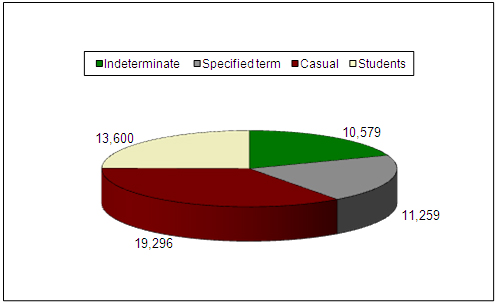
- The number of new indeterminate hires from outside the public service increased to 12,705 appointments from 10,579 in 2007–08 (an increase of 20.1 per cent), representing 22.4 per cent of all new hires;
- In addition to these appointments, 11,039 specified term hires, 18,699 casual hires and 14,247 student hires were made in 2008–09;
- While the number of student hires increased to 14,247 from 13,600 the previous year (an increase of 4.8 per cent), the number of appointments to term positions and casuals decreased slightly (by 2.0 per cent and 3.1 per cent respectively); and
- Hiring activity (total of all hiring activities) to the public service totalled 56,690 during 2008–09, an increase of 3.6 per cent from the previous fiscal year.
Figure 3. Overall Public Service Hiring Activities 2008-09
Source: PSC
hiring and staffing activities files
Figure 3. Overall Public Service Hiring Activities 2008-09 - Text version
Figure 4. Overall Public Service Hiring Activities 2007–08
Source: PSC
hiring and staffing activities files
Figure 4. Overall Public Service Hiring Activities 2007–08 - Text version
1.3 Recruitment of post-secondary graduates and general external recruitment
- In 2008–09, about 1,700 graduates were hired from the PSC's Post-Secondary Recruitment program, which represents approximately 42 per cent of the public service renewal target of 4,000 graduates; and
- In 2008–09, 48 candidates qualified for the Recruitment of Policy Leaders program, and 26 were appointed to the public service.
Table 1. Appointments to the Public Service
| Post-Secondary Recruitment program | Recruitment of Policy Leaders program | General | Total | ||||
|---|---|---|---|---|---|---|---|
| Indeterminate | Term | Indeterminate | Term | Indeterminate | Term | Indeterminate | Term |
| 1,363 | 334 | 26 | 0 | 11,316 | 10,705 | 12,705 | 11,039 |
| Total: 1,697 | Total: 26 | Total: 22,021 | Total: 23,744 | ||||
Source: Public Service Commission 2008-2009 Annual Report
1.4 Recruitment of students for temporary employment
- In 2008–09, FSWEP attracted 63,100 applicants, which led to 9,932 student hires;
- Compared with 2007–08, this represents a 7-per-cent increase in students applying to FSWEP;
- These students submitted a total of 150,123 applications to be considered for the general FSWEP inventory, as well as for the 23 targeted departmental student programs. Of these applications, there were 9,932 hires (6.6 per cent);
Table 2. Federal Student Work Experience Program activities
| Year | 2006-07 | 2007-08 | 2008-09 |
|---|---|---|---|
| Number of applicants | 71,402 | 58,681 | 63,100 |
| Hires | 9,574 | 9,810 | 9,932 |
Source: Public Service Resourcing System and PSC hiring and staffing activities files
- In 2008–09, more than 4,200 placements were made from the Post-Secondary Co‑op/Internship Program;
- The co-op/internship program has seen an increasing number of appointments over the years; and
- In 2008–09, 99 placements were made through the Research Affiliate Program (RAP).
Table 3. Student hiring activities 2008–09
| FSWEP | RAP | Co-op | Total |
|---|---|---|---|
| 9,932 | 99 | 4,216 | 14,247 |
Source: Public Service Commission 2008-2009 Annual Report
1.5 Time to staff
According to the Public Service Commission 2008-2009 Annual Report:
- The average time required to staff indeterminate advertised positions increased following the coming into force of the PSEA in December 2005. It then decreased as organizations started to adapt to the new staffing regime.
As reported in the PSC's Time to Staff in the Federal Public Service—An Update (October 2009), the average time required to staff an indeterminate advertised position was as follows:
- For the period from January 2000 to December 2003, it took an average of 22.8 weeks for appointments;
- This increased to an average of 24.1 weeks for the period from April 2006 to September 2007; and
- The average number of weeks for appointments fell to 23.5 for the period from October 2007 to September 2008.
In the same study, it was determined that there were a number of influential factors:
- More processes have become open to the public and now have a national area of selection; and
- The number of collective staffing processes has increased, and the processes take a longer time to staff.
1.6 Temporary help services
- A total of approximately $317 million was spent in 2008–09 on temporary help services. Temporary help services are defined in the Public Accounts of Canada as temporary services acquired for general office help, secretarial, stenographic technical or other temporary help, etc. (Source: Public Accounts of Canada 2008-2009);
- The PSC is concerned that temporary help agencies are being used as a means to circumvent the PSEA and accelerate the hiring process. When work is of an ongoing or lengthy, albeit temporary, nature, the PSC believes that merit-based appointment processes should be the norm. The PSC is also concerned that individuals hired through temporary help agencies may have an unfair advantage accessing Core Public Administration (CPA) appointments. To examine this issue further, the PSC is undertaking an audit across the CPA to examine whether temporary help services are being used to circumvent the legislated requirements and hiring process; and
- It should be noted that the use of temporary help agencies is governed by the Treasury Board's Contracting Policy. Individuals hired through this type of arrangement remain employees of the temporary help agency. Their employment is not governed by either the PSEA or the Public Service Labour Relations Act.
2. Internal MobilitySee footnote [22]
2.1 Overall public service hiring activities
- Growth, along with retirements and continued strong internal mobility, resulted in persistent high levels of staffing activity in 2008–09; and
- Organizations for which the PSC has delegated its authority to make appointments conducted a total of 69,961 internal staffing activities in 2008–09.
Figure 5. Overall Public Service Internal Staffing Activities 2008-09
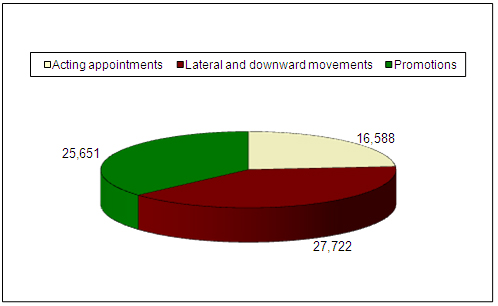
Figure 5. Overall Public Service Internal Staffing Activities 2008-09 - Text version
Figure 6. Overall Public Service Internal Staffing Activities 2007-08
Source: PSC
hiring and staffing activities files
Figure 6. Overall Public Service Internal Staffing Activities 2007-08 - Text version
2.2 Number of positions filled by priority placement
Table 4 shows the number of positions filled by priority placement.
| Priority type | Carry- over See footnote (a) | New cases | Total (carry-over + new cases) | Appointed | Resigned and/or retired | Expired | Other removal See footnote (b) | Total outflows | Active at end of period |
|---|---|---|---|---|---|---|---|---|---|
|
Notes:
|
|||||||||
| Leave of absence (sec. 41) | 309 | 266 | 575 | 146 | 23 | 34 | 33 | 236 | 339 |
| Layoff (sec. 41) | 4 | 15 | 19 | 2 | 0 | 3 | 0 | 5 | 14 |
| TOTAL — Statutory priorities | 313 | 281 | 594 | 148 | 23 | 37 | 33 | 241 | 353 |
| Surplus (sec. 5) | 165 | 107 | 272 | 102 | 24 | 0 | 49 | 175 | 97 |
| Disabled employee (sec. 7) | 46 | 71 | 117 | 19 | 1 | 17 | 12 | 49 | 68 |
| Medically released CF/RCMP (sec. 8) | 233 | 259 | 492 | 205 | 2 | 44 | 0 | 251 | 241 |
| Relocation of spouse (sec. 9) | 348 | 425 | 773 | 206 | 13 | 32 | 137 | 388 | 385 |
| Reinstatement to higher level (sec. 10) | 117 | 105 | 222 | 31 | 3 | 111 | 1 | 146 | 76 |
| Governor General's exempt staff (sec. 6) | 1 | 0 | 1 | 0 | 0 | 1 | 0 | 1 | 0 |
| TOTAL — Regulatory priorities | 910 | 967 | 1,877 | 563 | 43 | 205 | 199 | 1,010 | 867 |
| GRAND TOTAL | 1,223 | 1,248 | 2,471 | 711 | 66 | 242 | 232 | 1,251 | 1,220 |
2.3 Internal time to staff
The findings of PSC's Time to Staff in the Federal Public Service—An Update (October 2009) are consistent with the findings of PSC's analysis of the time elapsed between job postings and first notification of appointment for internal indeterminate advertised staffing processes on Publiservice (see Table 5).
The analysis of Publiservice data uses a different methodology and shows that the average time to staff for distinct processes dropped from 18.9 weeks (132 calendar days) in 2007–08 to 17.7 weeks (124 calendar days) in 2008–09.
The average time to staff for collective processes remained essentially the same, i.e. 22.1 weeks (155 calendar days) in 2007-2008 and 22 weeks (154 calendar days) in 2008-09.
Table 5. Average Length of Time for Internal Indeterminate Staffing Processes
| Type of process | Distinct processes | Collective processes | ||||
|---|---|---|---|---|---|---|
| Year | 2006–07 | 2007–08 | 2008–09 | 2006–07 | 2007–08 | 2008–09 |
Source: PSC Staffing Management Accountability Framework statistics Notes:
|
||||||
| Average time to staff (in days) See footnote 1 | 121 | 132 | 124 | 142 | 155 | 154 |
| Average time to staff (in days) for "best performing organizations" See footnote 2 | 93 | 102 | 80 | 100 | 117 | 106 |
2.4 Internal mobility in the public service
OCHRO's People Management Information Analysis and Survey Operations indicates the following:
- Over the past decade, the average time that employees stay in a position in the public service is approximately 4.5 years;See footnote [23] and
- The average time employees stay in a particular group and level is not available as it is affected by reclassifications; this obscures historical trends that might indicate mobility patterns.
2.5 Employees on leave without pay
- The number of employees on leave without pay over the last 10 years has been an average of 5.9 per cent, with the highest percentage in the last 3 years.
Table 6. Number of Employees on Leave Without Pay 2000–09
| March | Active | Leave Without Pay | % Leave Without Pay | Total |
|---|---|---|---|---|
|
Note: Data are from each year-end, March 31, 2000, to March 31, 2009. |
||||
| 2000 | 152,069 | 7,579 | 4.7% | 159,648 |
| 2001 | 161,505 | 8,511 | 5.0% | 170,016 |
| 2002 | 170,779 | 9,831 | 5.4% | 180,610 |
| 2003 | 174,581 | 10,425 | 5.6% | 185,006 |
| 2004 | 177,136 | 11,042 | 5.8% | 188,178 |
| 2005 | 184,083 | 12,077 | 6.1% | 196,160 |
| 2006 | 189,280 | 12,813 | 6.3% | 202,093 |
| 2007 | 192,683 | 13,809 | 6.6% | 206,492 |
| 2008 | 200,575 | 14,678 | 6.8% | 215,253 |
| 2009 | 209,523 | 15,395 | 6.8% | 224,918 |
2.6 Days worked versus days paid
- In the CPA for 2008–09, there were approximately 193,109 full-time equivalents (FTEs), each working an estimated 260 days in that year;
- Including 11 paid holidays, there were 9,744,381 paid days not worked over a total of 50,208,413 paid days, giving 19.4 per cent as the percentage of paid days not worked in that year;
- If paid holidays are not included, then there were 7,620,179 paid days not worked over the total 50,208,413 paid days, giving 15.2 per cent as the percentage of paid days not worked in that year; and
- Overtime is not included in the paid days since that information is not readily available in a usable form. There is no readily available data on when employees are being paid time and a half, double time, etc.
Table 7. Paid Days Worked Versus Days Paid Not Worked
| FTE | Paid Days Per FTE | Total Paid Days | Total Paid Leave Days | % of Paid Days Not Worked | Total Paid Holidays | % of Paid Days Not Worked Including Paid Holidays |
|---|---|---|---|---|---|---|
| 193,109.3 | 260 | 50,208,412.8 | 7,620,179 | 15.2% | 2,124,202.08 | 19.4% |
Source: OCHRO's People Management Information Analysis and Survey Operations
FTE converts all employees into units representing a full-time employee working for the whole year, regardless of their full-time or part-time status or whether they worked for a full year or for part of the year.
An employee's FTE is reduced when the employee works for part of the year or part-time. For example, if an employee has worked only 6 months out of 12, the employee is considered as 0.5 FTE instead of 1 FTE.
If an employee works 25 hours a week instead of a normal work week of 37.5 hours, the employee is considered as 0.667 FTE instead of 1 FTE. An employee who works 25 hours a week instead of a normal work week of 37.5 hours and has worked only 6 months out of 12 is considered as 0.333 FTE instead of 1 FTE.
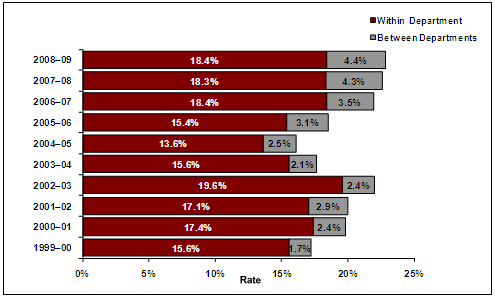
2.7 Intradepartmental and Interdepartmental MobilitySee footnote [24]
- A higher percentage of individuals move within departments, and the rate has remained relatively constant over the last three years.
Figure 7. CPA Indeterminate Mobility Rates Within and Between Departments
Note: Data are from
each year-end, March 31, 2000, to March 31, 2009.
Figure 7. CPA Indeterminate Mobility Rates Within and Between Departments - Text version
2.8 Promotion and transfer rates
- A few groups account for over
two thirds of all promotions over the 10-year-period
1999–2009:- CR—Clerical and Regulatory
- PM—Program Administration
- AS—Administrative Services
- ES/EC—Economics, Sociology and Statistics
- CS—Computer Systems Administration
- The majority of lateral transfers originated in these same groups.
- The
majority of movements occurred in the following departments:
- Department of Human Resources and Skills Development
- Department of National Defence
- Correctional Service of Canada
- Department of Public Works and Government Services
- Department of Health
- Department of Fisheries and Oceans
- More than half of all such movements originated in the above departments.
Figure 8. CPA Promotion and Transfer Rates
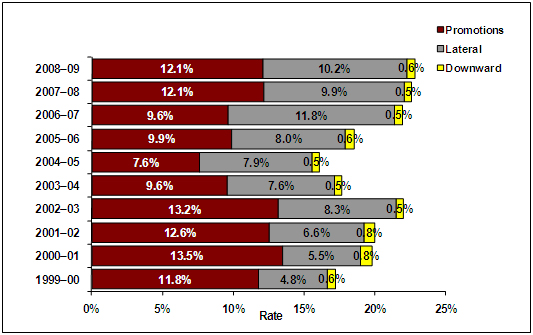
Note: Data are from
each year-end, March 31, 2000, to March 31 2009.
Figure 8. CPA Promotion and Transfer Rates - Text version
3. How People Leave the Public Service
- Of the approximately 9,700 indeterminate employees who left the public service in 2008–09, most left through retirement; and
- Resignations represented only 1.4 per cent of the indeterminate population.
3.1 Departures from the Core Public Administration
- Figure 9 indicates the indeterminate departure rate by type of departure and shows that retirements have steadily increased since 2003–04.
Figure 9. Indeterminate CPA Departure Rates by Type
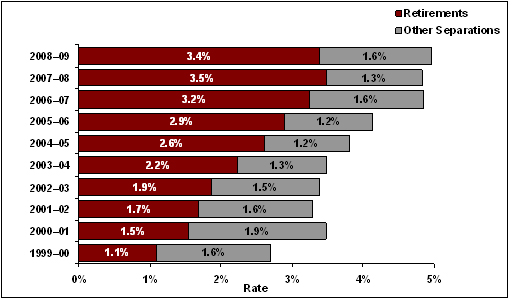
Note: Data are from each
year-end, March 31, 2000, to March 31 2009.
Figure 9. Indeterminate CPA Departure Rates by Type - Text version
3.2 Other separations
Reasons for other separations are resignations, dismissals, layoffs, ASD, movement to a separate employer and others (see Table 8).
Table 8. Volumes of Separations in the Core Public Administration by Reason
| Reason | 1999–2000 | 2000–01 | 2001–02 | 2002–03 | 2003–04 | 2004–05 | 2005–06 | 2006–07 | 2007–08 | 2008–09 |
|---|---|---|---|---|---|---|---|---|---|---|
|
Notes:
|
||||||||||
| Resignation | 1,695 | 1,838 | 1,532 | 1,254 | 1,224 | 1,241 | 1,379 | 1,622 | 1,692 | 1,941 |
| Dismissal | 108 | 77 | 112 | 120 | 148 | 126 | 138 | 115 | 147 | 183 |
| Layoff | 82 | 54 | 43 | 79 | 35 | 32 | 29 | 11 | 16 | 31 |
| ASD* | 114 | 4 | 58 | 243 | 31 | 9 | 0 | 512 | 6 | 228 |
| To Separate Employer | 54 | 99 | 257 | 226 | 228 | 281 | 431 | 835 | 598 | 618 |
| All other | 447 | 337 | 250 | 260 | 308 | 274 | 334 | 299 | 311 | 313 |
| Total | 2,500 | 2,409 | 2,252 | 2,182 | 1,974 | 1,963 | 2,311 | 3,394 | 2,770 | 3,314 |
Table 9. Rejection during Probation by Fiscal Year
| 1999– 2000 | 2000– 01 | 2001– 02 | 2002– 03 | 2003– 04 | 2004– 05 | 2005– 06 | 2006– 07 | 2007– 08 | 2008– 09 |
|---|---|---|---|---|---|---|---|---|---|
| 20 | 30 | 25 | 36 | 50 | 32 | 36 | 32 | 74 | 100 |
Figure 10 indicates other separation volumes in the CPA by voluntary and involuntary reason.
Figure 10. Other CPA Separation Volumes by Reason
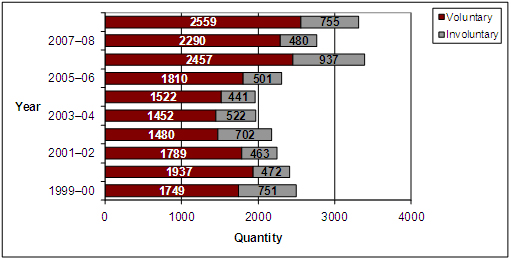
Figure 10. Other CPA Separation Volumes by Reason - Text version
Note: Data are from each year-end, March 31, 2000, to March 31 2009.
Figure 11 indicates other separation volumes in the CPA by voluntary and involuntary reason, separated as percentages.
Please note that there is no exact standard for defining what voluntary and involuntary departures are; the information provided in Figure 11 should be used as an approximation only.
Figure 11. Other Separation Volumes by Reason Separated as Percentages
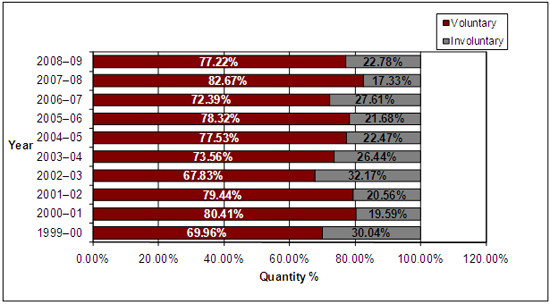
Note: Data are from each
year-end, March 31, 2000, to March 31 2009.
Figure 11. Other Separation Volumes by Reason Separated as Percentages - Text version
Table 10 indicates the indeterminate departure rate by type of departure and department.
Table 10. Indeterminate Departure Rates by Department for 2008–09
| Department/Organization | Other Separations |
Retirements | Total |
|---|---|---|---|
|
Note: Data are from each year-end, March 31, 2000, to March 31 2009. |
|||
| Atlantic Canada Opportunities Agency | 0.4% | 2.5% | 2.9% |
| Department of Agriculture and Agri-Food | 1.7% | 3.2% | 5.0% |
| Public Health Agency of Canada | 1.6% | 1.5% | 3.2% |
| Canadian Artists and Producers Professional Relations Tribunal | 0.0% | 0.0% | 0.0% |
| Canadian Transportation Agency | 2.8% | 8.9% | 11.7% |
| Library and Archives of Canada | 1.0% | 5.0% | 6.1% |
| Canadian International Trade Tribunal | 1.4% | 2.9% | 4.3% |
| Canada Border Services Agency | 1.2% | 2.4% | 3.6% |
| Courts Administration Service | 0.9% | 3.2% | 4.1% |
| Canadian Dairy Commission | 0.0% | 0.0% | 0.0% |
| Office of the Chief Electoral Officer | 1.8% | 1.8% | 3.7% |
| Canada School of Public Service | 1.0% | 4.0% | 5.0% |
| Canadian Grain Commission | 1.5% | 2.8% | 4.3% |
| Canadian Intergovernmental Conference Secretariat | 0.0% | 9.5% | 9.5% |
| Canada Industrial Relations Board | 2.2% | 4.4% | 6.7% |
| Office of the Commissioner of Official Languages | 2.1% | 4.1% | 6.2% |
| Copyright Board | 0.0% | 0.0% | 0.0% |
| Military Police Complaints Commission | 0.0% | 16.7% | 16.7% |
| Canadian Space Agency | 1.8% | 1.5% | 3.3% |
| Department of Human Resources and Skills Development | 2.1% | 4.2% | 6.3% |
| NAFTA Secretariat – Canadian Section | 0.0% | 0.0% | 0.0% |
| Office of the Co-ordinator, Status of Women | 7.2% | 1.2% | 8.4% |
| Department of Fisheries and Oceans | 1.4% | 3.9% | 5.3% |
| Department of National Defence | 1.5% | 3.3% | 4.8% |
| Department of the Environment | 1.4% | 3.3% | 4.7% |
| Department of Industry | 1.1% | 3.8% | 4.9% |
| Department of Veterans Affairs | 1.3% | 3.2% | 4.5% |
| Canadian Environmental Assessment Agency | 2.7% | 2.0% | 4.8% |
| Department of Foreign Affairs and International Trade | 1.4% | 3.8% | 5.2% |
| Canadian Forces Grievance Board | 4.9% | 0.0% | 4.9% |
| Department of Finance | 2.6% | 2.8% | 5.4% |
| Office of the Commissioner for Federal Judicial Affairs | 0.4% | 4.7% | 5.2% |
| National Farm Products Council | 0.0% | 6.7% | 6.7% |
| Economic Development Agency of Canada for the Regions of Quebec | 0.5% | 2.7% | 3.2% |
| Office of the Governor General's Secretary | 1.3% | 2.0% | 3.3% |
| Canadian Human Rights Commission | 4.5% | 5.1% | 9.6% |
| Public Service Human Resources Management Agency of Canada | 0.8% | 5.8% | 6.6% |
| Department of Indian Affairs and Northern Development | 2.4% | 3.2% | 5.6% |
| Indian Specific Claims Commission | 17.1% | 5.7% | 22.9% |
| Canadian International Development Agency | 1.1% | 3.7% | 4.8% |
| International Joint Commission | 4.2% | 12.5% | 16.7% |
| Department of Citizenship and Immigration | 1.0% | 2.9% | 3.9% |
| Office of Infrastructure of Canada | 0.0% | 0.9% | 0.9% |
| Office of the Information Commissioner of Canada | 0.0% | 5.2% | 5.2% |
| Indian Residential Schools Resolution Canada | 2.6% | 0.6% | 3.2% |
| Immigration and Refugee Board | 3.8% | 2.7% | 6.4% |
| Department of Justice | 1.1% | 1.9% | 3.0% |
| Office of the Commissioner of Lobbying | 0.0% | 4.5% | 4.5% |
| Hazardous Materials Information Review Commission | 0.0% | 0.0% | 0.0% |
| Department of Transport | 1.3% | 3.7% | 4.9% |
| Department of Health | 2.5% | 2.2% | 4.6% |
| National Parole Board | 0.9% | 4.8% | 5.8% |
| Department of Canadian Heritage | 0.8% | 2.5% | 3.2% |
| Privy Council Office | 0.9% | 2.0% | 2.9% |
| Correctional Service of Canada | 1.4% | 2.9% | 4.3% |
| Passport Canada | 4.4% | 1.7% | 6.1% |
| Public Service Commission | 0.9% | 4.9% | 5.8% |
| Department of Public Safety and Emergency Preparedness | 0.6% | 2.6% | 3.2% |
| Canadian Human Rights Tribunal | 0.0% | 0.0% | 0.0% |
| Patented Medicine Prices Review Board | 7.1% | 2.4% | 9.5% |
| Assisted Human Reproduction Agency of Canada | 0.0% | 0.0% | 0.0% |
| Royal Canadian Mounted Police (Civilian Staff) | 2.8% | 2.9% | 5.6% |
| Registry of the Competition Tribunal | 0.0% | 0.0% | 0.0% |
| Royal Canadian Mounted Police External Review Committee | 0.0% | 0.0% | 0.0% |
| Royal Canadian Mounted Police Public Complaints Commission | 15.4% | 0.0% | 15.4% |
| Department of Natural Resources | 1.0% | 3.8% | 4.8% |
| Canadian Radio-television and Telecommunications Commission | 1.2% | 6.7% | 7.9% |
| Statistics Canada | 1.0% | 4.7% | 5.7% |
| Office of the Registrar of the Supreme Court of Canada | 0.0% | 4.1% | 4.1% |
| Department of Public Works and Government Services | 1.1% | 4.7% | 5.8% |
| Transportation Appeal Tribunal of Canada | 0.0% | 0.0% | 0.0% |
| Treasury Board Secretariat | 1.2% | 3.5% | 4.7% |
| Canadian Transportation Accident Investigation and Safety Board | 1.0% | 4.9% | 5.8% |
| Public Service Staffing Tribunal | 4.2% | 0.0% | 4.2% |
| Department of Western Economic Diversification | 3.8% | 3.8% | 7.6% |
Appendix A1—Comparison of Mobility Analysis Methodologies of the Public Service Commission and the Office of the Chief Human Resources Officer
| Population Base | Public Service Commission | Office of the Chief Human Resources Officer | |
|---|---|---|---|
|
|
||
| Population Flows | Hires |
|
|
| Promotions |
|
|
|
| Lateral and Downward Transfers |
|
|
|
| Acting Appointments |
|
|
|
| Separations |
|
|
|
|
|||
Appendix B: Methodology
With a view to advancing key people management priorities, the Chief Human Resources Officer invited members of PSMAC to establish four subcommittees and examine recommendations on different areas of people management. The PSMAC Subcommittee on People Resourcing was thus created and started to identify means of improving the public service's ability to place the right people in the right jobs at the right time.
For the purpose of this exercise, the key stakeholders of the federal public service's people resourcing system are managers, HR professionals, candidates/employees and system-wide elements. The third category includes public service employees/workers, feeder groups, as well as candidates to public service jobs. Together, they form the human capital required by organizations to deliver on their mandate. The system-wide element refers to the pan–public service dimension of the system, which would benefit from a collaborative and coherent approach. All of these stakeholders interact with one another as depicted in Figure 12.
Figure 12. Stakeholder Interaction Within People Resourcing
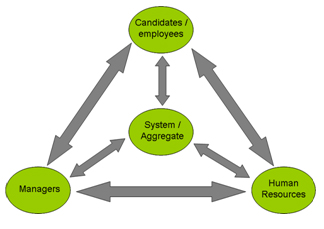
Figure 12. Stakeholder Interaction Within People Resourcing - Text version
We considered that all these stakeholders needed to be engaged early in our study in order to allow for the end-results to be linked to existing needs, challenges and areas of priority. The Subcommittee solicited the input and opinion of HR professionals and managers to clarify the characteristics of an optimal people resourcing system, to assess the current state of people resourcing in the public service, and to identify gaps and strategies to address these gaps.
Since the results of the Subcommittee should be based on evidence, it consulted previous work, projects, reports and initiatives conducted on the same issues and used them as building blocks for this report, including the following:
- "Diagnostic of the State of HRM Capacity Challenges Facing Line Managers" (2008);
- "HR Capacity Building for Line Managers: Addressing Current and Future Needs" (2008);
- Footage and interviews from the 8th Annual National Managers' Community Development Forum (2008);
- National Managers' community focus group sessions: "Dialogue with Senior Leaders—A Follow-up on E-Polling Results;
- The HR Capacity Building Strategy (2005);
- PE Community: Potential Recruitment Model 2005–06 to 2010–11; and
- Demographic of the PE Occupational Group (2010).
Characteristics of an Optimal People Resourcing System
The following stakeholders provided their views—at a high level—on what they consider to be an efficient and effective people resourcing system:
- Representatives from departments of the Subcommittee's members;
- Representatives from the National Managers' Community (NMC);
- Chairs of the Human Resources Planning Interdepartmental Network (HRPIN); and
- Chairs of the National Staffing Council (NSC).
The brainstorming session resulted in the identification of six characteristics of an optimal people resourcing system.
Gaps
Following these brainstorming sessions, existing material (e.g., past focus group results, surveys, reports, etc.) was reviewed with a purpose of compiling a list of gaps perceived by managers and HR professionals. The list was used as a prompt for focus groups that included the following participants:
- Representatives from the NMC (from the regions and the NCR);
- HR representatives from various departments (from the regions and the NCR);
- Chairs of the HRPIN;
- Chairs of the NSC; and
- Chair of the Organization and Classification Council (OCC).
The Subcommittee recognized that its objective is not to address all identifiable gaps, but rather to identify the gaps that are the most important and require immediate attention, based on current and future needs. In this light, participants were asked to select their top three gaps in order to focus on the most pressing issues perceived by these communities.
The following questions were presented to participants for their consideration:
- Where are the most significant gaps?
- What are the most timely and relevant gaps given the fiscal environment set out in the budget?
- What issues would benefit most from the attention of the deputy heads?
- Where can deputy heads make the most impact?
- Where possible, what issues offer the potential for short term results or "quick wins"?
This exercise led to the development of narratives that provided committee members with a raw testimony of issues and gaps in the existing system. In addition, it provided committee members with a set of priorities and statements that illustrated each one.
Narratives were also drawn from the following:
- Discussions with employees newly recruited to the public service about their experience;
- Information recently gathered through the PSMA review;
- Different survey results (e.g., an independent survey conducted by Decode);
- Discussions that took place with post-secondary graduates looking for employment at public service career fairs; and
- Feedback provided by post-secondary institutions from different regions.
The narrative for the system-wide perspective was developed based on an analysis of the themes, gaps and priorities that were discussed during the focus groups sessions, one-on-one consultations and available analyses and reference materials.
Following the identification and validation of the high priority gaps, it was determined that finding solutions for systemic gaps would generate the most significant improvement to the existing people resourcing system and lead to a more coordinated, cost-effective and collaborative approach.
Recommendations
Once the gaps were identified, an additional series of mixed focus groups were organized with the following partners:
- Representatives from the NMC (from the regions and the NCR);
- HR representatives from various departments (from the regions and the NCR);
- Chairs of the HRPIN;
- Chairs of the NSC; and
- Chair of the OCC.
The mixed format of the focus groups allowed us to benefit from a variety of experience and increased the likelihood that the proposed solutions would be aligned both with their needs and with those of the system.
The focus groups validated the gaps identified by the first set of consultations and then discussed a set of strategies to address these common gaps.
Both focus groups were asked to suggest solutions to the first gap:
- Key players have not embraced integrated business/HR planning as a meaningful driver for people management and staffing.
While the remaining gaps were split between the focus groups as follows:
Focus group 1:
- Unclear roles, responsibilities, expectations and accountabilities contribute to a risk adverse staffing culture; and
- Tools are not consistently designed with stakeholders to meet the needs articulated by users.
Focus group 2:
- The current culture/behaviours do not facilitate collaborative relationships between managers and HR; and
- Existing tools and technology need to be better leveraged to ensure improved coherence, accessibility and availability (e.g., improved just-in-time staffing).
This approach proved to be more conducive to results, allowing us to obtain the level of information we were seeking.
Four recommendations are presented in this report. Given the current environmental context, these are considered the timeliest and attain balance between achieving tangible outcomes in a relatively short time span and longer-term opportunities.
With the exception of the recommendation pertaining to branding, the recommendations presented in this report are solutions jointly identified and discussed during the focus groups.
Appendix C: Characteristics of an Optimal People Resourcing System
According to the stakeholders consulted, an optimal people resourcing system would feature the following characteristics and elements:
1. Flexibility and Efficiency
An optimal people resourcing system should be as follows:
- Open to innovation and smart risk taking;
- Responsive to the evolution of business needs;
- Conducive to the creation of partnerships;
- Adaptable to a shifting environment; and
- Focused on timely and effective processes.
2. Effective Workforce Planning and Management
Effective workforce planning and management in this context is a continuous process that must include and integrate all elements pertaining to employee management, including the following:
- Identification and assessment of the organization's needs;
- Translating these needs into appropriate recruitment and staffing approaches;
- Integration of employees or on-boarding;
- Employees' development after arrival; and
- Performance management.
For example, better planning and management of on-boarding activities can greatly enhance employee performance and retention.
3. A Distinctive Brand
To become an employer of choice in a competitive labour market and to be able to attract candidates at various stages of their career (e.g., post-secondary recruits, mid-career), the public service must present a distinctive, positive and realistic image that will influence Canadians' perception of a career in the federal public service.
An effective branding and marketing strategy contributes to an optimal people resourcing system by:
- Using the right media to reach out to a range of targeted audiences;
- Presenting in clear language how the work is aligned with results for Canadians;
- Reflecting the public service values and ethics;
- Communicating job opportunities in a simple, dynamic and accessible fashion;
- Ensuring ongoing communication throughout the hiring process; and
- Being adaptable and complimentary to departmental branding and outreach;
4. Healthy Relationships
Healthy and constructive relationships in this context are based on trust where there is a mutual understanding of the stakeholders' needs, expectations and objectives.
An optimal people resourcing system must support trusting relationships between the HR community and managers, central agencies and departments, national headquarters with the regions and interdepartmental partnerships to allow for:
- Joint problem solving;
- Jointly negotiated service delivery models and standards;
- Mutual acceptance and management of risk;
- Defined roles, responsibilities and accountabilities, including delegation (e.g., true ability to make decisions);
- Continuous sharing of knowledge and tools; and
- Consistency of approaches.
5. Reliable and Practical Tools
A people resourcing system must build on current tools and systems and link directly to public service renewal (renewing the workplace), the Public Service Staffing Modernization Project, and existing collective recruitment tools (e.g., the Post-Secondary Recruitment campaign). Where feasible, the system should include standardized tools that strengthen departments' partnerships, achieve economies of scale and limit duplication of efforts, such as the Common Human Resources Business Process.
By leveraging tools and technology, the public service will be taking advantage of a variety of mechanisms that facilitate the resourcing process. These mechanisms will enrich the candidates' experience and enable the federal public service to attract the type of candidates it needs, as well as provide departments with the tools to support just-in-time staffing.
Such systems and tools should be interoperable and user-friendly, and provide reliable data to facilitate talent management and data transfer. They will:
- Provide a focal point for facilitating collective processes and sharing best practices;
- Build in monitoring and service standards to reduce the administrative burden associated with staffing activities;
- Facilitate data transfer from PSC systems to departments;
- Support communication with candidates allowing flexibility for personalization (e.g., "My Account");
- Manage through the various phases of a selection process;
- Include an updated pan-public service bank of interoperable or compatible tools, such as statements of merit criteria, rating guide builders, interview and reference check questions, and a variety of exam banks; and
- Include tools that allow for more efficient and just-in-time staffing. These
could include but are not limited to:
- Public service–wide essentially assessed and partially assessed pools (e.g., post-secondary, functional communities, term, etc.);
- Public service–wide databanks to match potential candidates' interest for temporary and deployment opportunities including assignments and secondments;
- Public service–wide databank to identify casuals available for hire;
- Public service–wide transferability of assessments based on a formal evaluation of competencies;
- Competency-based screening, planning and assessment; and
- Self-assessment competency-based tool.
6. Sound Governance
An optimal people resourcing system should leverage existing governance systems and structures (e.g., Human Resources Community Operating Model).31
Sound governance in people management requires the following:
- Effective decision making by delegated persons;
- Consistent consultation and consideration of stakeholders' input;
- Stakeholder engagement (a sense of ownership and trust);
- Collaborative, cohesive policies and processes;
- Clear accountability;
- Reduced duplication; and
- Public service–wide alignment.
Return to footnote reference[1] For definitions of key terms, see the Glossary.
Return to footnote reference[2] The data used in the quantitative analysis was provided by the Public Service Commission and the Office of the Chief Human Resources Officer at the Treasury Board Secretariat (the Secretariat).
Return to footnote reference[3] Public Service Commission 2007-2008 Annual Report and Public Service Commission 2008-2009 Annual Report (draft).
Return to footnote reference[4] Office of the Chief Human Resources Officer (OCHRO) people management information analysis.
Return to footnote reference[5] OCHRO people management information analysis.
Return to footnote reference[6] PSC CR-03 and AS-02 inventory advertisements.
Return to footnote reference[7] OCHRO people management information analysis.
Return to footnote reference[8] PSC, Time to Staff in the Federal Public Service—An Update, October 2009.
Return to footnote reference[9] Public Service Commission 2008-2009 Annual Report.
Return to footnote reference[10] Diagnostic of the State of HRM Capacity Challenges Facing Line Managers, February 2008, and focus group consultations.
Return to footnote reference[11] Further information is available at chrbp-pocrh.tbs-sct.gc.ca/.
Return to footnote reference[12] Focus group consultations.
Return to footnote reference[13] Focus group consultations.
Return to footnote reference[14] Public Service Commission 2007-2008 Annual Report.
Return to footnote reference[15] Focus group consultations.
Return to footnote reference[16] Focus group consultations.
Return to footnote reference[17] Interviews at the 8th Annual National Managers' Community Development Forum, 2008.
Return to footnote reference[18] Focus group consultations.
Return to footnote reference[19] Public Service Commission 2009-2010 Annual Report.
Return to footnote reference[20] Please note that the data contained in this document have been provided by the PSC Data Services and Analysis Directorate and the Secretariat. Where the source of the information is the PSC, the definition of the public service is the same as the definition in the PSEA. For the information provided by the Secretariat, the public service is defined as the Core Public Administration (CPA).
Return to footnote reference[21] The data in this section has been provided by the Public Service Commission 2008-2009 Annual Report and as a result refers to the public service at it is defined by the PSEA.
Return to footnote reference[22] A table that outlines the differences between how mobility is defined for the PSC and OCHRO can be found in Appendix A1.
Return to footnote reference[23] Please note that this statement refers to the Core Public Administration.
Return to footnote reference[24] The data is this section has been provided by OCHRO; as a result, the public service is defined as the Core Public Administration.
- Date modified: