
Treasury Board of Canada Secretariat
www.tbs-sct.gc.ca
Common menu bar links
Breadcrumb Trail
ARCHIVED - Industry Canada - Report
 This page has been archived.
Archived Content
Information identified as archived on the Web is for reference, research or recordkeeping purposes. It has not been altered or updated after the date of archiving. Web pages that are archived on the Web are not subject to the Government of Canada Web Standards. As per the Communications Policy of the Government of Canada, you can request alternate formats on the "Contact Us" page.
Section 3: Supplementary Information
 Financial Highlights
| (in thousands of dollars) | % Change | 2011 | 2010 (Restated) |
|---|---|---|---|
| Assets | |||
| Financial sssets | -41 | 783,030 | 1,318,021 |
| Non-financial assets | -3 | 98,334 | 101,292 |
| TOTAL | -38 | 881,364 | 1,419,313 |
| Liabilities | |||
| Accounts payable and accrued liabilities | -50 | 437,258 | 686,844 |
| Deferred revenue | -14 | 3,775,636 | 4,376,729 |
| Other liabilities | -2 | 512,910 | 523,182 |
| Total liabilities | -18 | 4,725,804 | 5,768,755 |
| Equity | -12 | (3,844,440) | (4,349,442) |
| TOTAL | -38 | 881,364 | 1,419,313 |
| (in thousands of dollars) | % Change | 2011 | 2010 (Restated) |
|---|---|---|---|
| Expenses | |||
| Transfer payments | -14 | 1,329,185 | 1,549,602 |
| Operating expenses | -4 | 800,884 | 832,053 |
| Total expenses | -11 | 2,130,069 | 2,381,655 |
| Revenues | |||
| Sales of services | 0 | 1,109,189 | 1,103,940 |
| Other | -13 | 16,581 | 19,156 |
| Total revenues | 0 | 1,125,770 | 1,123,096 |
| NET COST OF OPERATIONS | -20 | 1,004,299 | 1,258,559 |
Financial Highlights Charts/Graphs and Summary of 2011 Financial Results
The financial results presented in Industry Canada financial statements are shaped by the three strategic objectives that aim to help make Canadian industry more productive and competitive in the global economy, thus improving the economic and social well-being of Canadians.
In 2010–11, Industry Canada continued to manage numerous stimulus grants and contributions projects through Canada's Economic Action Plan and maintained an increased level of transfer payment expenses when compared with historic departmental levels. The Government of Canada announced a set of initiatives aimed at providing a quick recovery from the economic downturn and at improving access to financing, supporting small businesses, helping municipalities build stronger communities through investments in infrastructure, and providing short-term support for key industrial and commercial sectors.
Effective August 13, 2009, responsibility for the Southern Ontario Regional Economic Development Branch was transferred to the newly created Federal Economic Development Agency for Southern Ontario in accordance with Order-in-Council P.C. 2009-1411, including the stewardship responsibility for the assets and liabilities related to the program. Due to the timing and the logistical requirements for creating a new entity, the Federal Economic Development Agency for Southern Ontario remained consolidated within Industry Canada's financial records for the purpose of Public Accounts reporting until March 31, 2010. Fiscal year 2009–10 as reported here has been restated to reflect the transfer of assets and liabilities to the Federal Economic Development Agency for Southern Ontario as at August 13, 2009.
Assets
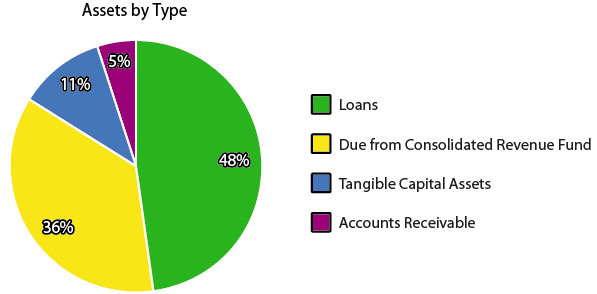
Total assets were $881 million for 2010–11, a decrease of $652 million (43 percent). This decrease can be mostly attributed to the changes in the Due from Consolidated Revenue Fund account, which is dependent on year-end payable levels in the Department. It is a representation of the funds the Department has access to for discharging its liabilities without requiring further parliamentary approvals. There was an increase in loans provided during the year for approximately $60 million but an overall decrease in net loans. The increase in loans can be partially attributed to the Industrial Technologies Office (ITO), which provided loans through the SADI program to seven new competitive projects with aerospace and defence (A&D) firms. These projects helped foster collaboration in R&D between firms and academia across the country, including the University of British Columbia, Université Laval and École Polytechnique de Montréal. The overall decrease in net loans is the result of large unconditionally repayable contributions reaching the end of their work phase under the Strategic Industrial Projects program. When reaching this phase, non-interest-bearing loans carry discounts so that the net loans on the departmental financial statements represent their approximate market value.
Liabilities
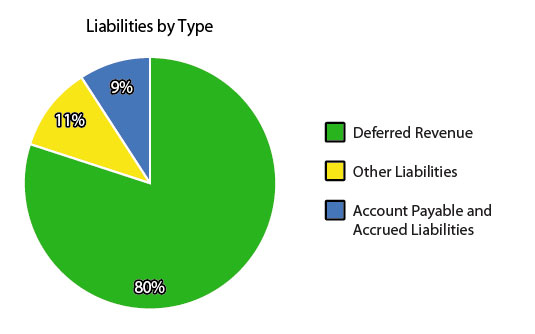
Total liabilities were $4.72 billion for 2010–11, a decrease of $1.04 billion (18 percent). Accounts Payable decreased by 50 percent this fiscal year, a decrease that can be attributed to timing differences for large grants and contributions payments during this fiscal year compared with last. Payment requisitions made near year-end in 2009–10 for some large stimulus contribution programs inflated the account. Contributing to this decrease in liabilities was a decrease in deferred revenue for $600 million. Much of this decrease is the recognition of radio spectrum licences sold in the 2 GHz range by auctions in prior fiscal years and recognized as revenue over the period of the licence. Radio licences are managed by the Marketplace Frameworks and Regulations for Spectrum, Telecommunications and the Online Economy.
Expenses
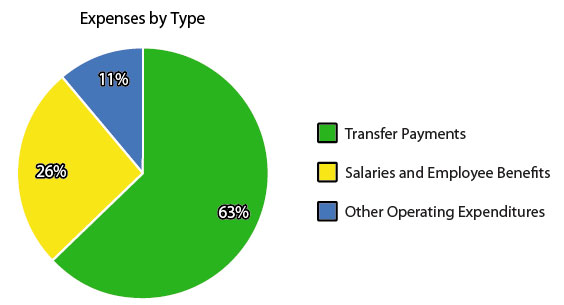
Total expenses were $2.13 billion in 2010–11, a decrease of $252 million (11 percent). While the level of transfer payment expenses was, for the second straight fiscal year, higher than normal for the Department, a decrease in payments made under Canada's Economic Action Plan explains the reduction in expenses year-over-year. Program expenses reduced this fiscal year by approximately $245 million for the Knowledge Infrastructure Program (costs for the program remain estimated at $2 billion overall for the program) under Canada's Research and Innovation Capacity. The program was extended one fiscal year with the remaining $245 million in funding transferred to the next fiscal year. This program was designed to enhance infrastructure to Canadian colleges and universities. Several other transfer payment programs with prior year expenses of approximately $208 million were removed from the departmental reporting structure as FedDev Ontario became an independent organization in 2009–10. This includes programs such as the Community Adjustment Fund, the Ontario Potable Water Program, the Southern Ontario Development Program and the Recreational Infrastructure Canada Program. These reductions are reflected in the departmental financial statements as adjustments to the prior fiscal year. Operating expenses for the Department have remained in the $800-million range and have decreased slightly with the transfer out of FedDev Ontario and with a departmental reduction in professional service spending.
Revenue
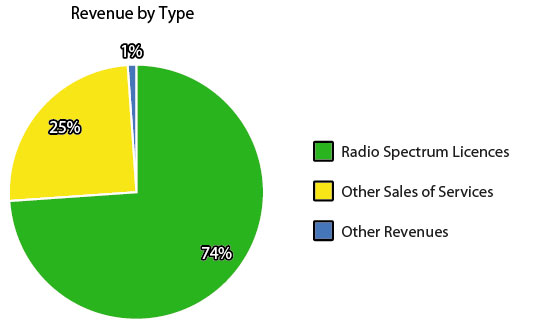
Total revenues were $1.13 billion in 2010–11, an increase of approximately $3 million and consistent with reported revenues in 2009–10. The majority of reported revenue in the departmental financial statements is attributed to the recognition of radio spectrum revenue managed by the Marketplace Frameworks and Regulations for Spectrum, Telecommunications and the Online Economy. This type of revenue reflects the recognition of radio spectrum auction licence fees received in prior fiscal years, particularly, $4.26 billion received and deferred in 2008–09 for the 2 GHz range. Other sales of services represent legislative fees and registrations through organizations such as Corporations Canada ($12 million), the Office of the Superintendent of Bankruptcy ($46 million), Competition Bureau ($22 million) and Measurement Canada ($1 million), who report under Marketplace Frameworks and Regulations.
Financial Statements
The financial highlights presented within this DPR are intended to serve as a general overview of Industry Canada's financial position and operations. The Department's financial statements can be found at http://www.ic.gc.ca/eic/site/ic1.nsf/eng/06765.html.
List of Supplementary Information Tables
All electronic supplementary information tables found in the 2010–11 Departmental Performance Report can be found on the Treasury Board of Canada Secretariat's website at http://www.tbs-sct.gc.ca/dpr-rmr/2010-2011/index-eng.asp.
Details on Transfer Payment Programs
Green Procurement
Horizontal Initiatives
Internal Audits and Evaluations
Response to Parliamentary Committees and External Audits
Sources of Respendable and Non-Respendable Revenue
Up-Front Multi-Year Funding
User Fees Reporting
Section 4: Other Items of Interest
Organizational Contact Information
We welcome your comments on this report by email to info@ic.gc.ca, by fax to 613-957-6543 or by mail to:
Planning, Performance and Reporting Group
Comptrollership and Administration Sector
Industry Canada
235 Queen Street
2nd Floor, East Tower
Ottawa ON K1A 0H5
Information Management and Information Technology (IM/IT) Governance and Responsibilities at Industry Canada
This information is available online at http://www.ic.gc.ca/eic/site/ic1.nsf/eng/06787.html.
Expected Results Information for Program Sub-Activities and Sub-Sub-Activities by Strategic Outcomes
The Canadian Marketplace is Efficient and Competitive
Science and Technology, Knowledge, and Innovation are Effective Drivers of a Strong Canadian Economy
Competitive Businesses are Drivers of Sustainable Wealth Creation
Corporate Risk Profile Table
This information is available online at http://www.ic.gc.ca/eic/site/ic1.nsf/eng/06788.html.
-
OECD, "Indicators of Product Market Regulation" (Paris: OECD, 2008).
(http://www.oecd.org/document/36/0,3343,en_2649_34323_35790244_1_1_1_1,00.html) -
The World Bank, "Ease of Doing Business Index" (Washington, D.C.: The Bank, 2011).
(http://www.doingbusiness.org/data/exploreeconomies/canada#Startin) -
The World Bank, "Starting a Business in Canada" (Washington, D.C.: The Bank, 2011).
(http://www.doingbusiness.org/data/exploreeconomies/canada/starting-a-business) -
World Economic Forum, The Global Competitiveness Report, 2010-2011 (Geneva: World Economic Forum, 2010). (http://www3.weforum.org/docs/WEF_GlobalCompetitivenessReport_2010-11.pdf)
-
The Conference Board of Canada, Exploring Canada's Innovation Character: Benchmarking Against Global Best (Ottawa: CBoC, 2004), pp. 13-14.
(http://www.conferenceboard.ca/e-Library/abstract.aspx?did=813) -
OECD, Main Science and Technology Indicators (MSTI): 2010/2 Edition (Paris: OECD, 2010), p. 25
(http://www.oecd.org/document/33/0,3343,en_2649_34451_1901082_1_1_1_1,00.html) -
OECD, Main Science and Technology Indicators (MSTI): 2010/2 Edition (Paris: OECD, 2010), p. 25
(http://www.oecd.org/document/33/0,3343,en_2649_34451_1901082_1_1_1_1,00.html) -
Instituto Nacional de Estadistěca, Year 2010 Press Release
(http://www.ine.es/en/prensa/np654_en.pdf) -
BCStats, Small Business Profile 2010 (Victoria: BC Stats, June 2010), p. 16.
(http://www.bcstats.gov.bc.ca/data/bus_stat/busind/sm_bus/SBP2010.pdf) -
Statistics Canada, Canadian Business Patterns (Ottawa: Statistics Canada, December 2010). Available on CD-ROM at
http://www.statcan.gc.ca/daily-quotidien/110802/dq110802a-eng.htm - The Global Competitiveness Report, 2011–2012, World Economic Forum.
(http://www3.weforum.org/docs/WEF_GCR_Report_2011-12.pdf)