Common menu bar links
Breadcrumb Trail
ARCHIVED - Canadian Space Agency - Report
 This page has been archived.
Archived Content
Information identified as archived on the Web is for reference, research or recordkeeping purposes. It has not been altered or updated after the date of archiving. Web pages that are archived on the Web are not subject to the Government of Canada Web Standards. As per the Communications Policy of the Government of Canada, you can request alternate formats on the "Contact Us" page.
Section 3: Supplementary Information
3.1 Financial Highlights
3.1.1) Condensed Statement of Financial Position
| (As at March 31) | Percentage Variance | 2011 | 2010 | |
|---|---|---|---|---|
| Total | (2.8%) | 1,401,295 | 1,441,861 | |
| Assets | Total Assets | (2.8%) | 1,401,295 | 1,441,861 |
| Liabilities | Total Liabilities | 19.7% | 136,781 | 114,303 |
| Equity | Total Equity | (4.7%) | 1,264,514 | 1,327,558 |
3.1.2) Condensed Statement of Financial Operations
| (For the period ending March 31) | Percentage Variance | 2011 | 2010 | |
|---|---|---|---|---|
| Net Cost of Operations | 7.1% | 437,081 | 408,070 | |
| Expenses | Total Expenses | 7.5% | 442,326 | 411,350 |
| Revenues | Total Revenues | 59.9% | 5,245 | 3,280 |
3.2 Financial Highlights Graph
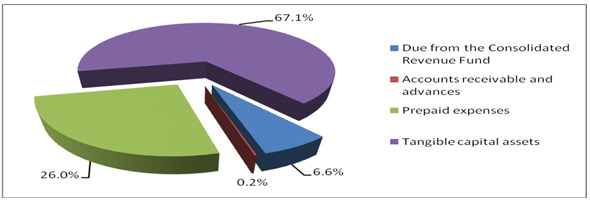
Assets by Type

Total assets were $1.401 million at the end of 2010-2011, a decrease of $40.6 million (2.8%) over the previous year’s total assets of $1.442 million. Tangible Capital Assets comprised 67.1% of total assets at $940.7 million. Prepaid Expenses represented $364.9 million (26.0%) and amount due from the Consolidated Revenue Fund represented $92.9 million (6.6%) of total assets.
3.3 Financial Statements
Information on CSA's Financial Statements is at the following address:
www.asc-csa.gc.ca/eng/publications/default.asp#parliament
3.4 List of Supplementary Information Tables
Electronic supplementary information tables listed in the 2010-2011 Departmental Performance Report can be found on the Treasury Board of Canada Secretariat’s website at: http://www.tbs-sct.gc.ca/dpr-rmr/st-ts-eng.asp.
- Sources of Non-Respendable Revenue
- User Fees Reporting
- Status Report on Projects Operating with Specific Treasury Board Approval
- Status Report on Major Crown and Transformational Projects
- Details on Transfer Payment Programs (TPPs)
- Response to Parliamentary Committees and External Audits
- Internal Audits and Evaluations
hr
Section 4: Other Items of Interest
4.1) Spending by Program Activity
| Description | Planned Spending ($ in millions) |
Actual ($ in millions) |
Variance ($ in millions) |
|---|---|---|---|
| Space Based Earth Observation | 88.7 | 96.4 | (7.7) |
|
Comments: The variance of $(7.7) million was mainly due to the following factors:
|
|||
| Description | Planned Spending ($ in millions) |
Actual ($ in millions) |
Variance ($ in millions) |
|---|---|---|---|
| Space Science and Exploration | 185.4 | 156.8 | 28.6 |
|
Comments: The variance of $28.6 million was mainly due to the following factors:
|
|||
| Description | Planned Spending ($ in millions) |
Actual ($ in millions) |
Variance ($ in millions) |
|---|---|---|---|
| Satellite Communications | 19.7 | 16.6 | 3.1 |
|
Comments: The variance of $3.1 million was mainly due to the following factor:
|
|||
| Description | Planned Spending ($ in millions) |
Actual ($ in millions) |
Variance ($ in millions) |
|---|---|---|---|
| Generic Technological Activities in support of EO, SE and SC | 46.2 | 45.0 | 1.2 |
|
Comments: The variance of $1.2 million was mainly due to the following factors:
|
|||
| Description | Planned Spending ($ in millions) |
Actual ($ in millions) |
Variance ($ in millions) |
|---|---|---|---|
| Space Awareness and Learning | 8.1 | 7.3 | 0.8 |
|
Comments: No significant variance between Planned Spending and Actual. |
|||
| Description | Planned Spending ($ in millions) |
Actual ($ in millions) |
Variance ($ in millions) |
|---|---|---|---|
| Internal Services | 42.8 | 50.6 | (7.8) |
|
Comments: The variance of $(7.8) million was mainly due to the following factors:
|
|||
4.2) FTEs Variance (Full-time Equivalent)
In 2010-2011, the difference of 28 between planned and actual FTEs is mainly due to delays in staffing activities. However, this shows a significant improvement from the previous year which had ended with a difference of 49 FTEs. This improvement is a result of a better planning of FTE requirements and the implementation of a corporate staffing action plan.
4.3) List of Space Missions
A description of missions can be found in the electronic document called: "Analysis of Program Activities by Strategic Outcome – Detailed Performance Information" at the following address:www.asc-csa.gc.ca/eng/publications/default.asp#parliament
4.4) Organizational Contact Information
Canadian Space Agency
Communications and Public Affairs
Telephone: 450-926-4370
Fax: 450-926-4352
E-mail: media@asc-csa.gc.ca
