ARCHIVED - Canadian Space Agency - Report
 This page has been archived.
Archived Content
Information identified as archived on the Web is for reference, research or recordkeeping purposes. It has not been altered or updated after the date of archiving. Web pages that are archived on the Web are not subject to the Government of Canada Web Standards. As per the Communications Policy of the Government of Canada, you can request alternate formats on the "Contact Us" page.
2010-11
Departmental Performance Report
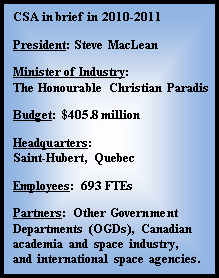
Canadian Space Agency
The original version was signed by
The Honourable Christian Paradis
Minister of Industry
Table of Contents
Minister's Message

Last year, the Industry Portfolio played a key role in advancing the government’s agenda in Year 2 of Canada’s Economic Action Plan.
Specific stimulus measures taken by the Industry Portfolio under Canada’s Economic Action Plan were aimed at boosting economic development, supporting small and medium-sized enterprises, improving Canada’s research and development capacity and strengthening communities. The Portfolio’s stimulus measures targeted communities through the Marquee Tourism Events Program and the Broadband Canada: Connecting Rural Canadians program. Further investments in the Industrial Research Assistance Program, the Industrial Research and Development Internship Program, the Canada Graduate Scholarships Program and the Knowledge Infrastructure Program expanded Canada’s research and development capacity. Investing in the Canadian space industry maintained Canadian expertise and leadership in space robotics. Through these and other stimulus initiatives, we helped create jobs, build communities and nurture the roots of economic recovery.
In 2010-2011, the Canadian Space Agency continued to support conditions for innovation and success in space science and technology in Canada. The Agency’s ongoing work developed space infrastructures in support of northern communities and allowed space data, information and services to be available to government, university researchers, scientists and policy-makers. Consultations were also completed with key stakeholders to implement a new strategic direction for the Agency.
Cultivating an environment for job creation, growth and competitiveness, both domestically and internationally, remains a priority for the Industry Portfolio. We will work to improve cost-effectiveness and efficiency and will contribute to the Government of Canada’s priority of balancing the budget and achieving real results for all Canadians.
It is my pleasure to present the Canadian Space Agency’s Departmental Performance Report for 2010-2011.
Christian Paradis
Minister of Industry and Minister of State (Agriculture)
President's Message
The Canadian Space Agency remains committed to delivering results for Canadians in support of government priorities, and this year set the conditions in place for success. Following extensive consultations with government, industry and academia, the Agency implemented a new strategic direction and the organizational and programmatic structure to deliver on its objectives.
Among its objectives, the Agency continues to support space science and technology, in order to contribute to our nation’s innovation and to improve the quality of life for Canadians. The critical images of Earth Observation satellites that support the operational needs of many government departments and agencies, especially in the Arctic region continue to be made available, this year marking an increase in the use of RADARSAT-2 data as more government departments use the information to deliver results for Canadians -in all $37 million worth of data.
In order to ensure Earth Observation images continue to be available to government and university researchers, scientists and policy-makers, CSA is pursuing the development of the RADARSAT Constellation, the follow-on mission to RADARSAT-2, beginning a detailed design phase for the first of the three small satellites.
As part of Canada’s Economic Plan, the CSA also pursued the development of leading-edge technology in space robotics, a niche area of expertise for Canada. Terrestrial prototypes of the next generation Canadarm and of three different rovers and their associated technologies are being readied for future international missions to the Moon and Mars. This work is fostering the kind of technological innovations that made Canada an international leader in robotics.
This year, the CSA also completed the upgrades to the ground infrastructure needed by northern communities to access the Anik F2 satellite, ensuring telecommunications will be available to Canadian northern communities, no matter how remote.
Moving forward, the Canadian Space Agency will continue to support the work needed to conduct the Government’s comprehensive review of programs, policies and funding related to the Canadian aerospace/space industry in order to develop a national policy framework.
It is my pleasure to present this year's Departmental Performance Report for the Canadian Space Agency.
Steve MacLean,
President
Section 1: Overview
1.1 Raison d'�tre and Responsibilities
The mandate of the Canadian Space Agency1 (CSA) is "to promote the peaceful use and development of space, to advance the knowledge of space through science and to ensure that space science and technology provide social and economic benefits for Canadians". The CSA is achieving this mandate in cooperation with other government departments and agencies, industries, and universities, as well as international partners. In addition to delivering its own programs, the CSA is responsible for coordinating all federal civil space-related policies and programs pertaining to science and technology research, industrial development, and international cooperation.
Although a new strategic direction is taking shape, the Canadian Space Strategy2 (CSS) approved by the Government of Canada in February 2005 continues to guide the Agency in the direction and management of its programs. The Strategy frames the decision-making and the alignment of all space-related program activities with CSA’s strategic outcome.
The release in 2007 of the Canadian Government's Science and Technology Strategy3 provided the CSA with a solid framework with which to prioritize CSA programs and initiatives to "make Canada a world leader in science and technology and a key source of entrepreneurial innovation and creativity".
More recently, in 2010, the Science and Technology (S&T) Integration Board4 released a Map of Outcomes and Activities of federally-performed and federally-led S&T. Accompanying the Map was a report written by the Policy Research Initiative entitled Improving the Measurement, Reporting and Assessment of Federally Performed Science and Technology. These documents exposed important challenges faced by all members of the Government S&T community related to the reporting on their results over short periods of time. This report will attempt to respond to the challenges.
1 To learn more about the mandate of the Canadian Space Agency, go to:
www.asc-csa.gc.ca/eng/about/mission.asp
2 To learn more about the Canadian Space Strategy, go to:
www.asc-csa.gc.ca/pdf/strategy.pdf
3 To learn more about Canadian Government’s Science and Technology Strategy, go to:
www.ic.gc.ca/epic/site/ic1.nsf/en/h_00231e.html
4 To learn more about the Science and Technology (S&T) Integration Board, go to:
www.science.gc.ca/default.asp
1.2 Strategic Outcome and Program Activity Architecture
The chart below presents CSA’s Program Activity Architecture (PAA) in effect in 2010-2011. This is the last Departmental Performance Report based on this Program Activity Architecture.
As a result of nearly two years of consultation with senior executives of other government departments, academia and industry stakeholders and heads of space agencies, the CSA revised its strategic direction and realigned its Program Activity Architecture and adjusted its Performance Measurement Framework presented in the Report on Plans and Priorities 2011-2012. To learn more about the new Program Activity Architecture, go to: www.asc-csa.gc.ca/eng/publications/rpp-2011.asp#s1.2
All Program Activities contribute to a single Strategic Outcome: "Canada’s presence in space meets the needs of Canadians for scientific knowledge, space technology, and information."
Description of Program Activities5
Space Based Earth Observation (EO): To develop and operationalize the use of Space Based Earth Observation for the benefit of Canadians, especially in the fields of environment, resource and land use management, as well as security and foreign policy. In doing so, the CSA maintains and expands Canada's leadership in EO technologies to obtain the timely, relevant and essential information we need to make judicious decisions about our collective future.
Space Science and Exploration (SE): To better understand the solar system and the universe; expand our knowledge on the constituent elements and origins of life; and strengthen a human presence in space. In doing so, the CSA sustains and increases Canada's contribution to humankind's scientific knowledge, to the exploration of our solar system and the universe and to the development of related technologies.
Satellite Communications (SC): To provide all Canadians with the means to participate and fully benefit from the global information age. In doing so, the CSA upholds Canada's status as a world leader in Satellite Communications and extends the most advanced products and services to all Canadians.
Generic Technological Activities (GTA): To provide leadership, coordination or support to Earth Observation, Space Science and Exploration, and Satellite Communications through activities that are generic in their nature since they contribute to all three program activities.
Space Awareness and Learning (AL): To further public understanding and engagement with regards to space related issues, ultimately improving the scientific literacy of Canadians by carrying out a national awareness and learning initiative in support of the CSA programs.
Internal Services: To implement the government's commitment to modern public service management in accordance with the Management Accountability Framework's (MAFs) expectations.
CSA Organizational Structure and Governance
The CSA underwent its first full year reporting to the Minister of Industry and Minister of State (Agriculture) with its new structure; the President was assisted by eight executives: the Vice-President, four Directors General (Space Utilization, Space Exploration, Space Science and Technology, Corporate Services), the Chief Financial Officer, the Chief Human Resources Officer, and the Director of Communications and Public Affairs. The Executive Committee is the only decision-making body upon which strategic orientations, program priorities, major investments as well as the selection of projects and their continuation are approved. However, at the strategic level, Government stakeholders are regularly consulted, particularly at the Deputy Minister and Associate Deputy Minister levels, to determine the governmental needs and priorities, as well as with leaders of academia, Canadian industry and with our international partners in order to assist the CSA in determining the optimal program portfolio.
5 Description of Program Activities are taken from the Main Estimates available on line:
www.tbs-sct.gc.ca/est-pre/20102011/me-bpd/IC-CI-eng.asp#bm02
1.3 CSA's Organizational Priorities
Space is important for Canada given its large land mass and extensive remote territories, low population density, long coast lines and resource-based economy. Space has become a critical infrastructure that underpins Canada’s economy and affects the life of every Canadian – a day without space (e.g., weather predictions, communications and territorial mapping) would be a difficult day indeed. Space exploration is one of the instruments of innovation essential in ensuring the prosperity of our country.
The national needs and priorities related to sovereignty, defence, the North, science and technology innovation leveraging, space exploration and building space capacity became incrementally the new focus of the CSA in 2010-2011.
| Program Activity ($ in millions) |
2009-2010 Actual Spending | 2010-2011 | Alignment to Government of Canada Outcomes | |||
|---|---|---|---|---|---|---|
| Main Estimates | Planned Spending | Total Authorities | Actual Spending | |||
| TOTAL | 344.6 | 390.8 | 394.9 | 405.8 | 372.8 | |
| Space Based Earth Observation (EO) | 75.5 | 88.7 | 92.8 | 93.2 | 96.4 | Well-managed and efficient government operations |
| Space Science and Exploration (SE) | 153.6 | 185.4 | 185.4 | 189.4 | 156.8 | An innovative and knowledge-based economy |
| Satellite Communications (SC) | 19.7 | 19.7 | 19.7 | 21.7 | 16.6 | Well-managed and efficient government operations |
| Generic Technological Activities in support of EO, SE, and SC | 43.0 | 46.2 | 46.2 | 48.6 | 45.0 | An innovative and knowledge-based economy |
| Space Awareness and Learning (AL) | 5.9 | 8.1 | 8.1 | 8.1 | 7.3 | An innovative and knowledge-based economy |
| Sub-Total | 297.7 | 348.0 | 352.1 | 361.0 | 322.2 | |
| Internal Services | 46.9 | 42.8 | 42.8 | 44.8 | 50.6 | |
Notes:
1. Totals may not add due to rounding.
2. Variance of $4.1 million between TOTAL $390.8 million for Main Estimates and TOTAL $394.9 million for Planned Spending is caused by the planned reinvestment of royalties from the sale of RADARSAT-1data under the Space Based Earth Observation Program Activity.
Any significant variance reported against Planned Spending set out in the 2010-2011 Report on Plans and Priorities is explained in Section 4.1 – Spending by Program Activity.
An increasing number of countries are now involved in the peaceful development and use of space. There were almost 200 satellites launched over the past three years for civilian and/or commercial purposes among which six were Canadians. Current estimates indicate that potentially 300 new satellites may be launched by the end of the decade. While two-thirds of these satellite projects serve government programs in Earth Observation and Space Science and Exploration, the rest of the commercial investments will be supporting Satellite Communications.
Since Canada reached a crossroad a few years ago where major projects initiated in the 90’s were delivered, and opportunities to collaborate with national and international partners in major space missions have been reassessed. The year 2010-2011 was marked by: the continued increase in the use of RADARSAT-2 Earth Observation satellite data by governmental organizations; the furthering development of the RADARSAT Constellation Project; the continued scientific successes relating to the operational SCISAT and MOST Canadian satellites as well as Canada’s contribution to the James Webb Space Telescope; the nearing completion of lunar exploration rover prototypes and next generation space robotics; the optimised use of laboratories aboard the International Space Station (ISS); and, the renewal of Canada’s Agreement with the European Space Agency (ESA). These and other accomplishments, combined with sustained contribution by Canadian astronauts and highly qualified personnel to international space exploration missions, have continued to brand Canada as a science and technology focused and reliable partner.
At the request of the Government, the CSA reviewed its strategic direction and proposed ways to achieve the Government’s strategic and public policy interests with recommendations on Canada's role and participation in future international space activities. This was done in consultations with fourteen government departments in collaboration with senior representatives from over forty Canadian firms involved in the space business, twenty major Canadian universities and a host of space agencies around the world. The following pillars highlight the way the CSA began in 2010-2011 to gradually align its programs and priorities with its new strategic direction:
-
Through the development and operations of space assets, the CSA contributes to addressing national needs and priorities related to sovereignty, defense, the North, resources, and science and technology.
-
Through partnering in international space exploration initiatives and science and technology developments in space, the CSA contributes to advances in knowledge, technologies and expertise to sustain Canada's economic and social development.
-
Through leveraging the innovation capacity of industry, academia and governments, the CSA contributes to sustaining at critical mass of academic, industrial and business expertise needed to address Canada's future needs and priorities in space.
1.4 Risk Analysis
Strategic Context of the Canadian Space Agency
International Context
Space is recognized by industrialized nations as a critical and strategic tool to meet their social, economic and foreign policy objectives. Accordingly, many governments around the world of both traditional and emerging space faring nations are increasing their investments in space activities, seeking increased consolidation and the advancement of their space capabilities.
International cooperation is crucial to the implementation of the Canadian Space Strategy. Canada is working in partnership with other space faring nations, particularly through its longstanding relations with the National Aeronautics and Space Administration (NASA) and the European Space Agency (ESA). Through these partnerships, Canada can leverage its resources and maximize its return on investment, while sharing technical expertise, knowledge, and infrastructure, and gaining access to areas where Canada has chosen not to invest. In addition, there are increasing concerns over issues such as space weather, space debris and climate change that transcend national borders and promote increased cooperation among nations with common goals. Canada’s space infrastructure must meet national strategic needs while playing a tangible role in responding to issues of interest to the international community.
Canada is regarded as a reliable partner that possesses unique technical and scientific capabilities, and as a nation that can meaningfully contribute to the initiatives of foreign space agencies. In particular, emerging space-faring countries in Asia and South America may offer great potential for future cooperation. Thus, Canada continues to deploy its efforts to gain a foothold in these emerging markets. It is of paramount importance that the Canadian Space Agency continues to work with its stakeholders to ensure the competitiveness of our research and business communities in world markets. Canada’s space industry is perceived as internationally competitive. This was confirmed by the results of the 2009 Annual Survey of the Canadian Space Sector. The sector has yearly revenues of $3.025 billion, $1.491 billion of which are derived from exports, representing 49% of the industry’s total revenues6. The main destinations of Canadian exports are:
- The United States remains the largest market accounting for 52.4% (or, $782 million) of the $1.491 billion of total exports.
- Europe is a strong second, accounting for 27.4% (or, $408 million).
- Export revenues from Oceania increased by 8.6% - from $51.2 to $55.6 million.
- Export revenues from South America increased by 22.9% - from $52.1 to $64 million.
- Export revenues from Africa decreased by 28.2% - from $10.8 to $7.8 million.
6 CSA: State of the Canadian Space Sector 2009; Overall Revenues, Domestic v. Export Revenues.
National Context
The Canadian Space Agency recognizes that the best means of turning scientific and technological advancements into innovative products and services is through partnerships with Canadian universities and businesses. With its highly skilled workforce, our space industry not only generates wealth in our economy, but also provides competitive products and services. Given that the national market is relatively small, it is critical that the Canadian space industry be able to leverage foreign investments and generate export sales. Capitalizing on export revenue depends on the industry’s ability to commercialize highly competitive products and services, and establish local and international partnerships.
In 2009, the Satellite Communications sector continued to generate almost 77% of Canada’s $3.025 billion in space sector revenues. Moreover, the sector saw a revenue increase of 8.4% (from $2.146 billion to $2.326 billion) during that year. A breakdown of the total $3.025 billion in revenues by sectors of activity reads as follows:7
- Satellite Communications: 76.9% ($2.326 billion);
- Navigation: 8% ($243 million);
- Earth Observation: 8.5% ($258 million);
- Robotics: 3.8% ($114 million);
- Space Science: 2% ($61 million); and,
- Space-related activities in other areas: 0.8% ($24 million).
While small in terms of the number of firms, the Canadian space sector is knowledge-intensive and is at the forefront of research and innovation. Building on the strengths of 7,564 skilled workers, including 3,770 highly qualified personnel, the firms in this sector have acquired world-leading capabilities in niche areas such as Earth observation, space robotics, scientific instruments, telecommunications and navigation satellites.
To learn more about organizations involved in Canada’s space industry, go to:
www5.asc-csa.gc.ca/eng/industry/csd.asp
Regional Development
To encourage sustainable industrial regional development and to maximize benefits to all Canadians, the CSA uses the following regional distribution objectives as guidelines for its investments in space:
- British Columbia: 10% of investment in space
- Prairies: 10%
- Ontario: 35%
- Quebec: 35%
- Atlantic Canada: 10%
The data presented in the graph shown below accounts for the regional distribution of all Government space-related funding for the period from April 1988 to March 2011.
7 CSA: State of the Canadian Space Sector 2009.
Source: CSA Organized Research Information System (ORIS), March 31, 2011.
To learn more about organizations involved in Canada’s space industry, go to:
www5.asc-csa.gc.ca/eng/industry/csd.asp
Government Context
1 - The Canadian Government’s Science and Technology Strategy
The objective of the Canadian Government’s Science and Technology (S&T) Strategy is to "make Canada a world leader in science and technology and a key source of entrepreneurial innovation and creativity". In order for Canada to achieve this objective, the S&T Strategy identifies the following three underlining conditions for success: a strong private-sector commitment to S&T, a strengthened knowledge base and, be a magnet for talent. Further to the 2008-2009 Strategic Program Review, the CSA has realigned its programs with the Science and Technology Strategy in order to support the key priorities of the Government.
To learn more about the Canadian Government’s Science and Technology Strategy, go to: www.ic.gc.ca/epic/site/ic1.nsf/en/h_00231e.html
2 - The Canadian Space Strategy
Approved by the Government of Canada in February 2005, the Canadian Space Strategy was developed in full consultation with Government of Canada organizations and Canadian stakeholders. The new strategic direction builds and reinforces this Strategy and serves as the framework that guides all CSA programs and provides our stakeholders and partners with insight on Canada’s space vision. While the Canadian Space Strategy preceded the S&T Strategy, it embraces the well-founded principles of world-class excellence and innovative national partnerships.
To learn more about the Canadian Space Strategy, go to:
www.asc-csa.gc.ca/eng/publications/default.asp#strategy
3 - Corporate Integrated Planning
Several initiatives were started to bring the CSA closer to an integrated management of its program activities. These initiatives are meant to provide added value to planning, decision-making and accountability processes:
-
The development of the CSA’s performance measurement capacity under the new Program Activity Architecture for the 2011-2012 Departmental Performance Report.
-
The development of an integrated planning approach in order to align human, financial and technical resources with the management of program activities for fiscal year 2011-2012.
-
The development of a five-year Evaluation Plan starting in 2011-2012 as directed by TBS Policy on Evaluation.
4- Corporate Risk Management
The CSA completed a review of its 2010-2011 corporate risk profile and will direct increased attention to two areas that are considered a corporate priority for 2011-2012.
-
The CSA’s capacity to align its strategies, planning, priorities, funding levels, operations and capacity to deliver, and obtain clear understanding and buy-in from managers and staff at all levels.
The following mitigation actions were pursued in 2010-2011:
-
The CSA has begun the review of its current governance regime in order to strengthen oversight and consultation that will support its strategic planning and alignment of current and future program in the interests of its key stakeholders. A strengthened internal and external governance structure with integrated process will assure better compliance with Treasury Board policies.
-
In response to external and internal audits, the CSA has begun the review of its management of corporate risks, which entails the development of an Integrated Risk Management Policy and Procedures as well as a new Corporate Risk Profile. The policies and procedures will be completed in the fall of 2011 for implementation during fiscal year 2012-2013.
The following mitigation actions will be initiated in 2011-2012:
- Establish an Acquisitions Strategy and develop a multi-year Acquisition Plan;
- Develop and approve a CSA Policy on project costs allocation;
- Establish a Cost Estimating and Review Team; and,
- Reorganize Configuration Management and Information Management.
-
-
The CSA’s capacity to hire and maintain a qualified workforce required to deliver its mandate within the government legislative frameworks, policies and rules.
The following mitigation actions were completed in 2010-2011:
-
The 2010-2013 Integrated Corporate Human Resources Plan was developed in line with the Program Activity Architecture which addresses government priorities and CSA specific issues.
-
The Human Resources Directorate reviewed its business processes and organizational structure in order to meet current and future human resources management needs. The CSA is engaged in the implementation of an integrated human resources management process.
-
Several initiatives were started under the 2010-2013 Integrated Corporate Human Resources Plan to foster career advancement, including learning and continuous development programs for specific scientific, technical and professional functions (ENG, EG, EL, CS, PE) and a new competitive entry level program for engineers and integration and test technologists in order to ensure succession planning in these key skill sets.
-
A corporate strategy developed in consultation with employees was approved to address issues raised in the 2008 National Public Service Survey. A subsequent action plan developed in consultation with CSA employees will be implemented in 2011-2012.
The following mitigation actions will be pursued in 2011-2012:
- Implement the CSA Values and Ethics Action Plan which includes the release of CSA Organizational Code of Conduct, mandatory training initiatives and the promotion of an on-going dialogue among employees.
- Review the Staffing Management Accountability Framework and its monitoring process.
- Implement the 2010-2013 Human Resources Integrated Plan and annually monitor the progress achieved.
- Implement a corporate action plan addressing the issues arising from the 2008 Public Service Commission Survey.
-
1.5 Summary of Performance
1.5.1) Strategic Outcome Performance Status
|
Canadian Space Agency Strategic Outcome
Canada’s presence in space meets the needs of Canadians for scientific knowledge, space technology and information. |
|
|---|---|
| Performance Indicators | 2010-2011 Performance |
1. Canada’s rank in terms of support for peaceful space-related R&D; the measurement will provide the list of CSA missions, looking 10 years into the future and identifying the following for each mission:
|
In 2010, Canada maintained its 7th position ranking among 28 space-faring OECD nations in terms of government investments in civil space programs. The ranking of the first seven nations remained the same as last year while the ranking of nations bolded below was either changed or added in 2010: USA, Japan, France, Germany, Italy, UK, Canada, Spain, Belgium, Korea, Netherlands, Switzerland, Sweden, Norway, Austria, Turkey, Australia, Finland, Denmark, Portugal, Greece, Ireland, Czech Republic, Luxembourg, Chile, Israel, Poland and Hungary. This list does not include non-OECD members who are major space-faring nations such as Russia, India, China and Brazil. |
|
Indicator 1 – Performance Analysis
Canada's ranking among space-faring OECD nations is only a partial indicator. Additional information such as the full spectrum of the level of support for each mission, an assessment of their level or diversity, as well as the alignment with the Government of Canada and departmental priorities may enhance understanding of how the ranking was achieved. Because the development of new indicators was introduced in 2010-2011 for CSA’s next Performance Measurement Framework, the qualitative analysis of projected outlook into the future has not been pursued. Source: IMF Databank and Euroconsult World Space Markets 2011. |
|
2. State of the scientific, industrial and public sector communities involved in the space sector:
|
In 2009, Canada had a space workforce of 7,564 people and 215 organizations. |
|
Indicator 2 – Performance Analysis
The state of the Canadian Space sector, is based on a confidential survey conducted by the CSA and completed on a voluntarily basis by representatives of Canada space sector. For the time being, this survey is the only source providing a pulse of the Canadian space community. The results gathered by this survey are key to the analysis of the CSA’s strategic outcome. The 2009 survey reported a space workforce of 7,564 people (3,770 of which are highly qualified personnel) distributed among 215 organizations (130 companies, 35 universities, 28 federal departments and agencies and 22 other organizations such as not-for-profit associations and research centers). In 2008, the size of the space workforce reported was slightly lower, 6,742, distributed among the same number (215) of organizations. Source: State of the Canadian Space Sector for 2009, (2010). |
|
| 3. Access and utilization by the Canadian government and industry of space data generated by Canadian space missions. | This year, a total of 17 Other Governmental Departments (OGDs) have acquired data from Earth observation and Earth systems satellites supported by the CSA. |
|
Indicator 3 – Performance Analysis
The number "17 OGDs" represents an increase of two new OGDs (Health Canada and National Research Council) compared to last year. This indicator reveals that the majority of the main OGD users tend to acquire data from more than one of the satellites. The CSA supported 3 Earth observation satellites: ESA-ENVISAT, RADARSAT-1 and RADARSAT-2. In the case of RADARSAT-2 more specifically, the data consumption pattern is similar to that of last year; 75% of the data acquisition was made by the same 4 main OGDs namely: Environment Canada (39%), National Defense and Canadian Forces (22%), Natural Resources Canada (16%), Fisheries and Oceans (8%). CSA supported several Earth system satellites. Here are some examples of data usage: Environment Canada uses data from MOPITT, OSIRIS, SCISAT-1 and CloudSat; Environment Canada, Fisheries and Oceans Canada and Agriculture and Agri-Food Canada use data from SMOS; Natural Resources Canada and Environment Canada use data from CryoSat-2; and the Canadian Spatial Reference System (Natural Resources Canada) uses data from GOCE. Source: Internal reporting documents. |
|
| Planned Spending | Total Authorities | Actual Spending |
|---|---|---|
| 394.9 | 405.8 | 372.8 |
Note: Variance of $4.1 million between TOTAL $390.8 million for Main Estimates and TOTAL $394.9 million for Planned Spending is caused by the planned reinvestment of royalties from the sale of RADARSAT-1 data under the Space Based Earth Observation Program Activity.
Any significant variance reported against Planned Spending set out in the 2010-2011 Report on Plans and Priorities is explained in Section 4.1 – Spending by Program Activity.
| Planned | Actual | Difference |
|---|---|---|
| 721.4 | 693.2 | 28.2 |
Any significant variance reported against Planned FTEs set out in the 2010-2011 Report on Plans and Priorities is explained in Section 4.2 – FTEs Variance.
1.5.2) Performance Status by Program Activity
The CSA faces the considerable challenge of having to assess the benefits expected by Canadians from its science and technology investments. Since the CSA works jointly with other government departments, Canadian academia and space industry, the performance measurement of space knowledge and technology development requires the participation of all partners. The fact that space programs, missions and projects frequently take years to develop and operationalize, the links between inputs, activities, outputs and the impact of any science and technology program are difficult to establish because the occurrence of spin-offs becomes observable and measurable only over a long period. Progress made towards the strategic and program activity outcomes can be monitored through short, medium- and long-term advancements instead of specific targets.
This challenge is shared by the whole Science and Technology community in the context of result based accountability reporting. In order to improve its approach, the CSA intends to actively participate in the effort deployed by departments and agencies under the Federal Science and Technology Integration Board. Participation in such initiative can contribute to a better alignment between the measurement, reporting and evaluation of federal-sponsored S&T activities and, therefore, convey the generated outcomes to Canadians more appropriately.
Results reported in the following pages use the Treasury Board Secretariat guidelines for the assessment of the level of performance achieved for priorities and expected results.
Exceeded: More than 100% of the expected level of performance (as evidenced by the indicator and target or planned activities and outputs) for the expected result or priority identified in the corresponding Report on Plans and Priorities (RPP) was achieved during the fiscal year.
Met all: 100% of the expected level of performance (as evidenced by the indicator and target or planned activities and expected outputs) for the expected result or priority identified in the corresponding RPP was achieved during the fiscal year.
Mostly met: 80 to 99%of the expected level of performance (as evidenced by the indicator and target or planned activities and expected outputs) for the expected result or priority identified in the corresponding RPP was achieved during the fiscal year.
Somewhat met: 60 to 79% of the expected level of performance (as evidenced by the indicator and target or planned activities and outputs) for the expected result or priority identified in the corresponding RPP was achieved during the fiscal year.
Not met: Less than 60% of the expected level of performance (as evidenced by the indicator and target or planned activities and outputs) for the expected result or priority identified in the corresponding RPP was achieved during the fiscal year.
| Program Activity – Space Based Earth Observation (EO) | ||
|---|---|---|
|
Operational Priority
Develop and operationalize the use of Space Based EO for the benefit of Canadians. |
Type
Ongoing |
Statut
Mostly met |
| Target Achievements (Program Sub-Sub-Activities) |
Achieved Vs Planned Targets | |||||
|---|---|---|---|---|---|---|
| 2008-2009 | 2009-2010 | 2010-2011 | ||||
| 13/15 | 87% | 14/15 | 93% | 14/15 | 93% | |
| Tendency (Starting base value = 82%) |
 |
|
|
|||
|
Tendency is established by comparison with the starting base value of 82% set in 2005-2006. In 2010-2011, as for the previous year, 14 of the 15 indicators were met. One of the RADARSAT Constellation project milestones had to be postponed to fiscal year 2011-2012 because of technical issues related to intellectual property. |
||||||
|
A total of $218.2 million was spent over the past 3 year period. Last year, the comparable amount totalled $175.1 million. |
||||||
Benefits for Canadians
Earth Observation (EO) enables monitoring of the environment with unparalleled coverage and scope, enhancing our forecasting capabilities and our understanding of environmental systems and climate change.
EO data are used for sustainable management and development of natural resources, land use, fisheries and agriculture and providing support for disaster management.
EO missions are critical to security and sovereignty, offering cost-effective, wide-area surveillance of environments that are difficult to access such as the Northwest Passage.
Government departments benefiting from EO data are Environment Canada, including the Canadian Ice Service, the Department of National Defence, Natural Resources Canada, Fisheries and Oceans Canada, and the governments of Provinces and Territories.
Main Accomplishments Over the Last 3 Years (2008-2009 to 2010-2011)
-
A total of 12 missions were either considered or undertaken generating 94 partnerships with the industry, universities or other Canadian government organizations.
-
79 applications emerged from EO technology development programs of which 76% (60/79) became operational.
-
In 2010, RADARSAT-1 began its 16th year of operation, RADARSAT-2 its third, and SCISAT-1 its 7th year of operation.
-
Canada’s partnership with the European Space Agency for this Program Activity provided an average "Industrial return coefficient" of 1.13 compared to an expected return of 0.84.
For more detailed 2010-2011 performance information, go to: Section 2 - Analysis of Program Activities by Strategic Outcome
| Program Activity – Space Science and Exploration (SE) | ||
|---|---|---|
|
Operational Priority
Understand the solar system and the universe, expand our knowledge of the constituent elements and origins of life, and strengthen the human presence in space. |
Type
Ongoing |
Statut
Mostly met |
| Target Achievements (Program Sub-Sub-Activities) |
Achieved Vs Planned Targets | |||||
|---|---|---|---|---|---|---|
| 2008-2009 | 2009-2010 | 2010-2011 | ||||
| 22/23 | 96% | 18/20 | 90% | 17/19 | 89% | |
| Tendency (Starting base value = 83%) |
|
|
|
|||
|
Tendency is established by comparison with the starting base value of 83% set in 2005-2006. Note the continued effort to rationalize the total number of indicators for program sub-sub-activities. In 2010-2011, 17 of the 19 indicators were met with only 2 being partially met; one because the project did not reach the expected operational level and the other, due to a lower return on investment as a result of delays incurred in missions for the Space Exploration segment of the ESA Program. |
||||||
|
A total of $456.9 million was spent over the past 3 year period. Last year, the comparable amount totalled $424.2 million. |
||||||
Benefits for Canadians
The CSA sustains and increases Canada's contribution to humankind's scientific knowledge and to the development of space related technologies. Research in physical and life sciences and in space exploration has great potential to bring about socio-economic benefits in the fields of advanced robotics, improved health care, nanotechnologies and industrial competitiveness.
Space Science and Exploration endeavours to position Canada to play an influential role in building strong and mutually beneficial partnerships with an increasing number of space faring countries. In striving to become one of the most advanced, connected and innovative nation in the world, space science and exploration stimulates some of the brightest minds to contribute to the Canadian economy in an increasingly competitive international environment.
Main Accomplishments Over the Last 3 Years (2008-2009 to 2010-2011)
-
A total of 38 missions were either considered or undertaken generating 376 partnerships with industry, universities or other Canadian government organizations.
-
Canadian astronauts participated in 2 missions.
-
A total of 1,479 scientific publications/reports/conference proceedings acknowledging CSA's contribution and 1,585 presentations were delivered.
-
The CSA met year after year 100% of its requirements to the International Space Station program: the largest international scientific and engineering project ever undertaken.
-
Canada’s partnership with the European Space Agency for this Program Activity provided an average "Industrial return coefficient" of 0.94 compared to an expected return of 0.84.
For more detailed 2010-2011 performance information, go to: Section 2 - Analysis of Program Activities by Strategic Outcome
| Program Activity – Satellite Communications (SC) | ||
|---|---|---|
|
Operational Priority
Provide all Canadians with the means to participate in and fully benefit from the global information age. |
Type
Ongoing |
Statut
Met all |
| Target Achievements (Program Sub-Sub-Activities) |
Achieved Vs Planned Targets | |||||
|---|---|---|---|---|---|---|
| 2008-2009 | 2009-2010 | 2010-2011 | ||||
| 4/6 | 67% | 3/6 | 50% | 6/6 | 100% | |
| Tendency (Starting base value = 69%) |
 |
|
|
|||
|
Tendency is established by comparison with the starting base value of 69% set in 2005-2006. In 2010-2011, all indicators were met for the first time in five years and demonstrate steady progress from previous years. |
||||||
|
A total of $59.9 million was spent over the past 3 year period. Last year, the comparable amount totalled $67.3 million. |
||||||
Benefits for Canadians
Satellite Communications facilitates the linking of all Canadians by increasing the delivery of non-commercial services to Canadian remote communities, and support federal Government departments' program delivery.
Space infrastructure allows access and dissemination of timely health, cultural, security and safety related information to all Canadians wherever they live in Canada. Satellite communications are essential to providing Canadians living in remote areas with timely access to expert knowledge and expertise related to health and education through a range of non-commercial services including: e-government, e-learning, tele-justice, tele-education, as well as tele-medicine.
Main Accomplishments Over the Last 3 Years (2008-2009 to 2010-2011)
-
10 technology demonstration projects were put forward.
-
2 joint studies involving the Other Governmental Departments (OGDs), namely, Transport Canada, National Defence, Environment Canada, and Indian and Northern Affairs were brought forward for consideration.
-
Canada’s partnership with the European Space Agency for this Program Activity provided an average "Industrial return coefficient" of 1.05 compared to an expected return of at least 0.84.
For more detailed 2010-2011 performance information, go to: Section 2 - Analysis of Program Activities by Strategic Outcome
| Program Activity – Generic Technological Activities (GTA) in support of EO, SE and SC | ||
|---|---|---|
|
Operational Priority
Provide leadership, coordination or support to Earth Observation, Space Science and Exploration, and Satellite Communications through generic technology research and space-qualification activities. |
Type
Ongoing |
Statut
Somewhat met |
| Target Achievements (Program Sub-Sub-Activities) |
Achieved Vs Planned Targets | |||||
|---|---|---|---|---|---|---|
| 2008-2009 | 2009-2010 | 2010-2011 | ||||
| 4/7 | 57% | 5/6 | 83% | 3/5 | 60% | |
| Tendency (Starting base value = 86%) |
|
|
|
|||
|
Tendency is established by comparison with the starting base value of 86% set in 2006-2007. In 2010-2011, two of the 5 indicators did not meet their respective target; one of the missed targets was related to the number of Highly Qualified Personnel (HQP) supported which was partially met and the other was a result of a change in a mission project planned by the Spanish Government, therefore outside of CSA’s ability to control. |
||||||
|
A total of $129.2 million was spent over the past 3 year period. Last year, the comparable amount totalled $131.3 million. |
||||||
Benefits for Canadians
Through its investments in Research and Development and in the development of applications, and the resulting transfers of technology to the private and public sectors, the CSA’s programs and activities attract highly skilled labour that contributes to Canada’s knowledge-based economy; help enhance the Canadian space industry’s competitiveness by encouraging dynamic trade relationships with other nations; and increase Canada’s ability to compete in the global marketplace in the fields of Earth Observation, Space Science and Exploration, and Satellite Communications.
Main Accomplishments Over The Last 3 Years (2008-2009 to 2010-2011)
-
A total of 9 patents were issued.
-
The David Florida Laboratory supported an average of 6 CSA missions and 44 commercial projects over the last 3 years.
-
Canada’s partnership with the European Space Agency for this Program Activity provided an average "Industrial return coefficient" of 1.07 compared to an expected return of at least 0.94.
For more detailed 2010-2011 performance information, go to: Section 2 – Analysis of Program Activities by Strategic Outcome
| Program Activity – Space Awareness and Learning (AL) | ||
|---|---|---|
|
Operational Priority
Further public understanding and engagement with regards to space related issues, ultimately leading to improving the scientific literacy of Canadians. |
Type
Ongoing |
Statut
Met all |
| Target Achievements (Program Sub-Sub-Activities) |
Achieved Vs Planned Targets | |||||
|---|---|---|---|---|---|---|
| 2008-2009 | 2009-2010 | 2010-2011 | ||||
| 3/3 | 100% | 3/3 | 100% | 3/3 | 100% | |
| Tendency (Starting base value = 94%) |
|
|
|
|||
|
Tendency is established by comparison with the starting base value of 94% set in 2007-2008. In 2010-2011, all indicators were met for a third consecutive year indicating an ability to consistently meet expected outcomes. |
||||||
|
A total of $19.3 million was spent over the past 3 year period. Last year, the comparable amount totalled $16.5 million. |
||||||
Benefits for Canadians
The CSA fosters science and technology literacy as a mean to influence the career choices of young Canadians towards science and technology and offered opportunities to enhance the expertise of Canadian scientists, engineers and physicians in space science, space technology and space medicine.
Main Accomplishments Over the Last 3 Years (2008-2009 to 2010-2011)
-
Almost 4.2 million individuals have visited the CSA's website.
-
Canadian astronauts reached an estimated 360,000 individuals through 167 public events.
-
A total of 2,784 educators participated in professional development workshops and Canadian students were reached on more than 5.6 million occasions through the Space Learning Program.
-
A total of 25 graduate students, fellows and medical residents were supported through the Program in support of Research and Training in space science, space technology and space medicine.
For more detailed 2010-2011 performance information, go to: Section 2 – Analysis of Program Activities by Strategic Outcome
| Program Activity – Internal Services | ||
|---|---|---|
|
Management Priority
Implement the Government’s commitment to modernize Public Service management in accordance with the Management Accountability Framework. |
Type
Ongoing |
Statut
Not met |
| Target Achievements (Program Sub-Sub-Activities) |
Achieved Vs Planned Targets | |||||
|---|---|---|---|---|---|---|
| 2008-2009 | 2009-2010* | 2010-2011* | ||||
| 3/6 | 50% | 1/2 | 50% | 1/2 | 50% | |
| Tendency (Starting base value = 93%) |
|
N/A | N/A | |||
|
* Note: Performance was established at the program activity level only, therefore the trend analysis by sub-sub-activities is not available. |
||||||
|
A total of $19.3 million was spent over the past 3 year period. Last year, the comparable amount totalled $16.5 million. |
||||||
Benefits for Canadians
By implementing the Government's commitment to modernize Public Service management, the CSA has increased accountability and management performance by implementing a series of change initiatives which contribute to improving effectiveness and efficiency in the delivery or programs and services.
Main Accomplishments Over the Last 3 Years (2008-2009 to 2010-2011)
Further to the 2008-2009 Strategic Expenditure review and as a result of nearly two years of active consultation with senior executives of other government departments, academia and industry stakeholders and heads of space agencies, the CSA:
-
Revised its strategic direction and modified its Program Activity Architecture and Performance Measurement Framework. At the same time, the Agency has aligned its programs and reorganized its structure to more effectively deliver on government priorities and to attain its Strategic Outcome.
-
The CSA has developed and approved its 2010-2013 Integrated Corporate Human Resources Plan in line with the Program Activity Architecture.
For more detailed 2010-2011 performance information, go to: Section 2 – Analysis of Program Activities by Strategic Outcome
1.6 Expenditure Profile
The CSA's annual A-Base Budget of $300 million was established in 1999. The difference in the spending trend shown above is mainly attributable to the following factors:
-
The cumulative impact of the reprofiling of funds associated with the sound management of high-risk projects and programs (e.g., high technology risks, long-term development cycle, uncertainties with work schedules, implementation delays).
-
The incremental funds allocated in Budget 2005 for the RADARSAT Constellation project, which provide the CSA with additional $111 million over five years (2005-2006 to 2009-2010) to work with the Canadian space industry on the development of the next generation of advanced radar remote sensing satellites.
-
In Budget 2009, Canada's Economic Action Plan (CEAP) provided the CSA with an additional $110 million over three years for the development of prototypes of a lunar exploration rover, a Mars science rover, and next-generation space robotics systems and technologies for on-orbit servicing.
1.7 Estimates by Vote
For information on our organizational Votes and/or statutory expenditures, please see the 2010-2011 Public Accounts of Canada (Volume II). An electronic version of the Public Accounts is available at Public Works and Government Services Canada’s Web page, Public Accounts of Canada 2010:www.tpsgc-pwgsc.gc.ca/recgen/txt/72-eng.html.
Section 2: Analysis of Program Activities by Strategic Outcome
2.1 Program Activity Performance
All program activities contribute to a single strategic outcome: "Canada's presence in space meets the needs of Canadians for scientific knowledge, space technology and information".
2.1.1) Space Based Earth Observation (EO)
Program Activity Description: To develop and operationalize the use of Space Based Earth Observation for the benefit of Canadians, especially in the fields of environment, resource and land use management, as well as security and foreign policy. In doing so, the CSA maintains and expands Canada's leadership in EO technologies to obtain the timely, relevant and essential information we need to make judicious decisions about our collective future.
| Space Based Earth Observation 2010-2011 Program Activity Performance Measurement |
|
|---|---|
|
Expected Result The benefits of activities involved in Earth Observation from space serve Canadian users in the fields of environment, resources and land-use management, and security and sovereignty. |
|
|
Main Accomplishments in 2010-2011 RADARSAT-2 is fully operational since April 2008. The Canadian Government has a $445 million credit over the life of the satellite. There continues to be an increase in the use of data by a number Canadian government departments which used data valued at over $37 million in 2010-2011 compared to $34 million in 2009-2010. Canadian government departments and agencies ordered over 20,000 scenes in 2010-2011, an increase of over 13%. The CSA continued the planning and development of the first of three satellites for the RADARSAT Constellation, the follow-on mission to RADARSAT-2, to be launched in 2015 and 2016. A Preliminary Design, initiated in November 2008, was completed in March 2010 and the detailed design phase started in March 2010. The CSA ensured Canada's commitment, as an official member of the International Charter Space and Major Disasters. CSA continued to contribute critical EO images in support of relief, aid and humanitarian efforts undertaken in response to disasters in countries around the world. This year alone CSA has supported 46 Charter activations providing data world-wide for covering different disaster types such as floods, earthquakes, volcanoes, oil spills, landslides, and hurricanes. |
|
| Indicators | Performance Summary |
| 1. Proportion of active missions relative to the total number of missions supported by Canada in the EO priority areas. | 25 %; 9 active missions out of 36 supported missions. |
| 2. Number of applications developed as a result of CSA's participation in space missions and/or support to projects/activities in EO considered "operational" from program standards. | A total of 22 applications became operational in 2009-2010. |
| 3. Number of uses of EO data as a result of CSA's participation in space missions and/or support to projects/activities in EO. | A total of 32 new uses were reported. |
|
Indicator 1 – Performance Analysis For the purpose of Departmental Performance Reporting, the CSA presents a list of space missions to which it actually contributes or plans to contribute. Any mission must necessarily follow many critical steps depicted in a simple manner as such:
(Year) = Actual or projected launch date or date of completion when known. EO missions at the Operation stage (9): * = 0 CloudSat (2006), ESA-ENVISAT (2002), ESA-ERS-2 (2005), ESA-GOCE (2009), |
|
|
EO missions at the Development stage(13): * = 0 |
|
|
EO missions under review (14): * = 0 Missions' descriptions can be found in the electronic version of "Analysis of Program Activities by Strategic Outcome – Detailed Performance Information" at the following address: |
|
|
Indicator 2 – Performance Analysis A total of 22 applications became operational in 2010-2011 compared to 15 last year; 7 from the Earth Observation Application Development Program (EOADP) and 15 from Government Related Initiatives Program (GRIP) divided into monitoring applications (e.g. Environmental Monitoring, Ecological Integrity, Ice Movement Mapping; Water Quality Monitoring), detecting applications (e.g. Oil Slick and Ship Detection; Forest Monitoring; Energy and Biomass Monitoring), and measuring applications (e.g. Soil Moisture and Geological and Water Monitoring, Winds and Waves Extraction). An interesting trend has been observed; while only 23% (6/26) of the operational applications came from the GRIP in 2008-2009, this percentage rose to 68% (15/22) in 2010-2011. Source: Internal documents. |
|
|
Indicator 3 – Performance Analysis Eleven of the 32 uses (35%) reported had national purposes. Last year, a similar 47% of uses for national purposes was reported though more uses, 74, were reported. Here are a few examples: Natural Disaster On November 5, 2010, Hurricane Tomas hit Haiti, sweeping the country with strong winds and torrential rain. The hurricane caused widespread flooding in low-lying areas and damaged infrastructure and housing along the country’s western coast. Since a large number of people were still living in tents following the January 2010 earthquake Hurricane Tomas had a major socio-economic impact. RADARSAT-2 data from before and after the event were used to produce change detection maps. Flood-related products were developed and sent to Haiti in order to assist local emergency response activities in the wake of Hurricane Tomas. (Volume 47, Topic 10) Far North/Arctic ENVISAT observed a rare event in the Arctic in August 2010: a giant iceberg breaking off the Petermann Glacier in northwestern Greenland. The Petermann Glacier is one of the largest glaciers connecting the Greenland inland ice sheet with the Arctic Ocean. Upon reaching the sea, a number of these large outlet glaciers extend into the water with a floating “ice tongue.” The CSA created an animation by combining three ENVISAT acquisitions (July 31, August 4 and August 7, 2010) taken over the same area. The breaking of the glacier tongue and the movement of the iceberg can be clearly seen in this sequence. (Volume 45, Topic 4) Water/Fisheries In order to be able to observe the cleanup efforts following the giant oil spill in the Gulf of Mexico on April 22, 2010 after a drilling rig exploded and sank off the coasts of Louisiana and Mississippi, the US Geological Survey, on behalf of the US Coast Guard, requested satellite maps of the area captured by the ENVISAT Earth Observation satellite. With the help of Canadian technology, this optical image of the oil spill was captured by the Medium Resolution Imaging Spectrometer (MERIS) on April 25, 2010. (Volume 43, Topic 2) Forest/Mining/Agriculture Since the glacial retreat at the end of the last ice age, fire has helped form the ecosystems that we know today and maintain their diversity and balance. From a socio-economic perspective, however, fire can have negative effects on public health and safety, property and natural resources. Earth observation satellites can provide key data used in forest fire disaster response efforts, for example when smoke from forest fires in May 2010 reached the St Lawrence Valley and New England. In the case of relief operations such as this, it is important to be able to deliver data in near real-time so that damage can be monitored and the future impact can be assessed. (Volume 44, Topic 2) Source: CSA's EO Express publication: www.asc-csa.gc.ca/eng/newsletters |
|
For more information, go to the electronic version "Analysis of Program Activities by Strategic Outcome – Detailed Performance Information" at the following address: www.asc-csa.gc.ca/eng/resources/publications/default.asp#parliament
| Planned Spending | Total Authorities | Actual Spending |
|---|---|---|
| 88.7 | 93.2 | 96.4 |
| Planned | Actual | Difference |
|---|---|---|
| 62.9 | 61.8 | 1.1 |
Any significant variance reported against Planned Spending set out in the 2010-2011 Report on Plans and Priorities is explained in Section 4.1 – Spending by Program Activity.
To learn more about Earth Observation, go to:
www.asc-csa.gc.ca/eng/observation/default.asp
2.1.2) Space Science and Exploration (SE)
Program Activity Description: To better understand the solar system and the universe; expand our knowledge on the constituent elements and origins of life; and strengthen a human presence in space. In doing so, the CSA sustains and increases Canada's contribution to humankind's scientific knowledge, to the exploration of our solar system and the universe and to the development of related technologies.
| Space Science and Exploration 2010-2011 Program Activity Performance Measurement |
|
|---|---|
|
Expected Result Participation in Canadian and international missions expands the scientific knowledge base made available to Canadian academia and research and development communities in the areas of astronomy, space exploration and solar-terrestrial relations, as well as in the physical and life sciences. |
|
|
Main Accomplishments in 2010-2011 In 2010-2011, all contracts under the Economic Stimulus initiative on space robotics that was announced as part of Canada’s Economic Action Plan were awarded. The initiative helped develop terrestrial prototypes of the next generation Canadarm and prototypes of three different rovers and their associated technologies for future Moon and Mars exploration. Through the renewed CSA Class Grant and Contribution Program to support Research, Awareness and Learning in Space Science and Technology, the CSA continued to support the development of science and technology, and fostered the development of a critical mass of researchers and highly qualified people in Canada in areas relevant to the priorities of the CSA. Canadian astronaut Chris Hadfield was chosen to be assigned for the second Canadian Long-Duration mission on the ISS (C-2). The Canadian Astronaut Corps is adapting to the new reality of fewer flight opportunities as a result of the culmination of the Space Shuttle Program. The CSA continued to use the expertise and skill sets of flown astronauts to advance and position the Canadian Space Exploration Program. The CSA continued to fulfill its obligations for Mobile Servicing System (MSS) operations. |
|
| Indicators | Performance Summary |
| 1. Proportion of active missions relative to the total number of missions supported by Canada in the SE priority areas. | 46%; 56 active missions out of 122 missions supported. |
| 2. Number of scientific instruments and technological applications developed as a result of CSA's participation in space missions and/or support to projects/activities in SE. | A combined total of 79 scientific instruments (SI) and technological (TI) applications (56 SI and 23 TI). |
| 3. Number of peer-reviewed papers produced in academia and the R&D community in Canada recognizing CSA’s support through its participation in space missions and/or support to projects/activities in SE. | A total of 744 peer-reviewed papers, reports and conference proceedings acknowledging CSA funding were published in 2010-2011. |
|
Indicator 1 – Performance Analysis For the purpose of Departmental Performance Reporting, the CSA presents a list of space missions to which it actually contributes or plans to contribute. Any mission must necessarily follow many critical steps depicted in a simple manner as such:
(Year) = Actual or projected launch date or date of completion when known. SE missions completed (43): * = 8 APEX-Cambium (2010), APEX-CSA 2 (2010), Aquatic Orgs in ug (2010), Astronauts: EXPEDITION 20/21 (C1), STS-115 (2006), STS-118 (2007), STS-121 (2006), STS-127 (2009), TMA-6/10S (2005), BCAT-5 (2010), BISE (2010), BLAST (2007), CCISS (2010), ELERAD (2007), eOSTEO (2008), ESA-SODI IVIDIL (2010), EVARM, FUSE (2008), HAWAII (2010), H-Reflex, ICE-First (2004), Matroshka-R (2008),
MSS: HTV-2 *, MSS: Increment 23 *, MSS: Increment 24 *, MSS: Increment 25 *, MSS: Increment 26 *, MSS: STS-114 (2005), STS-119 (2009), STS-123 IJ/A (DEXTRE) (2008), STS-124 (2008), STS-126 (2008), STS-131 (Flight 19A) *, STS-132 (Flight ULF4) *, STS-133 *, Phoenix (2008), PMDIS (2009), RADI-N (2010), SCCO (2009), TRAC (2008), TriDAR DTO STS-128 (08-2009), TriDAR DTO STS-131
(04-2010), WISE (2005). |
|
|
SE missions at the Operation stage (13): * = 1 CADC/Hubble (2008), CGSM (2007), ESA-Bed Rest (2006) *, ESA-Hershel-HIFI/Spire (2009), ESA-MICAST (2009), ESA-Planck (2009), ESA-SODI DSC, FPEF-JAXA-Mangaroni Liquid Bridge (2008), Hypersole (2010), MOST (2003), MVIS (2008), THEMIS (2007, 2011), Vascular (2009). |
|
|
SE missions at the Development stage (20): * = 6 ADAMS, Astronauts: EXPEDITION 34/35 (C2) *, ASTRO-H (2009), BCAT-C1 (2011, 2012), BP-Reg *, BRITE-Constellation (2011), CASSIOPE-ePOP (2011), EBEX, ESA-Exomars (2016), ESA-Swarm (2011), JWST-FGS (2014), MSL-APXS (2011), MSS: Increment 27 *, NEOSSat (2011), PRET (2011), RADI-N 2 *, See-Jitter *, SPIDER (2012), TriDAR DTO STS-135 (06-2011) *,UVIT-ASTROSAT (2010). |
|
|
SE missions under review (46): * = 0 CanALSS, CCAP (2014), CHENSS (2014), CIMEX (2013), Dark Energy Mission (2009), DynAMO, ESA-Cross-scale, ESA-NEQUISOL (2013), EVIS, FPNS, GPR, HALO, ICAPS (2010), ILN, Insect Habitat, ISRU, LEMUR, LiteArm, LORE, LSC, Lunar Rover, Luna-Resource-Concept 1, Luna-Resource-Concept 2, MEMS LIDAR, M-FTSIS, MIM/ATEN, MLM, MSO-FTIR, MSO-SAR, MSR NET (Vision System), MWD, New FRONTIERS, OCLE-DOCLE, ORBITALS (2014), PHEMOS, RAO, RAPIER, RAVENS (2004), Remote Care Health Providers, ROSM, SBIS, SCOPE, Si Si-Ge alloys, SPICA, TRACTEUR, VSE. Missions' descriptions can be found in the electronic version of "Analysis of Program Activities by Strategic Outcome – Detailed Performance Information" at the following address: www.asc-csa.gc.ca/eng/publications/default.asp#parliament |
|
|
Indicator 2 – Performance Analysis This year’s total of 79 scientific instruments and technological applications is associated with 40 missions. This number represents an additional 11 instruments/applications compared to last year. When divided by the number of missions, the number of instruments shows a ratio of 1.98 instrument/application per mission; some having a least one related instrument/application up to a maximum of 10 per mission. These 79 instruments/applications can be divided among 4 different fields: 35 instruments/applications were developed for Astronomy/Planetary Exploration missions (44%); 30 instruments/applications for Solar-Terrestrial Relation missions (38%); 10 instruments/applications were developed for Life/Physical Sciences missions (13%), and, 4 instruments/applications were developed for Space Operational Medicine (5%). Source: Internal documents. |
|
|
Indicator 3 – Performance Analysis A total of 744 peer-reviewed papers, reports and conference proceedings acknowledging CSA’s funding were published in 2010-2011 in Space Astronomy and Exploration, Solar-Terrestrial Relation, and Physical and Life Sciences. This indicator is a good example why Science and Technology community performance indicators need to be assessed over a minimum of a three-year span. This year’s number of papers, reports and conference proceedings represents an increase of almost 400% compared to last year but represents a lesser increase (200%) when compared with the 397 peer-reviewed documents reported in 2008-2009. The steadily increasing acuity of the method behind the data collection is a contributing factor to the large fluctuations between the numbers reported over the past three years. Source: Internal reporting documents. |
|
For more information, go to the electronic version "Analysis of Program Activities by Strategic Outcome – Detailed Performance Information" at the following address:
www.asc-csa.gc.ca//eng/resources/publications/default.asp#parliament
| Planned Spending | Total Authorities | Actual Spending |
|---|---|---|
| 185.4 | 189.4 | 156.8 |
| Planned | Annual | Difference |
|---|---|---|
| 225.9 | 202.1 | 23.8 |
Any significant variance reported against Planned Spending set out in the 2010-2011 Report on Plans and Priorities is explained in Section 4.1 – Spending by Program Activity.
To learn more about Space Science and Exploration, go to:
www.asc-csa.gc.ca/eng/sciences/default.asp and,
www.asc-csa.gc.ca/eng/exploration/default.asp
2.1.3) Satellite Communications (SC)
Program Activity Description: To provide all Canadians with the means to participate and fully benefit from the global information age. In doing so, the CSA upholds Canada's status as a world leader in Satellite Communications and extends the most advanced products and services to all Canadians.
| Satellite Communications 2010-2011 Program Activity Performance Measurement |
|
|---|---|
|
Expected Result State-of-the-art systems and applications are developed to satisfy the needs of the Canadian government and population in order to ensure that Canada remains a world leader in satellite communications. |
|
|
Main Accomplishments in 2010-2011 The CSA completed the ground segment infrastructure upgrade needed for the utilization of the Government of Canada capacity credit of the Anik F2 satellite by northern communities. The mission and preliminary system requirements for the Polar Communications and Weather (PCW) mission have been defined in order to meet the needs for full-time broadband communications coverage over Canadian Area of Interest up to the North Pole. The CSA successfully completed a preliminary study for a new mission of a constellation of micro-satellites to provide an automatic identification system (AIS) for ships with the objective of improving maritime monitoring of the Canadian coasts. |
|
| Indicators | Performance |
| 1. Proportion of active missions relative to the total number of missions supported by Canada in the SC priority areas. | One of the 9 missions reached an Operational stage in 2010-2011. |
| 2. Number of technological applications developed as a result of CSA's participation in space missions and/or support to projects/activities in SC. | 10 applications. |
|
Indicator 1 – Performance Analysis For the purpose of Departmental Performance Reporting, the CSA presents a list of space missions to which it actually contributes or plans to contribute. Any mission must necessarily follow many critical steps depicted in a simple manner as such:
(Year) = Actual or projected launch date or date of completion when known. |
|
|
SC missions at the Operation stage (1):*=0 Anik F2 Utilization (2010). |
|
|
SC missions at the Development stage (4):*=0 Cassiope-CASCADE (2012), ESA–Alphasat, ESA-Gallileo SAT (2010), M3MSat (2011). |
|
|
SC missions under review (4):*=1 AIS-Constellation *, Next Generation – Advanced Broadband payload # 1 (2014), PCW (telecommunication aspect) (2016), QuickSat. Missions' descriptions can be found in the electronic version of "Analysis of Program Activities by Strategic Outcome – Detailed Performance Information" at the following address: www.asc-csa.gc.ca/eng/publications/default.asp#parliament |
|
|
Indicator 2 – Performance Analysis A total of 10 applications, compared to 8 in 2009-2010, were identified for the 9 missions listed above: Anik F2 ruggedized ground infrastructure and terminal servicing, Cascade (data storage unit) on board CASSIOPE, Antennas and filters for ESA-Alphasat (2), the MEOSAR instrument on board Galileo satellite and the RSS-GEMS for traffic identification (2), 2 Automatic Identification System related applications for M3MSat and 2 new application developments that consist of a maritime monitoring technology for Canada’s Coastline and another for high speed communications in the Artic; 67% of those applications (2/3) were related to Communications whereas the other 33% supported were related to Security/Search and Rescue. All applications, except one, served national objectives; MEOSAR which is developed in collaboration with ESA will serve the international community. Source: CSA internal documents. |
|
For more information, go to the electronic version "Analysis of Program Activities by Strategic Outcome – Detailed Performance Information" at the following address:www.asc-csa.gc.ca/eng/resources/publications/default.asp#parliament
| Planned Spending | Total Authorities | Actual Spending |
|---|---|---|
| 19.7 | 21.7 | 16.6 |
| Planned | Annual | Difference |
|---|---|---|
| 13.6 | 16.3 | (2.7) |
Any significant variance reported against Planned Spending set out in the 2010-2011 Report on Plans and Priorities is explained in Section 4.1 – Spending by Program Activity.
To learn more about Satellite Communications, go to:
www.asc-csa.gc.ca/eng/satellites/default.asp
2.1.4) Generic Technological Activities (GTA) in support of EO, SE and SC
Program Activity Description: To provide leadership, coordination or support to Earth Observation, Space Science and Exploration, and Satellite Communications through activities that are generic in their nature since they contribute to all three program activities.
| Generic Technological Activities in Support of EO, SE and SC 2010-2011 Program Activity Performance Measurement |
|
|---|---|
|
Expected Result Canada’s industrial technological capabilities can meet the needs of future space missions and activities. |
|
|
Main Accomplishments in 2010-2011 In 2010-2011, the CSA and the Natural Sciences and Engineering Research Council continued to foster closer collaboration between industry, universities and government in space research and technology development. Twelve agreements flowing from this program were either initiated or continued in 2010-2011. In the meantime, the CSA increased the accessibility and availability of the David Florida Laboratory facilities to academia and the Canadian and foreign space companies, while assembling and testing in priority sequence the hardware for CSA’s projects. |
|
| Indicators | Performance |
| 1. Ratio of the number of priority technologies identified for future EO, SE and SC missions to the number of priority technologies developed in GTA. | Performance unavailable this year. |
| 2. Number of priority technologies supported that are ready to be used. | One out of the 31 prioritized technologies. |
|
Indicator 1 – Performance Analysis The measurement of this indicator is unavailable this year. Source: Internal reporting documents. |
|
|
Indicator 2 – Performance Analysis One out of the 31 prioritized technologies is ready to be used. In order to be considered "ready to be used", a technology must reach a level of readiness (TRL) of "6" or higher on the scale developed by NASA. As a new technology proceeds to a higher level of maturity, the risk associated with its implementation in a space mission lessens substantially. Each level represents a development milestones, such as: TRL 6: System model or prototype demonstration in a relevant environment; It takes time and investment for a new technology to reach these levels of readiness and therefore the priority selection often precedes the actual need and eventual use by several years. Only one of the newly prioritized technologies reached the "readiness" stage in 2010-2011: RF Filters for Reconfigurable payloads. Source: Internal reporting documents. |
|
For more information, go to the electronic version "Analysis of Program Activities by Strategic Outcome – Detailed Performance Information" at the following address:www.asc-csa.gc.ca/eng/resources/publications/default.asp#parliament
| Planned Spending | Total Authorities | Actual Spending |
|---|---|---|
| 46.2 | 48.6 | 45.0 |
| Planned | Annual | Difference |
|---|---|---|
| 120.4 | 115.4 | 5.0 |
Any significant variance reported against Planned Spending set out in the 2010-2011 Report on Plans and Priorities is explained in Section 4.1 – Spending by Program Activity.
2.1.5) Space Awareness and Learning (AL)
Program Activity Description: To further public understanding and engagement with regards to space related issues, ultimately improving the scientific literacy of Canadians by carrying out a national awareness and learning initiative in support of the CSA programs.
| Space Awareness and Learning 2010-2011 Program Activity Performance Measurement |
|
|---|---|
|
Expected Result Targeted level of awareness of space among Canadians is reached. |
|
|
Main Accomplishments in 2010-2011 The number of visitors to the CSA’s interactive website increased by 27% from 1.050 million in 2009-2010 to 1.332 million in 2010-2011. A total of 100 public events were conducted in communities throughout Canada, including 59 specifically involving Canadian astronauts, and 3 traveling exhibits were loaned for display with science center partners to raise awareness of space science and technology. A total of 690 educators received professional development in workshops conducted in provinces across the country and at annual conferences of teachers in four provinces: British Columbia, Alberta, Ontario and Prince Edward Island. A total of 460,071 students from across the country were reached through workshops and learning materials developed by the CSA and still others in activities and events supported by the Space Learning Grants and Contributions Program. |
|
| Indicators | Performance |
| 1. Survey results obtained every 3 years. | No National Public Opinion survey was conducted. |
For more information, go to the electronic version "Analysis of Program Activities by Strategic Outcome – Detailed Performance Information" at the following address: www.asc-csa.gc.ca/eng/resources/publications/default.asp#parliament
| Planned Spending | Total Authorities | Actual Spending |
|---|---|---|
| 8.1 | 8.1 | 7.3 |
| Pr�vues | Annuelles | �cart |
|---|---|---|
| 28.8 | 25.7 | 3.1 |
Any significant variance reported against Planned Spending set out in the 2010-2011 Report on Plans and Priorities is explained in Section 4.1 – Spending by Program Activity.
To learn more about Space Awareness and Learning, go to:
www.asc-csa.gc.ca/eng/educators/default.asp
2.1.6) Internal Services
Program Activity Description: To implement the government's commitment to modern public service management in accordance with the Management Accountability Framework's (MAFs) expectations.
| Internal Services 2010-2011 Program Activity Performance Measurement |
|
|---|---|
|
Expected Result #1 Internal Services provide an added value to CSA managers in the performance of their duties. |
|
|
Main Accomplishments in 2010-2011 The CSA has integrated its new Program Activity Architecture and Performance Measurement Framework as well as its reviewed organizational structure in all corporate operational and financial management systems for the planning and monitoring of all programs starting fiscal year 2011-2012. The CSA has approved its 2010-2013 Integrated Corporate Human Resources Plan in line with the Program Activity Architecture which addresses government priorities and CSA specific issues. The CSA has approved its 2010-2013 Integrated Corporate Human Resources Plan in line with the Program Activity Architecture which addresses government priorities and CSA specific issues. The CSA updated its policies pertaining to intellectual property management and streamlined its procedures to facilitate access to intellectual property assets through licensing or dissemination. CSA also reviewed half of its current portfolio of technologies and conducted 15 commercial studies on the most promising ones to find potential licensees. |
|
| Indicators | Performance |
| 1. CSA's rating against Management Accountability Framework criteria based on Round VIII assessment. | There were 11 areas of management assessed. The ratings were: Strong = 1; Acceptable = 3; Opportunity for improvement = 6; and, Attention required = 1 The MAF results have declined as compared with 2009-2010. |
|
Indicator 1 – Performance Analysis The Management Accountability Framework (MAF) is a key instrument for management oversight that provides informed opinions about the state of management in federal government organizations. The MAF is used by deputy heads to improve management performance. The MAF results have declined as compared with 2009-2010. Two areas of management have improved, 5 have remained the same, and 4 have declined. The CSA has demonstrated its strength in the areas of management Evaluation and People Management. Although there are a number of opportunities for improvement, in the short term the CSA is expected to make progress in the areas of management Managing for Results and Citizen-Focused Services. Sustained effort will be spread out in priority areas of management Security, Risk Management and Investment Planning. The assessment reveals that cross-cutting initiatives such as the review of the CSA governance and risk management started in 2010-2011 will have a positive effect on the performance across many areas of management. Source: Round VIII 2010-2011 Management Accountability Framework Assessment. (May 2011). |
|
|
EXPECTED RESULT #2 The two highest priority risks identified in the CSA Corporate Risk Profile are addressed and mitigated. |
|
| Indicators | Performance |
| 1. Mitigation action plans are implemented against the corporate risks identified as highest priorities. | Overall, 6 out of 17 (35%) risk mitigation actions were completed. Seven (41%) actions were initiated with a planned completion in 2011-2012. The last 4 (24%) actions were kept on-hold and are under review. |
|
Indicator 1 – Performance Analysis There were 10 actions planned to mitigate the corporate risk Integration and implementation defined as “The capacity of CSA to align its strategies, planning, priorities, funding levels, operations and capacity to deliver, and to obtain clear understanding and buy-in from managers and staff at all levels”. Only one (10%) out of 10 actions was completed. Five (50%) actions were initiated and will be completed in 2011-2012 with a focus set on the development new governance structure to strengthen planning, decision-making and accountability processes. There were 7 actions planned to mitigate the corporate risk Workforce defined as “The capacity of CSA to hire and maintain a qualified workforce of public servants to deliver its mandate.” The corporate risk assessment concluded that this risk remains a high priority and a mitigation action plan was developed. Five (72%) out of the 7 actions were completed. Two actions were initiated and will be completed in 2011-12 as planned. The CSA initiated a full review of its corporate risk analysis and mitigation action planning in accordance with the TBS Framework for the Management of Risk. The implementation will be in time for the planning of fiscal year 2012-2013. Source: CSA Corporate Risk Profile (Internal document). |
|
For more information, go to the electronic version "Analysis of Program Activities by Strategic Outcome – Detailed Performance Information" at the following address:
www.asc-csa.gc.ca/eng/resources/publications/default.asp#parliament
| Planned Spending | Total Authorities | Actual Spending |
|---|---|---|
| 42.8 | 44.8 | 50.6 |
| Planned | Annual | Difference |
|---|---|---|
| 269.9 | 271.8 | (1.9) |
Any significant variance reported against Planned Spending set out in the 2010-2011 Report on Plans and Priorities is explained in Section 4.1 – Spending by Program Activity.
2.2 Canada’s Economic Action Plan (CEAP)
In Budget 2009, Canada's Economic Action Plan (CEAP) provided the CSA with an additional $110 million over three years. The two main objectives of this initiative are the preservation of Canadian expertise and leadership in space robotics, and increasing Canada’s readiness and credibility as a partner for participation in future international space robotics projects and space exploration missions.
In 2010-2011, all contracts under CEAP have been awarded and some amendments are being implemented early in 2011-2012. Canadian firms and universities are developing terrestrial prototypes of the next generation Canadarm and prototypes of three different rovers and their associated technologies for future Moon and Mars exploration. The CSA also issued contracts for the development of science instruments and to support analogue mission deployments.
| Expected Result | |
|---|---|
| Maturing science, technology and operational solutions for planning and strategic positioning purposes. | |
| Indicator | Performance |
| Number of science, technology and operational solutions that are under development in conformity with the orientations and conclusions of the Canadian Space Exploration strategic plan. | Performance will be measured in the 2011-2012 Departmental Performance Report. |
2.3 Lessons Learned
Each year, the CSA releases reports on Audit and Evaluation follow-up action plans which measure the progress made in improving its business management. Here are a few examples showing the response given by management in 2010-2011 to audit and evaluation recommendations:
Corporate Risk Management Framework
The audit evaluated how well management established a corporate risk management framework, and recommended various measures to improve governance and management practices. During the year, management followed up on two of five activities planned. A risk management champion was appointed with the responsibility of implementing by March 31, 2012, main outstanding activities which involve:
- Implement the new integrated risk management policy and related procedures.
- Providing clarifications to distinguish the corporate risk management framework from the project management framework.
Information Technology Planning and Development Risks
The audit evaluated how well planning and development processes and procedures ensure that Information Technology user needs are met. A number of on-going good practices were identified, and some recommendations were made to help mitigate risks in IT planning and development. Management plans to finish implementing the initial action plan by March 31, 2013. During the year management followed up on four of eight recommendations among which:
- Steps were taken to formalize the new change management process.
- CSA sectors now establish a priority list of IT initiatives for the coming years.
- Written confirmation must be obtained from the owner of an application before systems are modified.
Information Technology Dependence
The audit evaluated the adequacy and effectiveness of mechanisms in place to control processes and procedures designed to reduce the risk of dependence on information technology. A number of on-going good practices were indentified, and some recommendations were made to reduce the risk of dependence on IT. During the year management followed up on 3 of the 15 recommendations among which:
- Implementation of employees training plans is monitored; and,
- Application portfolio is reviewed to identify obsolete applications.
Management plans to finish implementing most of the recommendations by March 31, 2012 which involve business continuity, staffing and IT succession plans.
Values and Ethics Management Framework
The audit evaluated how well the CSA integrated control activities to highlight the importance of values and ethics in achieving organizational objectives. General on-going activities to promote values and ethics were identified and recommendations were made to improve governance, procedure, dissemination of information and communication on values and ethics. During the year, management followed up on three of seven activities whose deadline was March 31, 2011 among which:
- Management appointed responsible officers and also began to hold regular meetings of the values and ethics program steering committee.
- Employees were also informed, through the intranet, about the CSA’s procedure for the disclosure of wrongdoing.
Management is continuing its efforts to complete the other activities by which involve:
- Implementing of values and ethics dissemination plan;
- Increasing the promotion of values and ethics; and,
- Implementing a formal procedure for handling confidential reports.
RADARSAT-2 Major Crown Project
The evaluation of RADARSAT-2 Major Crown Project was conducted as per Treasury Board Secretariat’s policies. The evaluation provided recommendations relating to the lack of clarity of common objectives; the fact that the roles and responsibilities of each partner were not clearly defined; the need to make security issues a priority; and, the need to monitor the performance and the value-added of the project.
All the recommendations were implemented and now CSA approval documents must address these issues at the onset of future projects. A performance measurement strategy is being implemented to measure the impact and value-added of RADARSAT-2 on the Earth Observation sector. This concludes the reporting on RADARSAT-2 Major Crown Project.
To learn more about Management Action Plans Follow-Up for Internal Audit, go to:
www.asc-csa.gc.ca/pdf/Audit_2011.pdf
To learn more about Management Action Plans Follow-Up for Evaluation, go to:
www.asc-csa.gc.ca/pdf/Audit_2011_evaluation.pdf
To learn more about each Audit and Evaluation reports, go to:
www.asc-csa.gc.ca/eng/publications/default.asp#audit
Section 3: Supplementary Information
3.1 Financial Highlights
3.1.1) Condensed Statement of Financial Position
| (As at March 31) | Percentage Variance | 2011 | 2010 | |
|---|---|---|---|---|
| Total | (2.8%) | 1,401,295 | 1,441,861 | |
| Assets | Total Assets | (2.8%) | 1,401,295 | 1,441,861 |
| Liabilities | Total Liabilities | 19.7% | 136,781 | 114,303 |
| Equity | Total Equity | (4.7%) | 1,264,514 | 1,327,558 |
3.1.2) Condensed Statement of Financial Operations
| (For the period ending March 31) | Percentage Variance | 2011 | 2010 | |
|---|---|---|---|---|
| Net Cost of Operations | 7.1% | 437,081 | 408,070 | |
| Expenses | Total Expenses | 7.5% | 442,326 | 411,350 |
| Revenues | Total Revenues | 59.9% | 5,245 | 3,280 |
3.2 Financial Highlights Graph
Assets by Type
Total assets were $1.401 million at the end of 2010-2011, a decrease of $40.6 million (2.8%) over the previous year’s total assets of $1.442 million. Tangible Capital Assets comprised 67.1% of total assets at $940.7 million. Prepaid Expenses represented $364.9 million (26.0%) and amount due from the Consolidated Revenue Fund represented $92.9 million (6.6%) of total assets.
3.3 Financial Statements
Information on CSA's Financial Statements is at the following address:
www.asc-csa.gc.ca/eng/publications/default.asp#parliament
3.4 List of Supplementary Information Tables
Electronic supplementary information tables listed in the 2010-2011 Departmental Performance Report can be found on the Treasury Board of Canada Secretariat’s website at: http://www.tbs-sct.gc.ca/dpr-rmr/st-ts-eng.asp.
- Sources of Non-Respendable Revenue
- User Fees Reporting
- Status Report on Projects Operating with Specific Treasury Board Approval
- Status Report on Major Crown and Transformational Projects
- Details on Transfer Payment Programs (TPPs)
- Response to Parliamentary Committees and External Audits
- Internal Audits and Evaluations
hr
Section 4: Other Items of Interest
4.1) Spending by Program Activity
| Description | Planned Spending ($ in millions) |
Actual ($ in millions) |
Variance ($ in millions) |
|---|---|---|---|
| Space Based Earth Observation | 88.7 | 96.4 | (7.7) |
|
Comments: The variance of $(7.7) million was mainly due to the following factors:
|
|||
| Description | Planned Spending ($ in millions) |
Actual ($ in millions) |
Variance ($ in millions) |
|---|---|---|---|
| Space Science and Exploration | 185.4 | 156.8 | 28.6 |
|
Comments: The variance of $28.6 million was mainly due to the following factors:
|
|||
| Description | Planned Spending ($ in millions) |
Actual ($ in millions) |
Variance ($ in millions) |
|---|---|---|---|
| Satellite Communications | 19.7 | 16.6 | 3.1 |
|
Comments: The variance of $3.1 million was mainly due to the following factor:
|
|||
| Description | Planned Spending ($ in millions) |
Actual ($ in millions) |
Variance ($ in millions) |
|---|---|---|---|
| Generic Technological Activities in support of EO, SE and SC | 46.2 | 45.0 | 1.2 |
|
Comments: The variance of $1.2 million was mainly due to the following factors:
|
|||
| Description | Planned Spending ($ in millions) |
Actual ($ in millions) |
Variance ($ in millions) |
|---|---|---|---|
| Space Awareness and Learning | 8.1 | 7.3 | 0.8 |
|
Comments: No significant variance between Planned Spending and Actual. |
|||
| Description | Planned Spending ($ in millions) |
Actual ($ in millions) |
Variance ($ in millions) |
|---|---|---|---|
| Internal Services | 42.8 | 50.6 | (7.8) |
|
Comments: The variance of $(7.8) million was mainly due to the following factors:
|
|||
4.2) FTEs Variance (Full-time Equivalent)
In 2010-2011, the difference of 28 between planned and actual FTEs is mainly due to delays in staffing activities. However, this shows a significant improvement from the previous year which had ended with a difference of 49 FTEs. This improvement is a result of a better planning of FTE requirements and the implementation of a corporate staffing action plan.
4.3) List of Space Missions
A description of missions can be found in the electronic document called: "Analysis of Program Activities by Strategic Outcome – Detailed Performance Information" at the following address:www.asc-csa.gc.ca/eng/publications/default.asp#parliament
4.4) Organizational Contact Information
Canadian Space Agency
Communications and Public Affairs
Telephone: 450-926-4370
Fax: 450-926-4352
E-mail: media@asc-csa.gc.ca