
Treasury Board of Canada Secretariat
www.tbs-sct.gc.ca
Common menu bar links
Breadcrumb Trail
ARCHIVED - Industry Canada
 This page has been archived.
Archived Content
Information identified as archived on the Web is for reference, research or recordkeeping purposes. It has not been altered or updated after the date of archiving. Web pages that are archived on the Web are not subject to the Government of Canada Web Standards. As per the Communications Policy of the Government of Canada, you can request alternate formats on the "Contact Us" page.
Section 3: Supplementary Information
3.1 Financial Highlights
| (in thousands of dollars) | Percent Change |
2008 | 2007 |
| At End of Year (March 31, 2008): Condensed Statement of Financial Position |
|||
| Assets | |||
| Financial Assets | 4.6 | 1,634,501 | 1,561,930 |
| Non-Financial Assets | 3.1 | 111,286 | 107,908 |
| TOTAL | 4.5 | 1,745,787 | 1,669,838 |
| Liabilities | |||
| Total Liabilities | -2.0 | 2,248,007 | 2,295,007 |
| Equity | |||
| Total Equity | 19.7 | (502,220) | (625,169) |
| TOTAL | 4.5 | 1,745,787 | 1,669,838 |
| For the Year (Ended March 31): Condensed Statement of Operations |
|||
| Expenses | |||
| Transfer Payments | -16.2 | 609,831 | 728,093 |
| Operating Expenses | -1.3 | 757,958 | 768,239 |
| Total Expenses | -8.6 | 1,367,789 | 1,496,332 |
| Revenues | |||
| Total Revenues | 3.9 | 727,546 | 700,261 |
| Net Cost of Operations | -19.6 | 640,243 | 796,071 |
 D
D
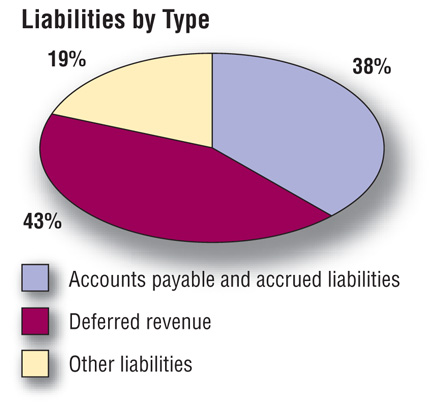
Total liabilities were $2,248 million at the end of 2007–08, a decrease of $47 million (2 percent) versus last year’s total liabilities. Deferred revenue and accounts payable continued to be the largest components of liabilities. Together they were 80.7 percent of total liabilities.
 D
D
Total assets were $1,746 million at the end of 2007–08, an increase of $76 million (4.5 percent) versus last year’s total assets. Investments continued to be the largest asset component, representing 61 percent of assets.
 D
D
Total expenses were $1,368 million at the end of 2007–08, a decrease of $129 million (8.6 percent) versus last year’s total expenses. Major expense areas included transfer payments and salaries and employee benefits.
Total revenues were $728 million at the end of 2007–08, an increase of $27 million (3.9 percent) versus last year’s total revenues. Sales of services accounted for almost 94 percent of total revenues.
3.2 List of Tables
- Loans, Investments and Advances (Non-budgetary)
- Sources of Respendable and Non-Respendable Revenue
- User Fees/External Fees
- Details on Industry Canada’s Transfer Payment Programs (TPPs)
- Foundations (Conditional Grants)
- Horizontal Initiatives
- Sustainable Development Strategy
- Response to Parliamentary Committee, Audits and Evaluations
- Internal Audits and Evaluations
- Travel Policies
- Financial Statements of Department of Industry