
Treasury Board of Canada Secretariat
www.tbs-sct.gc.ca
Common menu bar links
Breadcrumb Trail
ARCHIVED - Industry Canada
 This page has been archived.
Archived Content
Information identified as archived on the Web is for reference, research or recordkeeping purposes. It has not been altered or updated after the date of archiving. Web pages that are archived on the Web are not subject to the Government of Canada Web Standards. As per the Communications Policy of the Government of Canada, you can request alternate formats on the "Contact Us" page.
Minister’s Message

The Industry Portfolio experienced a busy and successful 2007–2008. As Minister of Industry, I am pleased with the progress made on our mission to foster a competitive, knowledge-based economy that benefits all Canadians.
A competitive economy is one that provides jobs and opportunity to Canadians, and top-quality products and services to consumers. Our economic performance underpins the quality of life we enjoy in this country, and the Department is making important contributions to this mission.
The Industry Portfolio is composed of Industry Canada and 10 other agencies, Crown corporations and quasijudicial bodies. These organizations collectively advance Canada’s industrial, scientific and economic development, and help ensure that we remain competitive in the global marketplace.
As a country, we must remain focused on how we can continue to provide an innovative and entrepreneurial economic environment, help our businesses capitalize on opportunities, and provide choice and quality to consumers. The global marketplace continues to evolve, changing with it the dynamics that influence Canada’s performance. I am proud to say that the Industry Portfolio is playing its part:
- We are working to make our market for wireless services more competitive, this year launching the policy framework for the Advanced Wireless Services spectrum auction. The framework aims to provide more choice and better service for consumers and businesses — something that we believe will also lead to lower prices.
- We issued guidelines clarifying the application of the Investment Canada Act as it relates to foreign state-owned enterprises investing in our country to ensure that Canadians continue to enjoy all the benefits that foreign investment delivers.
- We instituted an independent Competition Policy Review Panel to review and report on key elements of Canada’s competition and investment policies and to ensure that they are working to the full benefit of Canadians.
- We created an Automotive Innovation Fund to provide support to automotive firms undertaking large-scale, strategic research and development (R&D) projects to build innovative, greener and more fuel-efficient vehicles. Similarly, investments made through the Strategic Aerospace and Defence Initiative continue to encourage strategic R&D that will result in innovation and excellence in new products and services.
One of my key priorities as Industry Minister continues to be our country’s science and technology (S&T) strategy, Mobilizing Science and Technology to Canada’s Advantage, announced by Prime Minister Harper in May 2007.
- Budget 2008 included measures and initiatives in support of our S&T Strategy that total $654 million over the next three years.
- We put in place the new Science, Technology and Innovation Council to provide the government with objective policy advice on Canada’s S&T issues.
- The government allocated $105 million in 2007–2008 to support the operations of seven new Centres of Excellence, pilot projects that have the potential to make Canada a global leader in fields of research that offer a strategic opportunity for Canadian industry.
- This past March, Canada’s two-armed robot, Dextre, was successfully installed on the International Space Station.
The Department is also working to maximize opportunities for Canadian firms to succeed:
- Through the Industrial and Regional Benefits Policy, we secured over $1.6 billion in commitments from major global contractors, which will result in huge opportunities for Canadian firms.
- We extended BizPaL, an online service that simplifies the business permit and licensing process, into seven provinces and territories, and we continue to reduce red tape through our Paperwork Burden Reduction Initiative.
This has been a year of progress and success, and it is my pleasure to present Industry Canada’s Departmental Performance Report for 2007–2008. I am committed to building on these successes in 2008 and beyond, and I will continue to work with officials in the Industry Portfolio to make Canada more efficient, productive and competitive, expanding opportunity for our firms and providing benefits to consumers.
Tony Clement
Minister of Industry
Section 1: Overview of the Department
1.1 Summary Information
Raison d’�tre
- Provides more and better-paying jobs for Canadians
- Supports stronger economic growth through continued improvements in productivity and innovation performance
- Gives businesses, consumers and investors confidence that the marketplace is fair, efficient and competitive
- Integrates the economic, environmental and social interests of Canadians
Responsibilities
The Minister of Industry is responsible for carrying out Industry Canada’s mandate through the Department as well as the Industry Portfolio. The Minister has jurisdiction over policy issues relating to industry; trade and commerce; science; consumer affairs; corporations and corporate securities; competition and restraint of trade, including mergers and monopolies; bankruptcy and insolvency; intellectual property; telecommunications; investment; small businesses; and regional economic development for Ontario.
The Deputy Minister and Senior Associate Deputy Minister are accountable for the stewardship of Industry Canada. They provide strategic direction and sound management, so that the Department effectively contributes to achieving the government’s priorities and its wide range of activities is well coordinated and produces concrete results.
From an operational point of view, Industry Canada’s governance structure is functionally expressed through its committee structure. The governance structure exists within the Department at both the working and senior management levels, and the committees provide oversight and decision-making authority in a number of areas, including policy, procurement and contracting.
Industry Canada has a number of senior management committees that work to support senior executives and, ultimately, the Minister. These committees enable the development and delivery of policies and programs and oversee the management of the complex departmental machinery. The committee structure is traditional in nature — divided among operations (Management Committee and Executive Committee), policy (Deputy Ministers’ Policy Table) and independent oversight (Departmental Audit Committee). These committees support the Deputy Minister and the Senior Associate Deputy Minister in fulfilling their management responsibilities for the Department. This structure provides strategic direction and oversight, which facilitate the achievement of the Department’s three strategic outcomes.
Organizational Changes within Industry Canada
The Department’s organizational chart reflects a number of organizational changes that occurred in 2007–08 and are outlined in further detail below. It is important to note that this year’s performance report is based on the Department’s Program Activity Architecture (PAA). Given the timing of these changes, they were not reflected in the 2007–08 PAA and are therefore not reflected in this year’s performance report.
The organizational changes include the following:
- Operations Sector: The previous Operations Sector was split into the Small Business and Marketplace Services Sector and the Regional Operations Sector following a realignment of Industry Canada’s operational agenda.
- Policy Sector: The Policy Sector was split to create a more focused Strategic Policy Sector and a new Science and Innovation Sector with better focus on innovation in its broadest term.
- Security and Prosperity Partnership of North America (SPP): Following the North American Leaders Summit in Montebello, Quebec, in August 2007, the Minister of Industry was designated as the lead Minister for SPP, a trilateral means through which Canada engages in dialogue, priority-setting, collaboration and action with its North American counterparts to improve the security, prosperity and quality of life of North Americans. In this capacity, Industry Canada will support the Minister in working closely with his Canadian colleagues, and his United States and Mexican counterparts, to identify and advance initiatives within the five priority areas: Enhancing the Global Competitiveness of North America; Safe Food and Products; Sustainable Energy and Environment; Smart and Secure Borders; and Emergency Management and Preparedness.
- Technology Partnerships Canada (TPC): In February 2007, Industry Canada’s Technology Partnerships Canada (TPC) was renamed the Industrial Technologies Office (ITO), the Special Operating Agency with the mandate to manage both the Strategic Aerospace and Defence Initiative (SADI) and projects previously contracted through the TPC program. SADI was not announced until April 2, 2007, and as a result was not reported in the 2007–08 Report on Plans and Priorities (RPP).
Machinery of Government Changes
In 2007–08 the following machinery of government changes impacted Industry Canada:
Aboriginal Business Canada (ABC) — ABC was transferred from Industry Canada to Indian and Northern Affairs Canada (INAC) as of December 2006. Given that the change occurred late in the fiscal year, the Main Estimates for 2007–08 did not reflect the transfer. For this reason, the financial and human resources related to ABC were included in Industry Canada’s 2007–08 RPP, but are not reported against in this DPR. The transfer was reported, however, in the 2007–08 Supplementary Estimates and is reflected in the 2008–09 Annual Reference Level Update.
Mackenzie Gas Project (MGP) — The MGP was transferred from Indian and Northern Affairs Canada (INAC) to Industry Canada on December 10, 2007. The MGP is a proposed 1,220-kilometre natural gas pipeline system through the Mackenzie Valley in the Northwest Territories that will connect northern onshore gas fields with North American markets and has the potential to make key contributions to Canada’s role as an energy superpower. Given that the process of transferring the funding from INAC to Industry Canada will be completed in 2008–09, additional performance reporting will be provided in subsequent DPRs.
National Science Advisor (NSA)1 — The NSA was transferred from the Privy Council Office (PCO) to Industry Canada as of May 2006. Due to the timing of this transfer, the NSA was not reflected in the 2007–08 Program Activity Architecture on which the RPP and this DPR are based. In the interim, the financial and human resources associated with the NSA are included with Corporate Services, and the resources are divided across all programs and services.
Strategic Outcomes
In order to effectively pursue its mandate, Industry Canada aims to achieve the following three strategic outcomes.
- A fair, efficient and competitive marketplace
- An innovative economy
- Competitive industry and sustainable communities
The strategic outcomes are depicted in the following diagram:
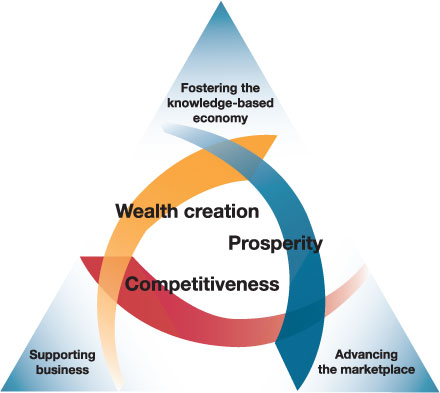
A fair, efficient and competitive marketplace
- By advancing the marketplace, we are developing and administering economic framework policies that promote innovation and competition and instill business, investor and consumer confidence.
An innovative economy
- By fostering the knowledge-based economy, we support foundational investments in science and technology to create new knowledge and equip Canadians with the skills and training they need to compete in the global knowledge-based economy.
Competitive industry and sustainable communities
- By supporting business we anchor and support business innovation and productivity, because businesses are the organizations that create wealth and generate jobs.
Program Activity Architecture
The chart below illustrates Industry Canada’s complete framework of program activities and sub-activities, which feed into and contribute to progress toward the Department’s three Strategic Outcomes.
 Industry Canada – Program Activity Architecture
|
Strategic Outcomes |
||
| A fair, efficient and competitive marketplace | An innovative economy |
Competitive industry and sustainable communities |
|
Program Activities |
||
| Policy Sector – Marketplace | Policy Sector – Science & Technology (S&T) and Innovation | Policy Sector – Economic Development |
|
Sub-Activities
|
Sub-Activities
|
Sub-Activities
|
|
Operations Sector – Marketplace |
Industry Sector – S&T and Innovation |
Operations Sector – Economic Development |
|
Sub-Activities
|
Sub-Activities
|
Sub-Activities
|
|
Spectrum, Information Technologies and Telecommunications Sector – Marketplace |
Spectrum, Information Technologies and Telecommunications Sector – S&T and Innovation |
Industry Sector – Economic Development |
|
Sub-Activities
|
Sub-Activities
|
Sub-Activities
|
|
Office of Consumer Affairs (OCA) |
Communications Research Centre Canada (CRC) |
Spectrum, Information Technologies and Telecommunications Sector – Economic Development |
|
Sub-Activities
|
Sub-Activities
|
Sub-Activities
|
|
Competition Bureau – Marketplace |
Technology Partnerships Canada (TPC) |
|
|
Sub-Activities
|
Sub-Activities
|
|
|
Canadian Intellectual Property Office |
||
| ($ millions) | 2005–06 Actual |
2006–07 Actual |
2007–08 | |||
|---|---|---|---|---|---|---|
| Main Estimates |
Planned Spending |
Total Authorities |
Total Actuals |
|||
| A Fair, Efficient and Competitive Marketplace | ||||||
| Policy Sector – Marketplace | 7.2 | 6.2 | 9.1 | 9.1 | 12.1 | 10.7 |
| Operations Sector – Marketplace | 110.2 | 86.5 | 85.1 | 91.7 | 90.9 | 82.4 |
| Spectrum, Information Technologies and Telecommunications Sector – Marketplace | 73.4 | 67.0 | 49.4 | 50.1 | 61.4 | 58.7 |
| Chief Information Office Sector – Marketplace1 | 0.6 | – | – | – | – | – |
| Office of Consumer Affairs | 5.6 | 5.9 | 5.3 | 5.3 | 6.6 | 6.4 |
| Competition Bureau | 55.7 | 42.1 | 38.7 | 45.7 | 47.4 | 46.4 |
| Canadian Intellectual Property Office (CIPO) Revolving Fund | (27.6) | (28.5) | 1.0 | 1.0 | 117.9 | (21.3) |
| Subtotal | 225.2 | 179.3 | 188.7 | 203.0 | 336.4 | 183.4 |
| An Innovative Economy | ||||||
| Policy Sector – S&T and Innovation | 42.2 | 10.6 | 10.2 | 52.6 | 148.9 | 148.8 |
| Industry Sector – S&T and Innovation | 172.5 | 4.9 | 10.0 | 11.8 | 24.1 | 19.4 |
| Spectrum, Information Technologies and Telecommunications Sector – S&T and Innovation | 20.8 | 24.1 | 3.0 | 27.0 | 18.2 | 15.1 |
| Communications Research Centre Canada | 56.5 | 50.6 | 41.5 | 41.5 | 45.0 | 42.9 |
| Technology Partnerships Canada | 473.7 | 409.9 | 331.0 | 397.3 | 475.5 | 431.8 |
| Subtotal | 765.7 | 500.1 | 395.7 | 530.2 | 711.7 | 658.0 |
| Competitive Industry and Sustainable Communities | ||||||
| Policy Sector – Economic Development | 27.2 | 12.2 | 11.2 | 11.2 | 12.1 | 11.7 |
| Operations Sector – Economic Development | 377.4 | 352.8 | 318.6 | 282.7 | 333.6 | 292.2 |
| Industry Sector – Economic Development | 83.0 | 68.4 | 67.7 | 68.6 | 180.2 | 168.6 |
| Spectrum, Information Technologies and Telecommunications Sector – Economic Development | 119.6 | 76.9 | 13.5 | 44.8 | 50.7 | 50.1 |
| Chief Information Office Sector – Economic Development1 | 18.9 | – | – | – | – | – |
| Subtotal | 626.2 | 510.3 | 411.0 | 406.4 | 576.5 | 522.6 |
| Budgetary Main Estimates | 1,617.0 | 1,189.6 | 995.3 | 1,139.6 | 1,624.5 | 1,363.9 |
| Non-Budgetary Main Estimates | – | – | 0.8 | 0.8 | 2.8 | – |
| Total | 1,617.0 | 1,189.6 | 996.1 | 1,140.4 | 1,627.3 | 1,363.9 |
| Less: Non-respendable revenue2 | (485.4) | (522.3) | N/A | (456.3) | N/A | (569.2) |
| Plus: Cost of services received without charge2 | 79.8 | 84.8 | N/A | 78.2 | N/A | 84.5 |
| Net Cost of Department | 1,211.4 | 752.2 | 996.1 | 762.3 | 1,627.3 | 879.2 |
| Full-Time Equivalents | 5,683 | 5,521 | N/A | 6,055 | N/A | 5,392 |
*Minor differences are due to rounding.
1Chief Information Office Sector is now part of Internal Services and is no longer displayed separately, starting in 2006–07, figures were provided for 2005–06 only.
2Non-respendable revenue and services received without charge are not included in the Main Estimates or Total Authorities of the Department.
1.2 Summary of Performance*
| Strategic Outcome 1: A fair, efficient and competitive marketplace | ||||||
| Performance Indicators | Result | Trend | ||||
| Barriers to competition | Standards and regulations were identified as the most common barriers to competition in a survey of Canadian companies.2 | No Change** | ||||
| Regulatory and administrative capacity | Canada remains 2nd in the world on the number of days it takes to start a business. It takes only 3 days to start a business in Canada.3 | No Change | ||||
|
Alignment to Government of Canada Outcomes A Fair and Secure Marketplace Highlight of Achievements against Priorities
|
||||||
| Program Activity | Expected Results | Planned Spending ($ millions) |
Total Authorities ($ millions) |
Actual Spending ($ millions) |
||
| 2007–08 | 2007–08 | 2007–08 | ||||
| Policy Sector – Marketplace | Development and coordination of policy frameworks that support a fair, efficient and competitive marketplace | 9.1 | 12.1 | 10.7 | ||
| Operations Sector – Marketplace | Marketplace fairness, integrity and efficiency is protected through regulation and promotion in the areas of insolvency, weights and measures, federal incorporation, and spectrum management | 91.7 | 90.9 | 82.4 | ||
| Spectrum, Information Technologies and Telecommunications (SITT) Sector – Marketplace | A policy and regulatory framework to govern Canada’s radiocommunications and telecommunications infrastructure in support of Canadian marketplace requirements and shape the digital economy | 50.1 | 61.4 | 58.7 | ||
| Office of Consumer Affairs – Marketplace | Strengthened responses to consumer issues | 5.3 | 6.6 | 6.4 | ||
| Competition Bureau – Marketplace | Increased compliance with legislation under the Competition Bureau’s jurisdiction | 45.7 | 47.4 | 46.4 | ||
| Canadian Intellectual Property Office – Marketplace | Deliver quality and timely intellectual property products and services Increase awareness and use of intellectual property |
1.0 | 117.9 | (21.3) | ||
* Details on performance for the Program Activity expected results will be provided in section 2.
**This was a one-time study that does not allow for trend analysis.
| Strategic Outcome 2: An innovative economy | ||||||
| Performance Indicators | Result | Trend | ||||
| Government expenditure on research and development (R&D) | Since 2002, government expenditures on R&D have remained steady at 18 percent of Gross Domestic Expenditure on R&D (GERD).4 | No Change | ||||
| GERD as a percentage of Gross Domestic Product (GDP) | Since 2001, GERD has accounted for approximately 2 percent of GDP.5 | No Change | ||||
| University–Industry collaboration in R&D | Since 2005, the business sector has funded over $800 million/year of higher education R&D, accounting for more than 8 percent of total R&D performed by universities.6 | No Change | ||||
|
Alignment to Government of Canada Outcomes An Innovative and Knowledge-Based Economy Highlight of Achievements against Priorities
|
||||||
| Program Activity | Expected Results | Planned Spending ($ millions) |
Total Authorities ($ millions) |
Actual Spending ($ millions) |
||
| 2007–08 | 2007–08 | 2007–08 | ||||
| Policy Sector – S&T and Innovation | Development and coordination of policy frameworks in support of an innovative economy | 52.6 | 148.9 | 148.8 | ||
| Industry Sector – S&T and Innovation | Innovative Canadian industries | 11.8 | 24.1 | 19.4 | ||
| SITT Sector – S&T and Innovation | Improved research capacity and commercialization of information and communications technologies (ICTs) | 27.0 | 18.2 | 15.1 | ||
| Communications Research Centre – S&T and Innovation | Telecommunications policies, regulations and standards are developed using CRC technical input Canadian companies in the telecommunications sector use CRC-developed technology to improve their product lines and their competitiveness |
41.5 | 45.0 | 42.9 | ||
| Technology Partnerships Canada – S&T and Innovation | Commercialization encouraged through strategic partnering in innovative research and development | 397.3 | 475.5 | 431.8 | ||
| Strategic Outcome 3: Competitive industry and sustainable communities | ||||||
| Performance Indicators | Result | Trend | ||||
| Investment in machinery and equipment as a proportion of GDP | Canada invested 7.47 percent of GDP in machinery and equipment in 2007.7 | No Change | ||||
| Use of information and communications technologies (ICTs) | Business and government use of ICTs rose to 77.5 percent and 99.88 percent respectively in 2008.8 | Improving | ||||
|
Alignment to Government of Canada Outcomes Strong Economic Growth Highlight of Achievements against Priorities
|
||||||
| Program Activity | Expected Results | Planned Spending ($ millions) |
Total Authorities ($ millions) |
Actual Spending ($ millions) |
||
| 2007–08 | 2007–08 | 2007–08 | ||||
| Policy Sector – Economic Development | Development and coordination of policy frameworks that support competitive industry and sustainable communities | 11.2 | 12.1 | 11.7 | ||
| Operations Sector – Economic Development | Improved access to capital and information for small and medium-sized enterprises (SMEs) and communities targeted by Operations Sector | 282.7 | 333.6 | 292.2 | ||
| Industry Sector – Economic Development | Competitive and sustainable Canadian industries | 68.6 | 180.2 | 168.6 | ||
| SITT Sector – Economic Development | Canadians and communities overcoming barriers to, and gaining access to, modern ICT infrastructure Canadian ICT companies positioned for growth in the global marketplace |
44.8 | 50.7 | 50.1 | ||
| Management Priorities | |
| Priority | Progress in 2007–08 |
| Strengthening our compliance with the Federal Accountability Act |
|
| Refining the integrated Human Resources and Business Planning |
|
| Continued implementation of Human Resource Modernization Initiatives |
|
| Further developing a strong Stewardship Framework |
|
| Strengthening of Section 41, Official Languages Act |
|
| Maximizing Information Management and Information Governance and Responsibilities at Industry Canada |
|
Risk Analysis
Industry Canada’s capacity to achieve its strategic outcomes depends on its ability to identify, manage and mitigate department-wide risks. Industry Canada continued to make progress in 2007–08 to advance integrated risk management. Specifically, the Department addressed the Management Accountability Framework (MAF) results by developing a departmental risk management framework and a corporate risk profile. The risk management framework sets the context and provides a common approach to managing risk proactively, and ensures key risks pertaining to the Department’s policy, regulatory, program, and corporate activities are identified, mitigated and communicated. An important component of the risk management framework is the identification of roles and responsibilities for all employees. The corporate risk profile was based on an external and internal scan, a review of the Department’s MAF results, and a departmental risk rating process. The results were presented, discussed and communicated at key departmental committees. Monitoring and reporting of risk management is performed via existing governance structure and stewardship mechanisms (e.g., Management Committee and Departmental Audit Committee).
Industry Canada is addressing the following corporate risks:
People — recruitment, learning and development, retention of employees and the Public Service Renewal initiative as a government priority. Industry Canada is a knowledge-based organization, and the Department’s success depends on attracting and developing a talented and committed workforce. Given the rapidly growing number of employees eligible to retire, and competitive labour market conditions, Industry Canada will continue to invest in its people by providing challenging work and supporting ongoing learning and professional development. Industry Canada’s 2008–09 Business Plan, which integrates human resources and the business outcomes, provides details of the Department’s workforce renewal initiatives.
Performance Measurement, Monitoring and Reporting — performance measurement and quality of reporting to Parliament are discussed in the Lessons Learned box under Strategic Outcome 2.
Information Management (IM) — continued implementation of a sustainable departmental information management program. A mandate and corporate governance structure for IM were established under a senior executive with clear accountability.
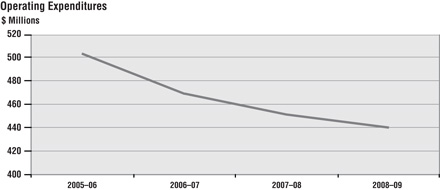
Expenditure Profile
Industry Canada’s total actual spending for 2007–08 was $1.36 billion. This represents a 13-percent increase from 2006–07 spending, which was primarily due to an increase in grants and contribution programs, including $105 million for seven Centres of Excellence, $58 million for the Program for Strategic Industrial Projects (PSIP), $10.5 million for the Strategic Aerospace and Defence Initiative (SADI) and $10.5 million for the Perimeter Institute.
Over the past three years Industry Canada has delivered a planned reduction in operating expenditures while delivering benefits to Canadians. This has been achieved through a number of spending restraint measures, with a particular focus on travel and professional services. Additionally, Industry Canada has strengthened information technology management practices while containing costs.
Voted and Statutory Items*
This table illustrates the way in which Parliament approved Industry Canada’s resources, and shows the changes in resources derived from supplementary estimates and other authorities, as well as how funds were spent.
| Vote # or Statutory Item (S) | Truncated Vote or Statutory Wording | 2007–08 ($ millions) | |||
| Main Estimates |
Planned Spending |
Total Authorities |
Actual Spending |
||
| 1 | Operating Expenditures | 345.3 | 361.3 | 427.3 | 403.9 |
| 5 | Capital Expenditures | 9.0 | 10.3 | 18.2 | 16.7 |
| 10 | Grants and Contributions | 488.3 | 615.4 | 760.8 | 664.7 |
| (S) | Minister of Industry – Salary and Motor Car Allowance | 0.1 | – | 0.1 | 0.1 |
| (S) | Canadian Intellectual Property Office Revolving Fund | 1.0 | 1.0 | 117.9 | (21.3) |
| (S) | Liabilities under the Small Business Loans Act | 1.8 | 1.8 | 1.4 | 1.4 |
| (S) | Liabilities under the Canada Small Business Financing Act | 92.0 | 92.0 | 100.3 | 100.3 |
| (S) | Transfer payments in connection with the Budget Implementation Act, 2007 | – | – | 25.5 | 25.5 |
| (S) | Contributions to employee benefit plans | 57.8 | 57.8 | 57.0 | 57.0 |
| (S) | Spending of proceeds from the disposal of surplus Crown Assets | – | – | 0.6 | 0.2 |
| (S) | Liabilities on loan guarantee payments pursuant to paragraph 14 (1) of the Department of Industry Act | – | – | 108.4 | 108.4 |
| (S) | Grant to Genome Canada | – | – | 6.7 | 6.7 |
| Total Budgetary | 995.3 | 1,139.6 | 1,624.5 | 1,363.9 | |
| L15 | Payments pursuant to subsection 14 (2) of the Department of Industry Act | 0.3 | 0.3 | 0.3 | – |
| L20 | Loan pursuant to paragraph 14 (1) (a) of the Department of Industry Act | 0.5 | 0.5 | 0.5 | – |
| L97b | Advances to regional offices and employees posted abroad. Appropriation Act No. 1 1970. Limit $1,950,000 (Net) | – | – | 2.0 | – |
| Total Non-Budgetary | 0.8 | 0.8 | 2.8 | – | |
| Total Department | 996.1 | 1,140.4 | 1,627.3 | 1,363.9 | |
*Minor differences are due to rounding.
Human Resources
| Human Resources 2007–08 |
Planned | Actual | Difference |
| Full-Time Equivalents (FTEs) | 6,055 | 5,422 | 633 |
Compared with the 2006–07 Departmental Performance Report, Industry Canada decreased in actual Full-Time Equivalents (FTEs) from 5,521 to 5,422 for 2007–08, a difference of 99 FTEs. This is primarily due to various factors, which include:
- Productivity gains in mature sectors allowing Industry Canada to streamline its regions.
- The transfer of resources to Indian and Northern Affairs Canada (INAC) following the transfer of responsibilities for the Aboriginal Business Canada (ABC) program (as noted in the Machinery of Government Changes section above).
1The National Science Advisor retired on March 31, 2008. The activities mandated to the National Science Advisor were assumed by the Science, Technology and Innovation Council (STIC), the Department of Industry and other parts of the government as appropriate.
2Conference Board of Canada, Death by a Thousand Paper Cuts: The Effects of Barriers to Competition on Canadian Productivity, May 2006, p. 24.
3IMD World Competitiveness Yearbook 2007
4Statistics Canada, Domestic Spending on Research and Development (GERD)
6www.conferenceboard.ca/documents.asp?rnext=2047
7http://www40.statcan.ca/l01/cst01/busi02a.htm
8Statistics Canada, Business and Government Use of Information and Communications Technologies