ARCHIVED - Industry Canada
 This page has been archived.
Archived Content
Information identified as archived on the Web is for reference, research or recordkeeping purposes. It has not been altered or updated after the date of archiving. Web pages that are archived on the Web are not subject to the Government of Canada Web Standards. As per the Communications Policy of the Government of Canada, you can request alternate formats on the "Contact Us" page.
2007-08
Departmental Performance Report
Industry Canada
The original version was signed by
The Honourable Tony Clement
Minister of Industry
Table of Contents
Section 1: Overview of the Department
1.1 Summary Information
1.2 Summary of Performance
Section 2: Analysis of Program Activities by Strategic Outcome
A Fair, Efficient and Competitive Marketplace
Policy Sector – Marketplace
Operations Sector – Marketplace
Spectrum, Information Technologies and Telecommunications (SITT) Sector – Marketplace
Office of Consumer Affairs – Marketplace
Competition Bureau – Marketplace
Canadian Intellectual Property Office – Marketplace
An Innovative Economy
Policy Sector – Science and Technology (S&T) and Innovation
Industry Sector – S&T and Innovation
SITT Sector – S&T and Innovation
Communications Research Centre Canada – S&T and Innovation
Technology Partnerships Canada – S&T and Innovation
Competitive Industry and Sustainable Communities
Policy Sector – Economic Development
Operations Sector – Economic Development
Industry Sector – Economic Development
SITT Sector – Economic Development
Section 3: Supplementary Information
3.1 Financial Highlights
3.2 List of Tables
Results Information for Program Activities by Strategic Outcome
A fair, efficient and competitive marketplace
An innovative economy
Competitive industry and sustainable communities
Results Information for Sub-Program and Sub-Sub-Program Activities by Strategic Outcome
A fair, efficient and competitive marketplace
An innovative economy
Competitive industry and sustainable communities
Minister’s Message

The Industry Portfolio experienced a busy and successful 2007–2008. As Minister of Industry, I am pleased with the progress made on our mission to foster a competitive, knowledge-based economy that benefits all Canadians.
A competitive economy is one that provides jobs and opportunity to Canadians, and top-quality products and services to consumers. Our economic performance underpins the quality of life we enjoy in this country, and the Department is making important contributions to this mission.
The Industry Portfolio is composed of Industry Canada and 10 other agencies, Crown corporations and quasijudicial bodies. These organizations collectively advance Canada’s industrial, scientific and economic development, and help ensure that we remain competitive in the global marketplace.
As a country, we must remain focused on how we can continue to provide an innovative and entrepreneurial economic environment, help our businesses capitalize on opportunities, and provide choice and quality to consumers. The global marketplace continues to evolve, changing with it the dynamics that influence Canada’s performance. I am proud to say that the Industry Portfolio is playing its part:
- We are working to make our market for wireless services more competitive, this year launching the policy framework for the Advanced Wireless Services spectrum auction. The framework aims to provide more choice and better service for consumers and businesses — something that we believe will also lead to lower prices.
- We issued guidelines clarifying the application of the Investment Canada Act as it relates to foreign state-owned enterprises investing in our country to ensure that Canadians continue to enjoy all the benefits that foreign investment delivers.
- We instituted an independent Competition Policy Review Panel to review and report on key elements of Canada’s competition and investment policies and to ensure that they are working to the full benefit of Canadians.
- We created an Automotive Innovation Fund to provide support to automotive firms undertaking large-scale, strategic research and development (R&D) projects to build innovative, greener and more fuel-efficient vehicles. Similarly, investments made through the Strategic Aerospace and Defence Initiative continue to encourage strategic R&D that will result in innovation and excellence in new products and services.
One of my key priorities as Industry Minister continues to be our country’s science and technology (S&T) strategy, Mobilizing Science and Technology to Canada’s Advantage, announced by Prime Minister Harper in May 2007.
- Budget 2008 included measures and initiatives in support of our S&T Strategy that total $654 million over the next three years.
- We put in place the new Science, Technology and Innovation Council to provide the government with objective policy advice on Canada’s S&T issues.
- The government allocated $105 million in 2007–2008 to support the operations of seven new Centres of Excellence, pilot projects that have the potential to make Canada a global leader in fields of research that offer a strategic opportunity for Canadian industry.
- This past March, Canada’s two-armed robot, Dextre, was successfully installed on the International Space Station.
The Department is also working to maximize opportunities for Canadian firms to succeed:
- Through the Industrial and Regional Benefits Policy, we secured over $1.6 billion in commitments from major global contractors, which will result in huge opportunities for Canadian firms.
- We extended BizPaL, an online service that simplifies the business permit and licensing process, into seven provinces and territories, and we continue to reduce red tape through our Paperwork Burden Reduction Initiative.
This has been a year of progress and success, and it is my pleasure to present Industry Canada’s Departmental Performance Report for 2007–2008. I am committed to building on these successes in 2008 and beyond, and I will continue to work with officials in the Industry Portfolio to make Canada more efficient, productive and competitive, expanding opportunity for our firms and providing benefits to consumers.
Tony Clement
Minister of Industry
Section 1: Overview of the Department
1.1 Summary Information
Raison d’�tre
- Provides more and better-paying jobs for Canadians
- Supports stronger economic growth through continued improvements in productivity and innovation performance
- Gives businesses, consumers and investors confidence that the marketplace is fair, efficient and competitive
- Integrates the economic, environmental and social interests of Canadians
Responsibilities
The Minister of Industry is responsible for carrying out Industry Canada’s mandate through the Department as well as the Industry Portfolio. The Minister has jurisdiction over policy issues relating to industry; trade and commerce; science; consumer affairs; corporations and corporate securities; competition and restraint of trade, including mergers and monopolies; bankruptcy and insolvency; intellectual property; telecommunications; investment; small businesses; and regional economic development for Ontario.
The Deputy Minister and Senior Associate Deputy Minister are accountable for the stewardship of Industry Canada. They provide strategic direction and sound management, so that the Department effectively contributes to achieving the government’s priorities and its wide range of activities is well coordinated and produces concrete results.
From an operational point of view, Industry Canada’s governance structure is functionally expressed through its committee structure. The governance structure exists within the Department at both the working and senior management levels, and the committees provide oversight and decision-making authority in a number of areas, including policy, procurement and contracting.
Industry Canada has a number of senior management committees that work to support senior executives and, ultimately, the Minister. These committees enable the development and delivery of policies and programs and oversee the management of the complex departmental machinery. The committee structure is traditional in nature — divided among operations (Management Committee and Executive Committee), policy (Deputy Ministers’ Policy Table) and independent oversight (Departmental Audit Committee). These committees support the Deputy Minister and the Senior Associate Deputy Minister in fulfilling their management responsibilities for the Department. This structure provides strategic direction and oversight, which facilitate the achievement of the Department’s three strategic outcomes.
Organizational Changes within Industry Canada
The Department’s organizational chart reflects a number of organizational changes that occurred in 2007–08 and are outlined in further detail below. It is important to note that this year’s performance report is based on the Department’s Program Activity Architecture (PAA). Given the timing of these changes, they were not reflected in the 2007–08 PAA and are therefore not reflected in this year’s performance report.
The organizational changes include the following:
- Operations Sector: The previous Operations Sector was split into the Small Business and Marketplace Services Sector and the Regional Operations Sector following a realignment of Industry Canada’s operational agenda.
- Policy Sector: The Policy Sector was split to create a more focused Strategic Policy Sector and a new Science and Innovation Sector with better focus on innovation in its broadest term.
- Security and Prosperity Partnership of North America (SPP): Following the North American Leaders Summit in Montebello, Quebec, in August 2007, the Minister of Industry was designated as the lead Minister for SPP, a trilateral means through which Canada engages in dialogue, priority-setting, collaboration and action with its North American counterparts to improve the security, prosperity and quality of life of North Americans. In this capacity, Industry Canada will support the Minister in working closely with his Canadian colleagues, and his United States and Mexican counterparts, to identify and advance initiatives within the five priority areas: Enhancing the Global Competitiveness of North America; Safe Food and Products; Sustainable Energy and Environment; Smart and Secure Borders; and Emergency Management and Preparedness.
- Technology Partnerships Canada (TPC): In February 2007, Industry Canada’s Technology Partnerships Canada (TPC) was renamed the Industrial Technologies Office (ITO), the Special Operating Agency with the mandate to manage both the Strategic Aerospace and Defence Initiative (SADI) and projects previously contracted through the TPC program. SADI was not announced until April 2, 2007, and as a result was not reported in the 2007–08 Report on Plans and Priorities (RPP).
Machinery of Government Changes
In 2007–08 the following machinery of government changes impacted Industry Canada:
Aboriginal Business Canada (ABC) — ABC was transferred from Industry Canada to Indian and Northern Affairs Canada (INAC) as of December 2006. Given that the change occurred late in the fiscal year, the Main Estimates for 2007–08 did not reflect the transfer. For this reason, the financial and human resources related to ABC were included in Industry Canada’s 2007–08 RPP, but are not reported against in this DPR. The transfer was reported, however, in the 2007–08 Supplementary Estimates and is reflected in the 2008–09 Annual Reference Level Update.
Mackenzie Gas Project (MGP) — The MGP was transferred from Indian and Northern Affairs Canada (INAC) to Industry Canada on December 10, 2007. The MGP is a proposed 1,220-kilometre natural gas pipeline system through the Mackenzie Valley in the Northwest Territories that will connect northern onshore gas fields with North American markets and has the potential to make key contributions to Canada’s role as an energy superpower. Given that the process of transferring the funding from INAC to Industry Canada will be completed in 2008–09, additional performance reporting will be provided in subsequent DPRs.
National Science Advisor (NSA)1 — The NSA was transferred from the Privy Council Office (PCO) to Industry Canada as of May 2006. Due to the timing of this transfer, the NSA was not reflected in the 2007–08 Program Activity Architecture on which the RPP and this DPR are based. In the interim, the financial and human resources associated with the NSA are included with Corporate Services, and the resources are divided across all programs and services.
Strategic Outcomes
In order to effectively pursue its mandate, Industry Canada aims to achieve the following three strategic outcomes.
- A fair, efficient and competitive marketplace
- An innovative economy
- Competitive industry and sustainable communities
The strategic outcomes are depicted in the following diagram:
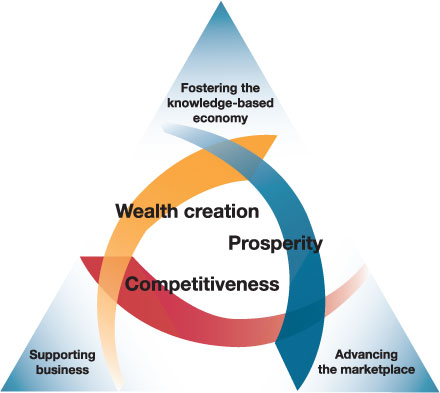
A fair, efficient and competitive marketplace
- By advancing the marketplace, we are developing and administering economic framework policies that promote innovation and competition and instill business, investor and consumer confidence.
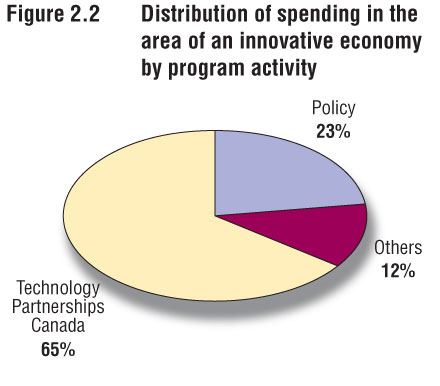
An innovative economy
- By fostering the knowledge-based economy, we support foundational investments in science and technology to create new knowledge and equip Canadians with the skills and training they need to compete in the global knowledge-based economy.
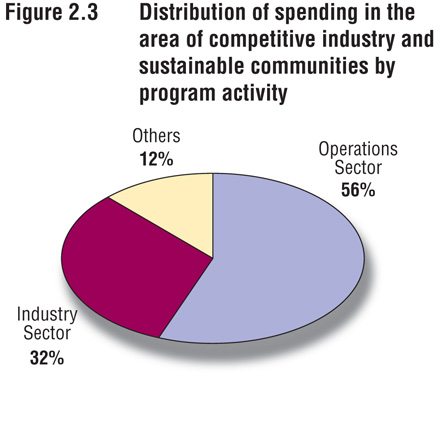
Competitive industry and sustainable communities
- By supporting business we anchor and support business innovation and productivity, because businesses are the organizations that create wealth and generate jobs.
Program Activity Architecture
The chart below illustrates Industry Canada’s complete framework of program activities and sub-activities, which feed into and contribute to progress toward the Department’s three Strategic Outcomes.
 Industry Canada – Program Activity Architecture
|
Strategic Outcomes |
||
| A fair, efficient and competitive marketplace | An innovative economy |
Competitive industry and sustainable communities |
|
Program Activities |
||
| Policy Sector – Marketplace | Policy Sector – Science & Technology (S&T) and Innovation | Policy Sector – Economic Development |
|
Sub-Activities
|
Sub-Activities
|
Sub-Activities
|
|
Operations Sector – Marketplace |
Industry Sector – S&T and Innovation |
Operations Sector – Economic Development |
|
Sub-Activities
|
Sub-Activities
|
Sub-Activities
|
|
Spectrum, Information Technologies and Telecommunications Sector – Marketplace |
Spectrum, Information Technologies and Telecommunications Sector – S&T and Innovation |
Industry Sector – Economic Development |
|
Sub-Activities
|
Sub-Activities
|
Sub-Activities
|
|
Office of Consumer Affairs (OCA) |
Communications Research Centre Canada (CRC) |
Spectrum, Information Technologies and Telecommunications Sector – Economic Development |
|
Sub-Activities
|
Sub-Activities
|
Sub-Activities
|
|
Competition Bureau – Marketplace |
Technology Partnerships Canada (TPC) |
|
|
Sub-Activities
|
Sub-Activities
|
|
|
Canadian Intellectual Property Office |
||
| ($ millions) | 2005–06 Actual |
2006–07 Actual |
2007–08 | |||
|---|---|---|---|---|---|---|
| Main Estimates |
Planned Spending |
Total Authorities |
Total Actuals |
|||
| A Fair, Efficient and Competitive Marketplace | ||||||
| Policy Sector – Marketplace | 7.2 | 6.2 | 9.1 | 9.1 | 12.1 | 10.7 |
| Operations Sector – Marketplace | 110.2 | 86.5 | 85.1 | 91.7 | 90.9 | 82.4 |
| Spectrum, Information Technologies and Telecommunications Sector – Marketplace | 73.4 | 67.0 | 49.4 | 50.1 | 61.4 | 58.7 |
| Chief Information Office Sector – Marketplace1 | 0.6 | – | – | – | – | – |
| Office of Consumer Affairs | 5.6 | 5.9 | 5.3 | 5.3 | 6.6 | 6.4 |
| Competition Bureau | 55.7 | 42.1 | 38.7 | 45.7 | 47.4 | 46.4 |
| Canadian Intellectual Property Office (CIPO) Revolving Fund | (27.6) | (28.5) | 1.0 | 1.0 | 117.9 | (21.3) |
| Subtotal | 225.2 | 179.3 | 188.7 | 203.0 | 336.4 | 183.4 |
| An Innovative Economy | ||||||
| Policy Sector – S&T and Innovation | 42.2 | 10.6 | 10.2 | 52.6 | 148.9 | 148.8 |
| Industry Sector – S&T and Innovation | 172.5 | 4.9 | 10.0 | 11.8 | 24.1 | 19.4 |
| Spectrum, Information Technologies and Telecommunications Sector – S&T and Innovation | 20.8 | 24.1 | 3.0 | 27.0 | 18.2 | 15.1 |
| Communications Research Centre Canada | 56.5 | 50.6 | 41.5 | 41.5 | 45.0 | 42.9 |
| Technology Partnerships Canada | 473.7 | 409.9 | 331.0 | 397.3 | 475.5 | 431.8 |
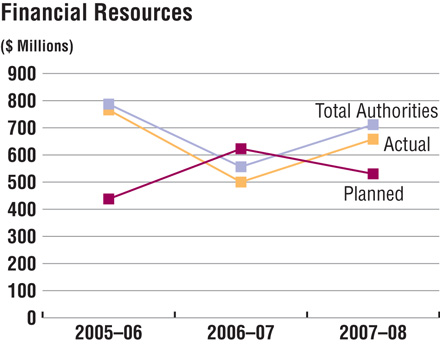
| Subtotal | 765.7 | 500.1 | 395.7 | 530.2 | 711.7 | 658.0 |
| Competitive Industry and Sustainable Communities | ||||||
| Policy Sector – Economic Development | 27.2 | 12.2 | 11.2 | 11.2 | 12.1 | 11.7 |
| Operations Sector – Economic Development | 377.4 | 352.8 | 318.6 | 282.7 | 333.6 | 292.2 |
| Industry Sector – Economic Development | 83.0 | 68.4 | 67.7 | 68.6 | 180.2 | 168.6 |
| Spectrum, Information Technologies and Telecommunications Sector – Economic Development | 119.6 | 76.9 | 13.5 | 44.8 | 50.7 | 50.1 |
| Chief Information Office Sector – Economic Development1 | 18.9 | – | – | – | – | – |
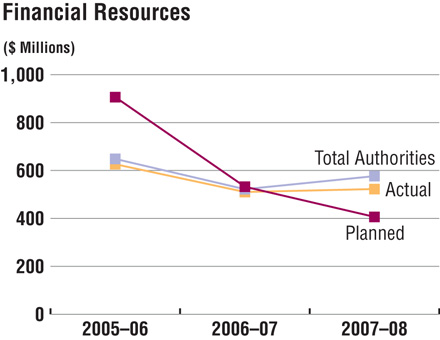
| Subtotal | 626.2 | 510.3 | 411.0 | 406.4 | 576.5 | 522.6 |
| Budgetary Main Estimates | 1,617.0 | 1,189.6 | 995.3 | 1,139.6 | 1,624.5 | 1,363.9 |
| Non-Budgetary Main Estimates | – | – | 0.8 | 0.8 | 2.8 | – |
| Total | 1,617.0 | 1,189.6 | 996.1 | 1,140.4 | 1,627.3 | 1,363.9 |
| Less: Non-respendable revenue2 | (485.4) | (522.3) | N/A | (456.3) | N/A | (569.2) |
| Plus: Cost of services received without charge2 | 79.8 | 84.8 | N/A | 78.2 | N/A | 84.5 |
| Net Cost of Department | 1,211.4 | 752.2 | 996.1 | 762.3 | 1,627.3 | 879.2 |
| Full-Time Equivalents | 5,683 | 5,521 | N/A | 6,055 | N/A | 5,392 |
*Minor differences are due to rounding.
1Chief Information Office Sector is now part of Internal Services and is no longer displayed separately, starting in 2006–07, figures were provided for 2005–06 only.
2Non-respendable revenue and services received without charge are not included in the Main Estimates or Total Authorities of the Department.
1.2 Summary of Performance*
| Strategic Outcome 1: A fair, efficient and competitive marketplace | ||||||
| Performance Indicators | Result | Trend | ||||
| Barriers to competition | Standards and regulations were identified as the most common barriers to competition in a survey of Canadian companies.2 | No Change** | ||||
| Regulatory and administrative capacity | Canada remains 2nd in the world on the number of days it takes to start a business. It takes only 3 days to start a business in Canada.3 | No Change | ||||
|
Alignment to Government of Canada Outcomes A Fair and Secure Marketplace Highlight of Achievements against Priorities
|
||||||
| Program Activity | Expected Results | Planned Spending ($ millions) |
Total Authorities ($ millions) |
Actual Spending ($ millions) |
||
| 2007–08 | 2007–08 | 2007–08 | ||||
| Policy Sector – Marketplace | Development and coordination of policy frameworks that support a fair, efficient and competitive marketplace | 9.1 | 12.1 | 10.7 | ||
| Operations Sector – Marketplace | Marketplace fairness, integrity and efficiency is protected through regulation and promotion in the areas of insolvency, weights and measures, federal incorporation, and spectrum management | 91.7 | 90.9 | 82.4 | ||
| Spectrum, Information Technologies and Telecommunications (SITT) Sector – Marketplace | A policy and regulatory framework to govern Canada’s radiocommunications and telecommunications infrastructure in support of Canadian marketplace requirements and shape the digital economy | 50.1 | 61.4 | 58.7 | ||
| Office of Consumer Affairs – Marketplace | Strengthened responses to consumer issues | 5.3 | 6.6 | 6.4 | ||
| Competition Bureau – Marketplace | Increased compliance with legislation under the Competition Bureau’s jurisdiction | 45.7 | 47.4 | 46.4 | ||
| Canadian Intellectual Property Office – Marketplace | Deliver quality and timely intellectual property products and services Increase awareness and use of intellectual property |
1.0 | 117.9 | (21.3) | ||
* Details on performance for the Program Activity expected results will be provided in section 2.
**This was a one-time study that does not allow for trend analysis.
| Strategic Outcome 2: An innovative economy | ||||||
| Performance Indicators | Result | Trend | ||||
| Government expenditure on research and development (R&D) | Since 2002, government expenditures on R&D have remained steady at 18 percent of Gross Domestic Expenditure on R&D (GERD).4 | No Change | ||||
| GERD as a percentage of Gross Domestic Product (GDP) | Since 2001, GERD has accounted for approximately 2 percent of GDP.5 | No Change | ||||
| University–Industry collaboration in R&D | Since 2005, the business sector has funded over $800 million/year of higher education R&D, accounting for more than 8 percent of total R&D performed by universities.6 | No Change | ||||
|
Alignment to Government of Canada Outcomes An Innovative and Knowledge-Based Economy Highlight of Achievements against Priorities
|
||||||
| Program Activity | Expected Results | Planned Spending ($ millions) |
Total Authorities ($ millions) |
Actual Spending ($ millions) |
||
| 2007–08 | 2007–08 | 2007–08 | ||||
| Policy Sector – S&T and Innovation | Development and coordination of policy frameworks in support of an innovative economy | 52.6 | 148.9 | 148.8 | ||
| Industry Sector – S&T and Innovation | Innovative Canadian industries | 11.8 | 24.1 | 19.4 | ||
| SITT Sector – S&T and Innovation | Improved research capacity and commercialization of information and communications technologies (ICTs) | 27.0 | 18.2 | 15.1 | ||
| Communications Research Centre – S&T and Innovation | Telecommunications policies, regulations and standards are developed using CRC technical input Canadian companies in the telecommunications sector use CRC-developed technology to improve their product lines and their competitiveness |
41.5 | 45.0 | 42.9 | ||
| Technology Partnerships Canada – S&T and Innovation | Commercialization encouraged through strategic partnering in innovative research and development | 397.3 | 475.5 | 431.8 | ||
| Strategic Outcome 3: Competitive industry and sustainable communities | ||||||
| Performance Indicators | Result | Trend | ||||
| Investment in machinery and equipment as a proportion of GDP | Canada invested 7.47 percent of GDP in machinery and equipment in 2007.7 | No Change | ||||
| Use of information and communications technologies (ICTs) | Business and government use of ICTs rose to 77.5 percent and 99.88 percent respectively in 2008.8 | Improving | ||||
|
Alignment to Government of Canada Outcomes Strong Economic Growth Highlight of Achievements against Priorities
|
||||||
| Program Activity | Expected Results | Planned Spending ($ millions) |
Total Authorities ($ millions) |
Actual Spending ($ millions) |
||
| 2007–08 | 2007–08 | 2007–08 | ||||
| Policy Sector – Economic Development | Development and coordination of policy frameworks that support competitive industry and sustainable communities | 11.2 | 12.1 | 11.7 | ||
| Operations Sector – Economic Development | Improved access to capital and information for small and medium-sized enterprises (SMEs) and communities targeted by Operations Sector | 282.7 | 333.6 | 292.2 | ||
| Industry Sector – Economic Development | Competitive and sustainable Canadian industries | 68.6 | 180.2 | 168.6 | ||
| SITT Sector – Economic Development | Canadians and communities overcoming barriers to, and gaining access to, modern ICT infrastructure Canadian ICT companies positioned for growth in the global marketplace |
44.8 | 50.7 | 50.1 | ||
| Management Priorities | |
| Priority | Progress in 2007–08 |
| Strengthening our compliance with the Federal Accountability Act |
|
| Refining the integrated Human Resources and Business Planning |
|
| Continued implementation of Human Resource Modernization Initiatives |
|
| Further developing a strong Stewardship Framework |
|
| Strengthening of Section 41, Official Languages Act |
|
| Maximizing Information Management and Information Governance and Responsibilities at Industry Canada |
|
Risk Analysis
Industry Canada’s capacity to achieve its strategic outcomes depends on its ability to identify, manage and mitigate department-wide risks. Industry Canada continued to make progress in 2007–08 to advance integrated risk management. Specifically, the Department addressed the Management Accountability Framework (MAF) results by developing a departmental risk management framework and a corporate risk profile. The risk management framework sets the context and provides a common approach to managing risk proactively, and ensures key risks pertaining to the Department’s policy, regulatory, program, and corporate activities are identified, mitigated and communicated. An important component of the risk management framework is the identification of roles and responsibilities for all employees. The corporate risk profile was based on an external and internal scan, a review of the Department’s MAF results, and a departmental risk rating process. The results were presented, discussed and communicated at key departmental committees. Monitoring and reporting of risk management is performed via existing governance structure and stewardship mechanisms (e.g., Management Committee and Departmental Audit Committee).
Industry Canada is addressing the following corporate risks:
People — recruitment, learning and development, retention of employees and the Public Service Renewal initiative as a government priority. Industry Canada is a knowledge-based organization, and the Department’s success depends on attracting and developing a talented and committed workforce. Given the rapidly growing number of employees eligible to retire, and competitive labour market conditions, Industry Canada will continue to invest in its people by providing challenging work and supporting ongoing learning and professional development. Industry Canada’s 2008–09 Business Plan, which integrates human resources and the business outcomes, provides details of the Department’s workforce renewal initiatives.
Performance Measurement, Monitoring and Reporting — performance measurement and quality of reporting to Parliament are discussed in the Lessons Learned box under Strategic Outcome 2.
Information Management (IM) — continued implementation of a sustainable departmental information management program. A mandate and corporate governance structure for IM were established under a senior executive with clear accountability.
Expenditure Profile
Industry Canada’s total actual spending for 2007–08 was $1.36 billion. This represents a 13-percent increase from 2006–07 spending, which was primarily due to an increase in grants and contribution programs, including $105 million for seven Centres of Excellence, $58 million for the Program for Strategic Industrial Projects (PSIP), $10.5 million for the Strategic Aerospace and Defence Initiative (SADI) and $10.5 million for the Perimeter Institute.
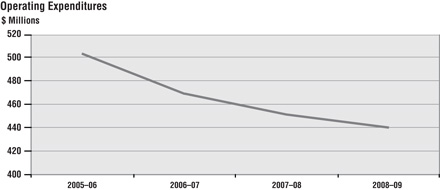
Over the past three years Industry Canada has delivered a planned reduction in operating expenditures while delivering benefits to Canadians. This has been achieved through a number of spending restraint measures, with a particular focus on travel and professional services. Additionally, Industry Canada has strengthened information technology management practices while containing costs.
Voted and Statutory Items*
This table illustrates the way in which Parliament approved Industry Canada’s resources, and shows the changes in resources derived from supplementary estimates and other authorities, as well as how funds were spent.
| Vote # or Statutory Item (S) | Truncated Vote or Statutory Wording | 2007–08 ($ millions) | |||
| Main Estimates |
Planned Spending |
Total Authorities |
Actual Spending |
||
| 1 | Operating Expenditures | 345.3 | 361.3 | 427.3 | 403.9 |
| 5 | Capital Expenditures | 9.0 | 10.3 | 18.2 | 16.7 |
| 10 | Grants and Contributions | 488.3 | 615.4 | 760.8 | 664.7 |
| (S) | Minister of Industry – Salary and Motor Car Allowance | 0.1 | – | 0.1 | 0.1 |
| (S) | Canadian Intellectual Property Office Revolving Fund | 1.0 | 1.0 | 117.9 | (21.3) |
| (S) | Liabilities under the Small Business Loans Act | 1.8 | 1.8 | 1.4 | 1.4 |
| (S) | Liabilities under the Canada Small Business Financing Act | 92.0 | 92.0 | 100.3 | 100.3 |
| (S) | Transfer payments in connection with the Budget Implementation Act, 2007 | – | – | 25.5 | 25.5 |
| (S) | Contributions to employee benefit plans | 57.8 | 57.8 | 57.0 | 57.0 |
| (S) | Spending of proceeds from the disposal of surplus Crown Assets | – | – | 0.6 | 0.2 |
| (S) | Liabilities on loan guarantee payments pursuant to paragraph 14 (1) of the Department of Industry Act | – | – | 108.4 | 108.4 |
| (S) | Grant to Genome Canada | – | – | 6.7 | 6.7 |
| Total Budgetary | 995.3 | 1,139.6 | 1,624.5 | 1,363.9 | |
| L15 | Payments pursuant to subsection 14 (2) of the Department of Industry Act | 0.3 | 0.3 | 0.3 | – |
| L20 | Loan pursuant to paragraph 14 (1) (a) of the Department of Industry Act | 0.5 | 0.5 | 0.5 | – |
| L97b | Advances to regional offices and employees posted abroad. Appropriation Act No. 1 1970. Limit $1,950,000 (Net) | – | – | 2.0 | – |
| Total Non-Budgetary | 0.8 | 0.8 | 2.8 | – | |
| Total Department | 996.1 | 1,140.4 | 1,627.3 | 1,363.9 | |
*Minor differences are due to rounding.
Human Resources
| Human Resources 2007–08 |
Planned | Actual | Difference |
| Full-Time Equivalents (FTEs) | 6,055 | 5,422 | 633 |
Compared with the 2006–07 Departmental Performance Report, Industry Canada decreased in actual Full-Time Equivalents (FTEs) from 5,521 to 5,422 for 2007–08, a difference of 99 FTEs. This is primarily due to various factors, which include:
- Productivity gains in mature sectors allowing Industry Canada to streamline its regions.
- The transfer of resources to Indian and Northern Affairs Canada (INAC) following the transfer of responsibilities for the Aboriginal Business Canada (ABC) program (as noted in the Machinery of Government Changes section above).
1The National Science Advisor retired on March 31, 2008. The activities mandated to the National Science Advisor were assumed by the Science, Technology and Innovation Council (STIC), the Department of Industry and other parts of the government as appropriate.
2Conference Board of Canada, Death by a Thousand Paper Cuts: The Effects of Barriers to Competition on Canadian Productivity, May 2006, p. 24.
3IMD World Competitiveness Yearbook 2007
4Statistics Canada, Domestic Spending on Research and Development (GERD)
6www.conferenceboard.ca/documents.asp?rnext=2047
7http://www40.statcan.ca/l01/cst01/busi02a.htm
8Statistics Canada, Business and Government Use of Information and Communications Technologies
Section 2: Analysis of Program Activities by Strategic Outcome
Strategic Outcome: A Fair, Efficient and Competitive Marketplace
| Indicator | Result | Trend |
| Barriers to competition | Standards and regulations were identified as the most common barriers to competition in a survey of Canadian companies.1 | No Change* |
| According to the International Institute for Management Development (IMD) World Competitiveness Yearbook 2007, Canada continues to rank within the top 10 countries in the world for overall competitiveness.2 | No Change | |
| Canada ranks 11th in the world for the extent to which government policies are conducive to competitiveness.3 | No Change | |
| Regulatory and administrative capacity | ||
| According to the International Institute for Management Development (IMD) World Competitiveness Yearbook 2007, Canada remains 2nd in the world on the number of days it takes to start a business (i.e., 3 days).4 | No Change | |
*This was a one-time study that does not allow for trend analysis.
 D
D
The Patent Prosecution Highway Pilot Program between the Canadian Intellectual Property Office and the United States Patent and Trademark Office was launched on January 28, 2008 to provide a means to significantly accelerate examination of patent applications and to improve patent quality.
Under the agreements, if claims of an application have been found to be acceptable by an intellectual property office in one country, an accelerated examination can be requested at the intellectual property office of the other country. The objective of the trial is to gauge the interest of applicants and to assess the anticipated benefits to each office.
Competitive markets enable business investment, innovation, productivity and growth, and are therefore essential to Canada’s long-term prosperity. Industry Canada works with other federal departments to create a business climate that is conducive to attracting and retaining investment, innovative industries, and talented workers. The department also develops policies that promote consumer confidence and are flexible and responsive to changing technologies, marketplace opportunities and an evolving global marketplace. By doing this, Industry Canada is helping to build a fair, efficient and competitive marketplace.
 D
D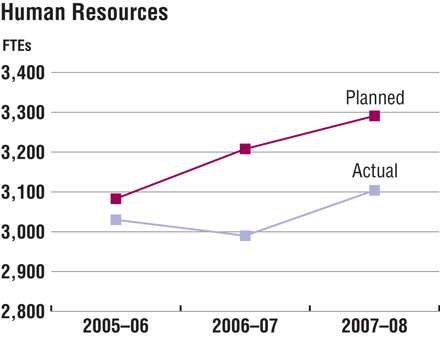 D
D
Meeting Our Commitments
In an effort to continue to modernize marketplace frameworks in support of a highly competitive and innovative economy for the benefit of all Canadians, Industry Canada:
- Made recommendations resulting in Bill C-47, The Olympic and Paralympics Marks Act, which provides special, limited-time intellectual property protection for Olympic and Paralympic words and symbols and prohibits “ambush marketing” — marketing that seeks to capitalize on the goodwill of the Olympic movement by creating a false, unauthorized association with the Games without making the financial investment required to secure official sponsorship rights. The Act received Royal Assent on June 22, 2007.
- Consulted with over 1,200 stakeholders by email and contacted 50 companies and associations directly, as part of the review of the Weights and Measures Act and Electricity and Gas Inspection Act and identified the need to modernize the offence sections to ensure fines provide appropriate deterrents and consumer protection.
- Continued to assist and support provinces as they seek Order-in-Council designations to regulate payday lending, under the provisions of Section 347.1 of the Criminal Code of Canada, thus providing greater protection for consumers under these high-cost loans.
- Issued the policy framework as well as the licensing framework for the Auction for Spectrum licences for Advanced Wireless Services (AWS) in the 2 GHz range.
- Completed a study on Canada’s self-regulated professions in December 2007. The study found that rules that limit advertising, set prices for services and restrict who can offer professional services may go further than necessary to protect the public interest and, in fact, can lead to higher prices, limited choices and restricted access to the type of information consumers need to make decisions.
Industry Canada carries out its mandate in a fast-paced environment of continually shifting priorities. The Department has responded to this environment by accelerating the implementation of some initiatives to meet tight deadlines and has learned that any failure to consult targeted stakeholders during accelerated initiatives results in the need to make modifications at a later date to ensure those stakeholders are well served. This is particularly true in the development of marketplace frameworks.
In response, Industry Canada has renewed its commitment to using a measured and focused approach to ensure that all stakeholder views are brought to the table prior to implementation. By following through on this commitment, Industry Canada will improve stakeholder satisfaction and reduce the number of modifications that are required.
Performance Analysis
Through the following program activities Industry Canada continued building a fair, efficient and competitive marketplace.
Program Activity Policy Sector – Marketplace
| Description: Development of marketplace framework policy | ||
| Expected Result: Development and coordination of policy frameworks that support a fair, efficient and competitive marketplace | ||
| Indicator | Results | Trend |
| Legislative initiatives tabled and approved, aimed at improving Canada’s broad marketplace framework (e.g., copyright, insolvency, intellectual property, competition policy) | As of March 31, 2008, two bills were tabled and adopted. One dealing with the protection of Olympic and Paralympic trademarks received royal assent and the second made amendments to the Bankruptcy and Insolvency Act. A report and a government response were tabled in Parliament.5,6 | Not Applicable* |
*The introduction and adoption of legislative initiatives are the prerogatives of government and Parliament.
| Financial Resources ($ millions) 2007–08 |
Human Resources (Full-Time Equivalents) 2007–08 |
|||||
| Planned Spending |
Total Authorities |
Actual Spending |
Planned | Actual | Difference | |
| 9.1 | 12.1 | 10.7 | 87 | 74 | 13 | |
In Advantage Canada, the Government of Canada committed to adopt a principle-based approach to address the concern that there may be rare occasions when foreign investments by state-owned enterprises (SOEs) might not benefit Canada. This concern was addressed when, on December 7, 2007, the Minister of Industry issued guidelines clarifying that sound principles of corporate governance and commercial orientation will drive how investments will be reviewed under the Investment Canada Act by foreign SOEs.
Program Activity Operations Sector – Marketplace
| Description: Development of instruments and compliance with the marketplace framework | ||
| Expected Result: Marketplace fairness, integrity and efficiency is protected through regulation and promotion in the areas of insolvency, weights and measures, federal incorporation, and spectrum management | ||
| Indicator | Result | Trend |
| Public confidence in federal incorporation regime | Satisfaction with overall quality of online service met 86.6 percent.7 | Improving |
| Financial Resources ($ millions) 2007–08 |
Human Resources (Full-Time Equivalents) 2007–08 |
|||||
| Planned Spending |
Total Authorities |
Actual Spending |
Planned | Actual | Difference | |
| 91.7 | 90.9 | 82.4 | 1,332 | 1,308 | 24 | |
By relieving the administrative and paperwork burden on business, Industry Canada is ensuring that marketplace fairness, integrity and efficiency is being protected and promoted. Two measures announced in Advantage Canada exemplify this. One is e-filing, which allows trustees to file prescribed documents, and another is Pre-Approved Schedules Service (PASS), which decreases turnaround time for incorporation (a total of 1,300 certificates of incorporation were received via this new initiative in 2007–08).
Program Activity Spectrum, Information Technologies and Telecommunications Sector – Marketplace
| Description: Development of regulations, policies, procedures and standards governing Canada’s spectrum and telecommunications industries and the digital economy | ||
| Expected Result: A policy and regulatory framework to govern Canada’s radiocommunications and telecommunications infrastructure in support of Canadian marketplace requirements and shape the digital economy | ||
| Indicator | Result | Trend |
| Degree of client satisfaction in the Canadian marketplace with the current policy and regulatory framework | Not Available A Client Satisfaction Survey is being developed and will be conducted in 2008–09. |
Not Available |
| Financial Resources ($ millions) 2007–08 |
Human Resources (Full-Time Equivalents) 2007–08 |
|||||
| Planned Spending |
Total Authorities |
Actual Spending |
Planned | Actual | Difference | |
| 50.1 | 61.4 | 58.7 | 366 | 333 | 33 | |
As the underlying infrastructure of Canada’s economic activity, telecommunications services are key to the Canadian economy. In 2007–08, Industry Canada worked with stakeholders to advance the government’s agenda for telecommunications reform, including accelerating deregulation in areas where there is competition, and created the Commissioner for Complaints for Telecommunications Services Inc.
Industry Canada also successfully negotiated all Canadian proposals at the International Telecommunication Union (ITU) World Radiocommunication Conference 2007. This has resulted in the allocation and safeguarding of radio spectrum in the International Radio Regulations, which is a treaty text, to support such things as new advanced mobile services, aeronautical safety, next-generation navigation and environmental monitoring systems, and disaster relief and mitigation.
Improving confidence in the marketplace by protecting individual privacy and curbing threats to the Internet and online market continued to be a priority for Industry Canada. Key actions included the continued mandatory review of the Personal Information Protection and Electronic Documents Act (PIPEDA) and the development of options for introducing new initiatives to combat spam.
Program Activity Office of Consumer Affairs – Marketplace
| Description: Promotion of consumer interests | ||
| Expected Result: Strengthened responses to consumer issues | ||
| Indicator | Result | Trend |
| Number of initiatives responding to consumer issues with active engagement of OCA | 33 initiatives responding to consumer issues with active engagement of OCA.8 | Improving |
| Financial Resources ($ millions) 2007–08 |
Human Resources (Full-Time Equivalents) 2007–08 |
|||||
| Planned Spending | Total Authorities | Actual Spending | Planned | Actual | Difference | |
| 5.3 | 6.6 | 6.4 | 23 | 23 | – | |
Industry Canada, through its Office of Consumer Affairs contributed to increasing consumer confidence and a more fair and efficient marketplace by actively engaging in initiatives to respond to consumer issues. These initiatives included several projects to support the harmonization of federal/provincial/territorial consumer policies, collaborating with international partners such as the Organisation for Economic Co-operation and Development (OECD) and the International Organization for Standardization (ISO) to advance the development of international consumer policy and consumer protection models, and providing strategic consumer research and consumer information products designed to meet consumer needs in the modern marketplace.
Program Activity Competition Bureau – Marketplace
| Description: Development of and compliance with marketplace frameworks with respect to competition | ||
| Expected Result: Increased compliance with legislation under the Competition Bureau’s jurisdiction | ||
| Indicator | Result | Trend |
| Volume of commerce affected by Competition Bureau criminal enforcement activity | $330 million | New Indicator |
| Financial Resources ($ millions) 2007–08 |
Human Resources (Full-Time Equivalents) 2007–08 |
|||||
| Planned Spending |
Total Authorities |
Actual Spending |
Planned | Actual | Difference | |
| 45.7 | 47.4 | 46.4 | 446 | 421 | 25 | |
Through the efforts of the Competition Bureau, the Department increased legislative compliance through a variety of activities in competition enforcement and advocacy, as well as fraud prevention and awareness.
These activities included strengthening enforcement capacity in regional offices by giving them the responsibility of local cartels with a strong emphasis on bid rigging. In addition, the Community of Federal Regulators recognized the Competition Bureau with an innovation award for its work on Project FairWeb, which enables the Competition Bureau to redesign work processes involved in intelligence gathering and Internet sweep exercises in a more systematic manner, yielding positive results.
Program Activity Canadian Intellectual Property Office – Marketplace
| Description: Granting of intellectual property rights and the dissemination of intellectual property information in order to accelerate Canada’s economic development | ||
| Expected Result: Deliver quality and timely intellectual property products and services | ||
| Indicator | Result | Trend |
Turnaround times9 for:
|
72 percent of applications with a request for examination are processed in less than 24 months. | Improving |
|
Applications are processed within 6.8 months of filing date. | Declining |
|
Applications are processed within 1.8 working days of the receipt of application. | Improving |
|
Applications are processed within 10 months of the receipt of application. | Improving |
| Expected Result: Increase awareness and use of intellectual property | ||
| Indicator | Result | Trend |
| Percentage of increased awareness and use of intellectual property | 36 percent are familiar with intellectual property (baseline).10 | No Change |
| Financial Resources ($ millions) 2007–08 |
Human Resources (Full-Time Equivalents) 2007–08 |
|||||
| Planned Spending |
Total Authorities |
Actual Spending* |
Planned | Actual | Difference | |
| 1.0 | 117.9 | (21.3) | 1,037 | 945 | 92 | |
*As a Special Operating Agency within Industry Canada with a revolving fund authority, the Canadian Intellectual Property Office finances its operations entirely from revenues generated by fees received from the provision of intellectual property services.
As a roadmap to achieve its vision of becoming a leading Intellectual Property Office (IPO) as well as to support the government’s efforts to increase innovative activity by Canadians, Industry Canada, through the Canadian Intellectual Property Office (CIPO) adopted a Five-Year Strategic Plan entitled Moving Forward to Canada’s Advantage focusing on five strategic directions. These are: client services, outreach, the intellectual property framework, international activities, and our people.
As a critical element to deliver its Strategic Plan, CIPO launched a business transformation initiative called Enterprise-Business Renewal (EBR), a portfolio of projects directed to transform the way CIPO does business by improving business processes, renewing systems, and expanding the range of electronic services. For outreach, CIPO continued to foster greater awareness and more effective use of intellectual property by reaching out to small and medium-sized enterprises (SMEs) and working closely with Canada’s education sector in line with the government’s priorities in science and technology.
Strategic Outcome: An Innovative Economy
| Indicator | Result | Trend |
| Government expenditure on research and development (R&D) | Since 2002, government expenditures on research and development have remained steady at 18 percent of GERD.11 | No Change |
| Gross Domestic Expenditure on R&D (GERD) as a percentage of Gross Domestic Product (GDP) | Since 2001, GERD has accounted for approximately 2 percent of GDP.12 | No Change |
| University–Industry collaboration in R&D | Since 2005, the business sector has funded over $800 million/year of higher education R&D, accounting for more than 8 percent of total R&D performed by universities.13 | No Change |
 D
D
Innovation — the transfer of knowledge to create new products or processes — is a key driver of growth and economic wealth in knowledge-based economies such as Canada.
In pursuit of a more innovative economy, Industry Canada is pursuing a strategy that invests in skilled knowledge workers, cutting-edge research and the adoption of new technologies. This support will encourage business, industry and the academic community to invest in innovation. Canadians will reap the benefits of medical advancements, a cleaner environment, improved education and employment opportunities.
The Government of Canada’s new S&T Strategy, Mobilizing Science and Technology to Canada’s Advantage, provides a multi-year policy framework to guide federal S&T policy and program decision-making.
The S&T Strategy sets out four core principles to guide government actions in this area: promote world-class excellence, focus on priorities, encourage partnerships and enhance accountability. The strategy also sets out three advantages distinct to S&T:
Entrepreneurial Advantage to translate knowledge into commercial applications that generate wealth for Canadians.
Knowledge Advantage to position Canada as a leader in generating new ideas and innovations.
People Advantage to make Canada a magnet for highly skilled people and create an economy with the best educated, most-skilled and most flexible workforce in the world.
Beginning in Budget 2007, the government launched a series of S&T initiatives to implement the S&T Strategy commitments and help position Canada as an R&D and innovation leader.
 D
D
The variance between the planned and actual spending for 2007–08 is a result of an increased grants and contributions program allocation made in the Federal 2008 Budget. Additional details are outlined below in the Meeting Our Commitments section.
 D
D
The decrease between the 2006–07 and 2007–08 actual Full-Time Equivalents (FTEs) is due to productivity gains in mature sectors allowing Industry Canada to streamline its regions.
Quality performance indicators are critical to properly assess a department’s work in achieving its strategic outcomes and program activities — a lesson Industry Canada learned in the assessment of the Technology Partnerships Canada Program and the design of the new Strategic Aerospace and Defence Initiative. The Department’s investment in the development of accurate and appropriate performance indicators ensures both programs will be properly assessed.
The Department’s experience in this area also led it to conduct a review of its planning and reporting infrastructure and to update its Program Activity Architecture to better define Industry Canada’s strategic outcomes and program activities. Treasury Board approved the new Program Activity Architecture for 2009–10 and the Department has started to develop performance measures that are aligned to the new Program Activity Architecture. The new planning and reporting structure will greatly assist Industry Canada in managing and communicating its performance to all stakeholders.
Meeting our Commitments
In 2007–08 Industry Canada, in delivering on its commitments to develop an innovative and knowledge-based economy, ensured the allocation of resources by:
- Developing evidence-based policy recommendations that contributed to two Federal 2008 Budget announcements: earmarking $75 million for the creation of a new Canadian Venture Capital fund, and changes to streamline processes related to eligible cross-border venture capital investment flows.
- Making key investments through Budget 2008 including $25 million over two years to establish the Vanier Canada Graduate Scholarships, $21 million over two years to establish the Canada Excellence Research Chairs, and $140 million to Genome Canada to build upon Canada's knowledge advantage in genomics.
- Acting as the administrator of the Program for Strategic Industrial Projects (PSIP), which provides the mechanism to fund, in whole or in part, strategic projects within the automotive sector.
Industry Canada also supported the generation and commercialization of knowledge by:
- Opening laboratories for photonics and antenna research at the Communications Research Centre Canada.
- Supporting cooperation activities between Canada, the United States and Mexico in the use of nanotechnology.
- Completing six Technology Roadmaps (TRM) that help industry, its supply-chain, academic and research groups and government come together to jointly identify and prioritize the technologies needed to support strategic research and development (R&D), marketing and investment decisions.
Performance Analysis
Through the following program activities Industry Canada continued to build an innovative economy.
Program Activity Policy Sector – S&T and Innovation
| Description: Development of economic and scientific policy | ||
| Expected Result: Development and coordination of policy frameworks in support of an innovative economy | ||
| Indicator | Result | Trend |
| Policy proposals that are brought forward reinforce the elements that advance an innovative economy and reflect a coordinated approach based on tools available across the sector | The federal S&T Strategy, Mobilizing Science and Technology to Canada’s Advantage, championed by Industry Canada to guide federal investments in S&T, was released in May 2007.14 | Not Applicable |
| Financial Resources ($ millions) 2007–08 |
Human Resources (Full-Time Equivalents) 2007–08 |
|||||
| Planned Spending |
Total Authorities |
Actual Spending |
Planned | Actual | Difference | |
| 52.6 | 148.9 | 148.8 | 114 | 85 | 29 | |
Recognizing that science and technology are key drivers that make Canada more productive and competitive and address social priorities, Industry Canada championed the development and implementation of the federal Science and Technology (S&T) Strategy, Mobilizing Science and Technology to Canada’s Advantage, released by the Prime Minister in May 2007.
This strategy focuses on advancing four core principles: promoting world-class excellence; focusing on priorities; fostering partnerships and enhancing accountability; and it fosters three key advantages of the Advantage Canada initiative: Entrepreneurial, Knowledge and People.
Program Activity Industry Sector – S&T and Innovation
| Description: Development of initiatives that stimulate research and development in order to accelerate commercialization in emerging technologies and priority sectors | ||
| Expected Result: A stronger knowledge-based economy in all industrial sectors | ||
| Indicator | Result | Trend |
Overall assessment of climate, programs, decisions and other major factors supporting innovation in Canadian industries, such as:
|
Scientists & engineers as a share of total employment: in Canada 10 percent,15 in U.S. 14.4 percent.16 | Improving |
| Financial Resources ($ millions) 2007–08 |
Human Resources (Full-Time Equivalents) 2007–08 |
|||||
| Planned Spending |
Total Authorities |
Actual Spending* |
Planned | Actual | Difference | |
| 11.8 | 24.1 | 19.4 | 123 | 79 | 44 | |
*The variance between the planned and actual spending for 2007–08 is due to two different factors. The Industry Sector transferred resources to the Economic Development program activity during 2007–08, and three grants were incorrectly coded to the Industry Sector’s S&T and Innovation program activity, which should have been coded to the Policy Sector – S&T and Innovation program activity.
Industry Canada completed a range of analyses, allowing government and industry to better identify and understand the challenges and opportunities surrounding emerging technology value chains in Canada in 2007–08. These included an analysis of opportunities for the development of new value chains that link the bio-resource, chemicals, and manufacturing sectors; facilitation of a strategic plan by the chemical cluster in Sarnia, to advance the adoption of underutilized agricultural and forest residues as renewable feedstock for production of chemicals, plastics, and fuels; the identification and assessment of opportunities for Canadian capabilities in hydrogen and fuel cells, waste-to-energy and solar power in the California market; and commissioning of a study, entitled Opportunities for Canadian Stakeholders in the North American Large Wind Turbine Supply Chain.
Program Activity Spectrum, Information Technologies and Telecommunications Sector – S&T and Innovation
| Description: Support advanced and applied research within the Canadian ICT Sector for the development of innovative technologies | ||
| Expected Result: Improved research capacity and commercialization of ICTs | ||
| Indicator | Result | Trend |
| Access to advanced research networks across Canada and the application of ICTs to industrial sectors | CANARIE Inc. improved access to advanced research networks across Canada by connecting 375 institutions. This is a 25-percent increase over the number of institutions connected in 2006–07. | Improving |
| Precarn Inc. supported 12 market-driven ICT project innovations in the areas of intelligent systems technologies and robotics. | Not Applicable | |
| Financial Resources ($ millions) 2007–08 |
Human Resources (Full-Time Equivalents) 2007–08 |
|||||
| Planned Spending |
Total Authorities |
Actual Spending |
Planned | Actual | Difference | |
| 27.0 | 18.2 | 15.1 | 4 | 4 | – | |
In 2007–08, Industry Canada continued to support the CANARIE Inc. objectives to expand and upgrade the advanced research network and to develop, demonstrate and implement next-generation technologies. This support helped pave the way to launch the Infrastructure Extensions Program and the Network-Enabled Platforms Program. In addition to this investment, Precarn Inc. funded 12 new technology projects across the country for a total of $4.4 million.
Program Activity Communications Research Centre Canada – S&T and Innovation
| Description: Conducts research on advanced telecommunications and information technologies to ensure an independent source of advice for public policy and to support the development of new products and services for the ICT Sector | ||
| Expected Result: Telecommunications policies, regulations and standards are developed using Communications Research Centre Canada (CRC) technical input | ||
| Indicator | Result | Trend |
| Number of CRC technical inputs (trends and assessments) to groups developing policies and regulations related to the telecommunications sector, including the Spectrum Information Technologies and Telecommunications Sector (SITT) of Industry Canada (IC), the International Telecommunication Union (ITU), the Institute of Electrical and Electronics Engineers (IEEE), and the Canadian Radio-television and Telecommunications Commission (CRTC) | 10 major technology-related inputs to Industry Canada, SITT, CRTC, ITU and IEEE.17 | New Indicator |
| Expected Result: Canadian companies in the telecommunications sector use CRC-developed technology to improve their product lines and their competitiveness |
||
| Indicator | Result | Trend |
| Number of intellectual property (IP) licences issued to Canadian companies | 11 new IP licences have been issued to Canadian companies in 2007–08 and an additional 23 internationally.18 | Improving* |
| Sales revenue of Canadian companies in the telecommunications sector that were formed as a result of CRC involvement or are spinoffs from these companies | $1.6 billion annual sales (data for 2005). $520 million cumulative sales revenue from CRC IP licensing (to 2005).19 ** |
Not Available |
* The numbers are very similar to those of last fiscal year, with only a very small upward trend.
** An economic impact study of company sales revenues resulting from CRC technologies and intellectual property licences is conducted every five years, with the next one scheduled for 2010.
| Financial Resources ($ millions) 2007–08 |
Human Resources (Full-Time Equivalents) 2007–08 |
|||||
| Planned Spending |
Total Authorities |
Actual Spending |
Planned | Actual | Difference | |
| 41.5 | 45.0 | 42.9 | 411 | 388 | 23 | |
Industry Canada, through the Communications Research Centre Canada (CRC), conducted research activities in support of spectrum policy and regulations in 2007–08. This included studies related to future Advanced Wireless Services, as well as on spectrum property rights. Input was also provided regarding the impact of emerging standards on licensing of rural broadband delivery systems.
In addition, Industry Canada carried out research projects in 2007–08 in support of the Department of National Defence (DND) valued at $7.38 million on a cost-recovery basis. Some of these projects included research into adaptive wireless systems for tactical mobile communications, as well as technical analysis and planning at the international level for the new constellation of search and rescue satellites.
Program Activity Technology Partnerships Canada – S&T and Innovation
| Description: Encouragement of commercialization through strategic investments in innovative research and development | ||
| Expected Result: Commercialization encouraged through strategic partnering in innovative research and development | ||
| Indicator | Result | Trend |
| Total number of projects (which represents the number of strategic partnerships)20 |
|
No Trend* |
*Trend information is unavailable as the Strategic Aerospace and Defence Initiative (SADI) program was launched in April 2007. TPC’s terms and conditions expired on December 31, 2006 and no new projects were contracted. The h2EA program ended on March 31, 2008.
| Financial Resources ($ millions) 2007–08 |
Human Resources (Full-Time Equivalents) 2007–08 |
|||||
| Planned Spending |
Total Authorities |
Actual Spending |
Planned | Actual | Difference | |
| 397.3 | 475.5 | 431.8 | 118 | 99 | 19 | |
In February 2008, the first Strategic Aerospace and Defence Initiative (SADI) project was announced. Diamond D-JET Corporation (Diamond) in London, Ontario received a $19.6-million SADI repayable investment towards its $95.2-million D-JET program. This SADI investment will enable Diamond to develop an all-composite single engine for use in its new class of small business jets. It will also help to develop the company’s expertise in products for general aviation. Additional benefits of the D-JET program include attracting foreign investment to Canada and leveraging private sector investment in R&D, both of which will create significant economic benefits, particularly in the London region.
Strategic Outcome: Competitive Industry and Sustainable Communities
| Indicator | Result | Trend |
| Investment in machinery and equipment as a proportion of GDP | Canada invested 7.47 percent of GDP in machinery and equipment in 2007.21 | No Change |
| Use of ICTs | Business and government use of ICTs rose to 77.5 percent and 99.88 percent respectively in 2006.22 | Improving |
BizPaL is an online service that simplifies the business permit, licence and other compliance regulation process for entrepreneurs, governments and third party business service providers. Easy and convenient, BizPaL provides Canadian businesses with one-stop access to permit and licence information for all levels of government. The service’s primary goals are to slash document research time and help entrepreneurs start up faster.
For government, BizPaL provides the assurance that business clients will have the information they need to meet all permit and licence requirements quickly and efficiently. It also provides a way to improve the service experience for business clients, while gaining a competitive edge over other jurisdictions. For more information, visit BizPaL website.
 D
D
Competitive industries drive economic growth and thus are key to ensuring that the Canadian economy remains one of the strongest and healthiest among the seven leading industrial countries of the G7. Competitive industries also drive sustainable communities, and together these two key elements help to ensure a high quality of life for Canadians.
In today’s globalized marketplace, this competition for investment, skilled workers and customers has never been more intense. Industry Canada promotes competitive industries by offering a range of business services and by collaborating with business and business associations to ensure that industry views are taken into account in the development of broader trade, economic, environmental and social policies that may affect the business climate.
Meeting Our Commitments
In 2007–08 Industry Canada, in meeting its commitments to foster strong economic growth for Canada, strengthened export markets for Canadian products and services, improved the rules that govern international trade and reflected Canada’s domestic industrial agenda by working closely with the Department of Foreign Affairs and International Trade Canada (DFAIT) in the following international negotiations:
- Canada–Korea Free Trade Agreement
- Foreign Investment Promotion and Protection Agreements (FIPA) with India, China, Vietnam and Indonesia
- The Doha round of multilateral trade negotiations under the World Trade Organization
 D
D 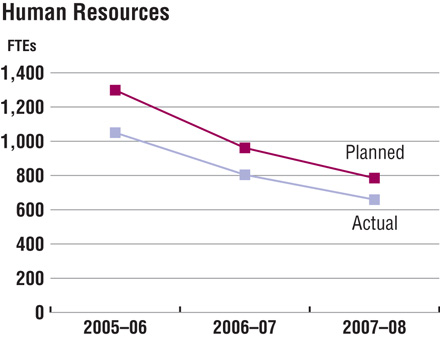 D
D
Industry Canada is finding new ways to improve service to Canadians through innovative partnerships with municipalities, industry and other key stakeholders. These arrangements require partners to work closely together with clearly defined objectives, well-defined roles and responsibilities, effective governance structures and accountability mechanisms. The BizPaL initiative is an excellent example of such an initiative.
These types of innovative partnerships result in the efficient and cost-effective delivery of government programs and services to citizens and stakeholders — services and programs that are more client-centred and which can reduce the paperwork burden.
Industry Canada also continued to pursue a variety of initiatives aimed at maintaining the competitiveness of Canadian business by:
- Addressing key policy issues related to Highly Qualified People (HQP), innovation, Scientific Research and Experimental Development (SR&ED) tax credits, procurement, commercialization, green information technology and ICT-related trade policy in policy forums and secured intelligence.
- Supporting increased business opportunities for the Canadian ICT sector by generating 718 sales leads. This was achieved through the support of Canadian pavilions at three key international trade shows in Singapore (CommunicAsia), China (PT ExpoComm) and Spain (Mobile World Congress).
- Supporting networking activities such as the Network for Women Entrepreneurs (NWE), delivered through the Canada–Ontario Business Service Centres (COBSC) a three-year Industry Canada program, to support women entrepreneurs in Ontario. This program provided Ontario businesswomen with access to networking, training, and information to help them start, operate and grow their own businesses. NWE client outreach activity had increased by 53 percent to serve 2,864 clients in 2007–08 over the previous fiscal year through 22 learning events and 36 trade shows and network/speaking events.
- Hosting a Global Value Chains (GVC) conference, that attracted 275 participants from governments, academia, think tanks and the private sector, which furthered our understanding of the implications of GVCs on industries and the economy, and clarified the role of governments in facilitating competitiveness in a globally linked value chain world.
Finally, Industry Canada continued working with Canadians to position them to take advantage of economic opportunities, support business development, provide long-term growth and promote sustainable development by:
- Supporting a study on the sustainability and corporate social responsibility (CSR) platforms of industry associations, the development of a roadmap tool for industry associations on how to effectively integrate sustainability into their organizations, and promoting these findings and tools.
- Continuing, through regional development organizations such as FedNor, to work with partners to help create an environment in which communities can thrive, businesses can grow and people can prosper.
Performance Analysis
More specifically, through the following program activities, Industry Canada continued building competitive industries and sustainable communities in 2007–08.
Program Activity Policy Sector – Economic Development
| Description: Development of industry and international business policy | ||
| Expected Result: Development and coordination of policy frameworks that support competitive industry and sustainable communities | ||
| Indicator | Result | Trend |
| Ongoing policy and program oversight and development is advanced with a view to enhancing industry competitiveness | Not Applicable | |
| Financial Resources ($ millions) 2007–08 |
Human Resources (Full-Time Equivalents) 2007–08 |
|||||
| Planned Spending |
Total Authorities |
Actual Spending |
Planned | Actual | Difference | |
| 11.2 | 12.1 | 11.7 | 89 | 68 | 21 | |
To meet shared objectives and public policy goals in filling gaps in the financial services offered to small and medium-sized enterprises (SMEs) and to improve their competitiveness, Industry Canada provided strategic direction to, and worked in partnership with, the Business Development Bank of Canada. In collaboration with the University of Ottawa, the Department also undertook two major research projects on SMEs engaged in exporting. Both projects were completed and reports on Canadian SME Exporters and Financing Canadian SME Exporters were published on Industry Canada’s website.
Program Activity Operations Sector – Economic Development
| Description: Delivery of programs, information and intelligence on investment and technology opportunities to the business community. Provision of a multi-channel, common entry point for business on behalf of the Government of Canada, and encouragement of client-centred service delivery and design | ||
| Expected Result: Improved access to capital and information for SMEs and communities targeted by Operations Sector programs | ||
| Indicator | Result | Trend |
| Number of SMEs — year over year — created or strengthened through FedNor | 3,835 SMEs were created or strengthened by FedNor through the Community Futures Development Corporation Investment Fund.25 | Improving |
| Increase in number of SMEs served through Canada Business Service Centres (service usage) |
Online Channel: 7,037,462 web hits (not including British Columbia) Officer Assisted Channels: 234,191 (i.e., telephone calls, in-person visits, email, mail and fax)26 |
Improving Declining |
| Financial Resources ($ millions) 2007–08 |
Human Resources (Full-Time Equivalents) 2007–08 |
|||||
| Planned Spending |
Total Authorities |
Actual Spending |
Planned | Actual | Difference | |
| 282.7 | 333.6 | 292.2 | 323 | 234 | 89 | |
In 2007–08, FedNor, as a regional development organization in Ontario, continued to work with partners to help create an environment in which communities can thrive, businesses can grow and people can prosper. Through the Northern Ontario Development Program alone, FedNor invested $44.2 million in 217 projects, leveraging $154.1 million in additional funds from other sources in a large and diverse geographic area stretching from the Muskoka Lakes to James Bay and from the Manitoba border to western Quebec.
In addition, improved collaboration agreements with regional partners, such as local chambers of commerce, Canada Business Service Centres, local Community Futures Development Corporations and Soci�t� d’aide au d�veloppement des collectivit�s helped ensure that Student Connections, an initiative that delivers affordable Internet and e-business training to Canadian SMEs through 14 centres across Canada, was a success.
Program Activity Industry Sector – Economic Development
| Description: Development of initiatives that support global competitiveness and sustainable economic growth in priority sectors and emerging technologies | ||
| Expected Result: Competitive and sustainable Canadian industries | ||
| Indicator | Result | Trend |
| Sales, trade and employment statistics* | GDP $527.6 billion ** (+2.4 percent change vs. previous year)27 |
Improving |
| Exports $259.2 billion (+0.5 percent change vs. previous year)28 |
No Change | |
| Employment 7,540,019 (+2.8 percent change vs. previous year)29 |
Improving | |
* This indicator is of less value to measure success and has been revised for 2008–09.
** This figure is the total GDP for sectors that Industry Canada works with.
| Financial Resources ($ millions) 2007–08 |
Human Resources (Full-Time Equivalents) 2007–08 |
|||||
| Planned Spending |
Total Authorities |
Actual Spending* |
Planned | Actual | Difference | |
| 68.6 | 180.2 | $168.6 | 234 | 247 | 13 | |
* The variance between the planned and actual spending in 2007–08 is attributed to a statutory payment of $108.4 million that was made in 2007–08. It was a loan loss sharing program, in partnership with private sector financial institutions, that was wound down in 2007–08 and a claim of $108.388 million was paid to the lender.
The Industrial and Regional Benefits (IRB) policy, managed by Industry Canada, provides the framework for using federal procurement as a lever to promote the federal government’s industrial and regional development objectives. It has allowed the federal government to secure over $1.6 billion in commitments from Lockheed Martin and Boeing in 2007–08. This will result in Canadian firms entering or moving up the global supply chains of these multinationals, as well as generating innovative R&D within the academic community.
Program Activity Spectrum, Information Technologies and Telecommunications Sector – Economic Development
| Description: Promotes economic development by ensuring that Canadians, communities and businesses have access to reliable, modern ICT infrastructure and the skills to fully participate in the digital economy. Enhances entrepreneurship and lifelong learning by fostering the creation of advanced, enabling applications and technologies. Supports the development of a competitive ICT industry in Canada | ||
| Expected Result: Canadians and communities overcoming barriers to, and gaining access to, modern Information Communication Technologies (ICT) infrastructure programs | ||
| Indicator | Result | Trend |
| Number of Canadians and communities accessing and using ICTs |
Community Access Program (CAP): Approximately 3,800 public Internet sites were supported. Approximately 1,400 Canadian youth were provided hands-on training in ICT-related work. Computers for Schools (CFS): 78,102 computers were refurbished and distributed in 2007–08.30 Approximately 360 Canadian youth were provided hands-on training in ICT-related work.31 |
Improving* |
| * Almost three-quarters (73 percent) or 19.2 million Canadians aged 16 and older went online for personal reasons during the 12 months prior to the most recent survey in 2007. This was up from just over two-thirds (68 percent) in 2005. (Statistics Canada’s Canadian Internet Use Survey – CIUS 2007) | ||
| Expected Result: Canadian ICT companies positioned for growth in the global marketplace | ||
| Indicator | Result | Trend |
| Level of awareness of opportunities, gaps and barriers affecting ICT sector growth | Continually improving awareness of the opportunities, gaps and barriers affecting ICT growth through ongoing analysis of the ICT sector, including: statistical reports on ICT sector performance and briefs on other critical issues and emerging trends, including: highly qualified people (HQP), R&D, intellectual property (IP) transfer, SR&ED, Science & Technology, as well as investment and trade. | Improving* |
* Due to expanded knowledge and value-added analysis.
| Financial Resources ($ millions) 2007–08 |
Human Resources (Full-Time Equivalents) 2007–08 |
|||||
| Planned Spending |
Total Authorities |
Actual Spending |
Planned | Actual | Difference | |
| 44.8 | 50.7 | 50.1 | 139 | 110 | 29 | |
ICTs are powerful enablers across the economy. They drive economic development productivity and are key to the social and economic inclusion of Canadians. In 2007–08, additional funding was secured to continue supporting such programs as Community Access Program (CAP) and the Computers for Schools (CFS) that play key roles in supplementing Canadians’ access to ICTs.
Industry Canada also supported the growth of the ICT sector by encouraging expansion and investment by undertaking over 25 corporate calls on Canadian and foreign multinational enterprises (MNEs). Issues were identified and fed into the policy process. This contributed to changes in Scientific Research and Experimental Development (SR&ED) credits, which provides claimants cash refunds and/or tax credits for their expenditures on eligible research and development (R&D) work done in Canada, as announced in the 2008 federal budget.
1Conference Board of Canada, Death by a Thousand Paper Cuts: The Effects of Barriers to Competition on Canadian Productivity, May 2006, p. 24.
2IMD World Competitiveness Yearbook 2007.
5Olympic and Paralympic Marks Act.
9Results can be found in Client Service Standards Report for 2007–08.
10 Survey was conducted in 2006–07 within the SME community.
11Statistics Canada, Domestic Spending on Research and Development (GERD).
12 Statistics Canada, Domestic Spending on Research and Development (GERD).
13 Conference Board of Canada, How Canada Performs 2007: A Report Card on Canada.
14www.budget.gc.ca/2008/home-accueil-eng.asp
15Statistics Canada, Labour Force Activity.
16www.nsf.gov/statistics/infbrief/nsf08305/
17Communications Research Centre Canada – S&T and Innovation
18Communications Research Centre Canada – S&T and Innovation
19Communications Research Centre Canada, Technology Transfer and Commercialization.
21www40.statcan.ca/l01/cst01/busi02a.htm/
22www40.st atcan.ca/l01/cst01/econ146a.htm?sdi=information communication technologies
23www.ic.gc.ca/epic/site/sd-dd.nsf/en/sd00545e.html
24www.ic.gc.ca/epic/site/sd-dd.nsf/en/sd00546e.html
27cansim2.stat.ca/cgi-win/cnsmcgi.exe?Lang=
E&C2Fmt=HTML20&CIITpl=SNA_&ResultTemplate
=THEMSNA4&CORCmd=GetWrap&CORId=1067
28www.ic.gc.ca/epic/site/tdo-dcd.nsf/en/home
29cansim2.statcan.ca/cgi-win/cnsmcgi.pgm?Lang=E&SP_
Action=Result&SP_ID=1803&SP_TYP=4&SP_Sort=1
Section 3: Supplementary Information
3.1 Financial Highlights
| (in thousands of dollars) | Percent Change |
2008 | 2007 |
| At End of Year (March 31, 2008): Condensed Statement of Financial Position |
|||
| Assets | |||
| Financial Assets | 4.6 | 1,634,501 | 1,561,930 |
| Non-Financial Assets | 3.1 | 111,286 | 107,908 |
| TOTAL | 4.5 | 1,745,787 | 1,669,838 |
| Liabilities | |||
| Total Liabilities | -2.0 | 2,248,007 | 2,295,007 |
| Equity | |||
| Total Equity | 19.7 | (502,220) | (625,169) |
| TOTAL | 4.5 | 1,745,787 | 1,669,838 |
| For the Year (Ended March 31): Condensed Statement of Operations |
|||
| Expenses | |||
| Transfer Payments | -16.2 | 609,831 | 728,093 |
| Operating Expenses | -1.3 | 757,958 | 768,239 |
| Total Expenses | -8.6 | 1,367,789 | 1,496,332 |
| Revenues | |||
| Total Revenues | 3.9 | 727,546 | 700,261 |
| Net Cost of Operations | -19.6 | 640,243 | 796,071 |
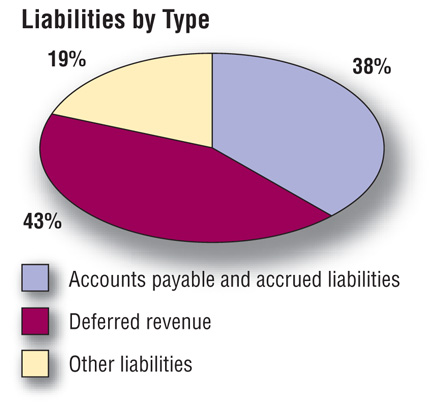 D
D
Total liabilities were $2,248 million at the end of 2007–08, a decrease of $47 million (2 percent) versus last year’s total liabilities. Deferred revenue and accounts payable continued to be the largest components of liabilities. Together they were 80.7 percent of total liabilities.
 D
D
Total assets were $1,746 million at the end of 2007–08, an increase of $76 million (4.5 percent) versus last year’s total assets. Investments continued to be the largest asset component, representing 61 percent of assets.
 D
D
Total expenses were $1,368 million at the end of 2007–08, a decrease of $129 million (8.6 percent) versus last year’s total expenses. Major expense areas included transfer payments and salaries and employee benefits.
Total revenues were $728 million at the end of 2007–08, an increase of $27 million (3.9 percent) versus last year’s total revenues. Sales of services accounted for almost 94 percent of total revenues.
3.2 List of Tables
- Loans, Investments and Advances (Non-budgetary)
- Sources of Respendable and Non-Respendable Revenue
- User Fees/External Fees
- Details on Industry Canada’s Transfer Payment Programs (TPPs)
- Foundations (Conditional Grants)
- Horizontal Initiatives
- Sustainable Development Strategy
- Response to Parliamentary Committee, Audits and Evaluations
- Internal Audits and Evaluations
- Travel Policies
- Financial Statements of Department of Industry