
Treasury Board of Canada Secretariat
www.tbs-sct.gc.ca
Common menu bar links
Breadcrumb Trail
ARCHIVED - Human Resources and Skills Development Canada - Report
 This page has been archived.
Archived Content
Information identified as archived on the Web is for reference, research or recordkeeping purposes. It has not been altered or updated after the date of archiving. Web pages that are archived on the Web are not subject to the Government of Canada Web Standards. As per the Communications Policy of the Government of Canada, you can request alternate formats on the "Contact Us" page.
Section 2: Analysis of Program Activities by Strategic Outcome(s)
2.1 Strategic Outcome 1
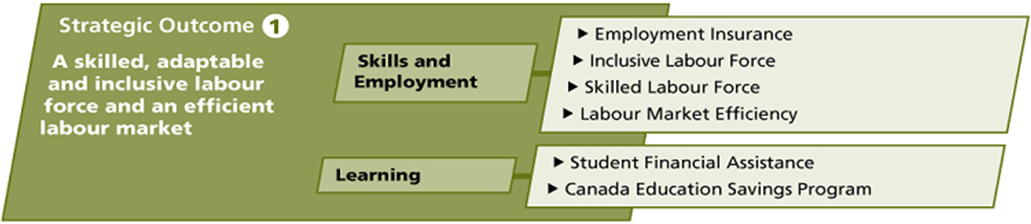
[text version of image : Strategic Outcome 1]
2.1.1 Skills and Employment
Program Activity Descriptions
Through its skills and employment programs, HRSDC helps Canadian workers adapt to a changing labour market and become more self-reliant. The Employment Insurance (EI) program provides temporary income support to eligible unemployed workers, while also helping them prepare for, find and keep jobs. Other programs are designed to support the skills development of Canadians and increase their labour market participation, focusing on those who are under-represented in the labour market, such as youth, persons with disabilities, older workers and Aboriginal people.
HRSDC's programs also support Canadian employers by helping them meet their labour-force needs and remain competitive. These programs make it easier for employers to find qualified workers (domestically or internationally trained), and provide employers with tools to improve the skills of their workforce.
Finally, HRSDC's programs improve labour market efficiency by:
- providing timely, reliable labour market information;
- improving labour mobility by working to remove barriers in regulated professions and trades; and
- improving the recognition of qualifications (both domestic and foreign) so that Canadians have opportunities to find jobs commensurate with their skills and training.
Financial Resources ($ millions)
| 2012-2013 | 2013-2014 | 2014-2015 |
|---|---|---|
| 20,417.3 | 20,427.2 | 20,033.2 |
Human Resources (FTEs)
| 2012-2013 | 2013-2014 | 2014-2015 |
|---|---|---|
| 1,932 | 1,886 | 1,879 |
| Program Activity Expected Results | Performance Indicators | Targets |
|---|---|---|
| Workers in an adjustment situation have access to temporary financial assistance. |
Percentage of unemployed individuals eligible to receive benefits, among those with a recent job separation that met Employment Insurance (EI) program eligibility criteria. Source: Administrative Data |
Target: 80–85%
Historical Results: |
| Canadians, including under-represented groups and vulnerable workers, have the opportunity to acquire skills to find and maintain productive employment. |
The proportion of clients employed and/or returning to school following a completed employment program intervention under the following federally delivered programs: Youth Employment Strategy, Opportunities Fund for Persons with Disabilities, Aboriginal Skills and Employment Training Strategy, and Skills and Partnerships Fund. Source: Administrative Data |
Target: 55–65%
Historical Results: |
| Through increased progression in the first two years of an apprenticeship program, completions are enhanced in the designated Red Seal trades. |
Number of apprentices who complete an apprenticeship program and obtain certification in a Red Seal Trade. Source: Statistics Canada's Registered Apprenticeship Information System (RAIS) |
Target: 26,000
Historical Results: Note: There is a two-year lag in the availability of data for this indicator. |
Planning Highlights
Through the following plans and priorities, HRSDC strives to achieve the strategic outcome of "a skilled, adaptable and inclusive labour force and an efficient labour market".
The Department will work to support the needs of Canadians through Employment Insurance programming that responds to evolving economic conditions. Through the examination of policy options, the Department will look at ways to improve EI Part I and II programming to further assist Canadians in weathering uncertain labour market forces and, at the same time, ensure that it provides the right incentives in the long term.
The Department will also modernize labour market programming through innovative cost-effective approaches to better meet the needs of Canadians. This will entail examining current labour market programs, including launching a number of pilots to test social partnership approaches. The goal of these pilots is to explore innovative ways to attract different sources of capital towards social outcomes, improve rates of return on government funding, and successfully address complex social challenges.
In the context of renewing major federal government transfer arrangements with the provinces and territories, the Department will be developing strategies for its expiring labour market program agreements. In addition, HRSDC will continue to engage the provinces and territories on other programs and initiatives, including the Interprovincial Standards Red Seal Program, in order to strengthen such programs by exploring innovative standards development and enhanced assessment tools. The Department will also continue to work with provinces, territories and priority occupations to implement the Pan-Canadian Framework for the Assessment and Recognition of Foreign Qualifications.
HRSDC will improve the collection and dissemination of labour market information. To help Canadian workers and employers meet their labour market needs, the Department will implement a new sectoral labour market information program and further expand the Working in Canada labour market information platform.
2.1.2 Learning
Program Activity Descriptions
With the Canada Student Loans Program and the Canada Student Grants Program, HRSDC helps Canadians attend college, university and trade schools by lowering financial barriers through the provision of loans and grants to students with financial need. HRSDC also encourages Canadians to save for post-secondary education by contributing to a Registered Education Savings Plan through the Canada Education Savings Program. Taken together, these programs contribute to building a more skilled, adaptable and inclusive labour force by helping all Canadians obtain the skills and credentials they need to succeed in the labour market.
Financial Resources ($ millions)
| 2012-2013 | 2013-2014 | 2014-2015 |
|---|---|---|
| 2,783.8 | 2,743.3 | 2,682.2 |
Human Resources (FTEs)
| 2012-2013 | 2013-2014 | 2014-2015 |
|---|---|---|
| 412 | 402 | 399 |
| Program Activity Expected Results | Performance Indicators | Targets |
|---|---|---|
|
Canadians have the skills and credentials to succeed in the labour market. |
Percentage of the Canadian labour force aged 25-64 who have attained a PSE credential.
Source: Statistics Canada, Labour Force Survey |
Target: 67.9%
Historical Results: |
| Canadians, including those from under-represented groups, can participate equitably in PSE. |
The percentage of Canadians aged 17-29 who were attending university or college: Source: Statistics Canada, Labour Force Survey |
Target: 27.8%
Historical Results: |
| Canadians, including those from under-represented groups, have access to financing for their PSE. | Percentage (and number) of post-secondary students who used one of the following to supports help finance their participation in post-secondary education. | |
| Percentage (and number) of full-time students aged 18-34 in participating provinces and territories who used a Canada Student loan or a Canada Student Grant or an in-study interest subsidy;a |
Target: 41.6% (501,700)
Historical Results: |
|
|
Percentage (and number) of full and part-time students aged 15-64 who used RESP fundingb. Source: Statistics Canada - Labour Force Survey, Administrative data, Actuarial data, LFS |
Target: 15.9% (326,000) Historical Results: |
|
Percentage of eligible children who have ever received a:
|
Target: Canada Education Savings Grant: 45.6%
Historical Results: |
|
Source: Administrative data and Statistics Canada - Labour Force Survey |
Target: Canada Learning Bond: 26% Historical Results: |
a HRSDC calculations based on administrative data and estimates from the Office of the Chief Actuary
b HRSDC calculations based on administrative data and the Labour Force Survey (Statistics Canada).
Planning Highlights
The Department will continue with the implementation of previous Budget initiatives, such as the Service Delivery Vision for Student Financial Assistance, loan forgiveness for new doctors and nurses practicing in rural or remote communities, increase to the in-study income exemption for full-time students, and increase to the income eligibility thresholds for part-time students.
In addition, the Department will focus on improving stewardship and accountability for its learning-related programs, including implementing a previously announced plan for managing the Canada Student Loans Program (CSLP) portfolio loan limit.
2.2 Strategic Outcome 2

[text version of image : Strategic Outcome 2]
2.2.1 Labour
Program Activity Descriptions
This program activity seeks to promote and sustain stable industrial relations and safe, fair, healthy, equitable and productive workplaces within the federal jurisdiction. These workplaces include:
- transportation;
- post office and courier companies;
- communications;
- banks;
- grain facilities;
- nuclear facilities;
- federal Crown corporations;
- companies who have major contracts with the federal government and Aboriginal governments;
- Aboriginal communities; and
- certain Aboriginal undertakings.
The labour program activity develops labour legislation and regulations to achieve an effective balance between workers' and employers' rights and responsibilities. It ensures that workplaces under the federal jurisdiction respect the rights and obligations established under labour legislation. The program activity also manages Canada's international and intergovernmental labour affairs, as well as Aboriginal labour affairs responsibilities.
Financial Resources ($ millions)
| 2012-2013 | 2013-2014 | 2014-2015 |
|---|---|---|
| 286.5 | 289.5 | 293.4 |
Human Resources (FTEs)
| 2012-2013 | 2013-2014 | 2014-2015 |
|---|---|---|
| 691 | 691 | 691 |
| Program Activity Expected Results | Performance Indicators | Targets |
|---|---|---|
| Employers and employees in the federal jurisdiction cooperate to resolve current and emerging workplace issues. |
Percentage of assisted collective bargaining disputes settled under Part I (Industrial Relations) of the Canada Labour Code without a work stoppage. Source: Administrative Data |
Target: 90%
Historical Results: |
| Workplace parties comply with relevant workplace standards, follow guidelines, and adopt best practices. |
Percentage of money collected in relation to the amount found to be owed for complaints under Part III (Labour Standards) of the Canada Labour Code (excluding unjust dismissal complaints) Source: Administrative Data |
Target: 75%
Historical Results |
|
Percentage of unjust dismissal complaints settled by inspectors under Part III (Labour Standards) of the Canada Labour Code. Source: Administrative Data |
Target: 75%
Historical Results: |
|
| Risks to life, health, and property are eliminated or mitigated. |
Percentage change, year over year, in the rate of lost time injuries and fatalities (Disabling Injury Incidence Rate) within the targeted higher risk federal jurisdiction industries Source: Administrative Data |
Target: Decrease of 15% over a five year period (2009-2013)
Historical Results: |
Planning Highlights
To promote cooperation and fairness in the federal jurisdiction, the Labour Program, under Part I (Industrial Relations) of the Canada Labour Code, provides mediation and conciliation services to assist employers and unions in settling disputes. In addition, a more proactive approach to labour negotiations and mediation will be pursued through the expansion of the Preventive Mediation Program. The expanded program will better assist unions and employers to build stronger relationships and, in turn, lead to more productive relations at the bargaining table.
The Labour Program will also pursue its modernization efforts. This will include further developing its compliance strategy related to Part II (Occupational Health and Safety) and Part III (Labour Standards) of the Canada Labour Code. It will also include efforts to reduce red tape and the compliance burden for small businesses, as recommended by the Red Tape Reduction Commission.
The Wage Earner Protection Program Act was amended in Budget 2011 to extend coverage entitlement for employees who lose their jobs when their employer's attempt at restructuring is unsuccessful and ends in bankruptcy or receivership. This amendment will continue to enhance protection for Canadians in 2012–2013.
The Government has identified addressing the challenges associated with Canada's aging population as a key element in Canada's future economic prosperity. One significant area where the Labour Program can take action is by supporting the continued labour market participation of older workers. In this regard, the Canada Labour Code was modified to prohibit federally regulated employers from setting a mandatory retirement age unless there is a bona fide occupational requirement. The focus will now shift to implementation and communication of these changes.
The Labour Program will continue to support the Government's active trade agenda through the negotiation of strong and comprehensive Labour Cooperation Agreements alongside each of its trade agreements, and will continue to do so in ongoing and future negotiations, such as those with the European Union and India.
Finally, as a renewal priority, the Department will work to improve succession planning and knowledge transfer within the Labour Program, particularly to support the succession of seasoned Mediation and Conciliation Officers who will be retiring.
2.3 Strategic Outcome 3
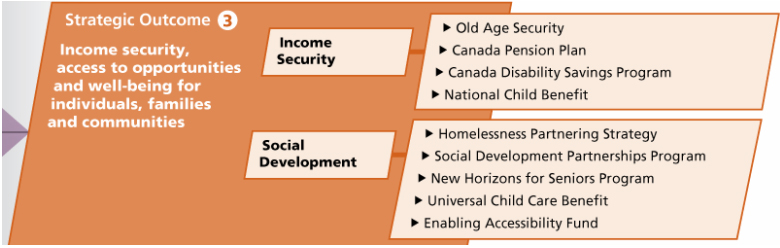
[text version of image : Strategic Outcome 3]
2.3.1 Income security
Program Activity Descriptions
Through this program activity, the Department provides eligible Canadians with retirement benefits, survivor pensions, disability benefits and benefits for children, through the Old Age Security (OAS) program and the Canada Pension Plan (CPP). There is a focus on vulnerable population segments that have difficulty receiving information and assistance through traditional government channels when accessing these benefits.
In addition, this program activity supports low-income families and their children with the National Child Benefit. Through this initiative, the federal government works in partnership with provincial and territorial governments to provide income support benefits and services to parents.
Finally, this program activity includes the administration of the Canada Disability Savings Program (CDSP), which helps Canadians with disabilities and their families save for the future.
Financial Resources ($ millions)
| 2012-2013 | 2013-2014 | 2014-2015 |
|---|---|---|
| 75,722.2 | 80,110.4 | 84,561.5 |
Human Resources (FTEs)
| 2012-2013 | 2013-2014 | 2014-2015 |
|---|---|---|
| 356 | 356 | 356 |
| Program Activity Expected Results | Performance Indicators | Targets | ||||||||||||||||||||||||
|---|---|---|---|---|---|---|---|---|---|---|---|---|---|---|---|---|---|---|---|---|---|---|---|---|---|---|
| Canada's seniors have an adequate level of income to maintain their standard of living. |
Incidencea and depthb of low income among the seniorsc using the Market Basket Measure (MBM)d. Source: Survey of Labour and Income Dynamics, 2009 |
Target:
Historical Results: 2008 MBM results:
Note: There is a two-year lag in availability of data for this indicator. |
||||||||||||||||||||||||
| Eligible working older Canadians with severe and prolonged disabilities have a measure of income security. |
Percentage of CPP contributors who have contributory coverage/eligibility for CPP Disability. Source: Administrative Data |
Target: 68% Historical Results: Note: There is a two-year lag in availability of data for this indicator. |
||||||||||||||||||||||||
| Eligible individuals with severe disabilities (and their families/guardians) open Registered Disability Saving Plans to save for the future. |
Total number of registered accounts opened since the inception of the program. Source: Administrative Data |
Target: 65,600 accounts Historical Results: |
||||||||||||||||||||||||
| Canada's families with children have an adequate level of income to maintain their standard of living. |
Incidencea and depthb of low income among Canadians in families with childrenf using Market Basket Measure (MBM)d. Source: HRSDC calculations based on Survey of Labour and Income Dynamics, 2009 |
Target: Baseline year: Change in methodology for calculating income security support. |
a The percentage of individuals living in families with a disposable income below their low income threshold.
b The percentage by which the family income of persons in low income families falls short of the relevant threshold. For example, a family whose Market Basket Measure threshold is $25,000 with a disposable income of $20,000, would have a depth of low income of $5,000 or 20% of the threshold level of $25,000.
c Individuals aged 65 and over.
d Market Basket Measure (MBM) is based on the cost of a specific basket of goods and services representing a modest, basic standard of living. It includes the costs of food, clothing, footwear, transportation, shelter and other expenses for a reference family of two adults aged 25 to 49 and two children (aged 9 and 13). It provides thresholds for a finer geographic level than the low
income cut-off (LICO), allowing, for example, different costs for rural areas in the different provinces. These thresholds are compared to disposable income of families to determine low income status. Disposable income is defined as the sum remaining after deducting the following from total family income: total income taxes paid; the personal portion of payroll taxes; other mandatory payroll
deductions such as contributions to employer-sponsored pension plans, supplementary health plans, and union dues; child support and alimony payments made to another family; out-of-pocket spending on child care; and non-insured but medically prescribed health-related expenses such as dental and vision care, prescription drugs, and aids for persons with disabilities.
e The data includes the effect of all government income support programs affecting seniors (e.g. provincial programs, refundable GST credit and the Canada and Quebec Pension Plans). When estimating low-income incidence and depth without the support of the OAS, GIS and CPP, it is assumed that individuals' behaviour and the amounts received from other government income support programs
remain unchanged. These assumptions produce an upper-bound estimation of the actual results.
f Children are those family members under the age of 18.
Planning Highlights
In 2012–2013, the Department will continue to move forward on a number of items that resulted from the 2007–2009 Triennial Review of the Canada Pension Plan (CPP) and were announced in the 2011 Speech from the Throne. These include:
- establishing the post-retirement benefit under the CPP;
- elimination of the work cessation test under the CPP;
- continued changes to the adjustment factors for early or late CPP retirement pensions;
- increase in the drop-out provision under the CPP;
- adapting to the interactions between existing pension systems and the new Pooled Registered Pension Plan; and
The Department will continue the necessary policy work to support Service Delivery Business Transformation and support the Department's core mandate to provide stewardship and ensure the long-term sustainability of Canada's retirement income system. HRSDC will also examine ways to support Canadians' financial capability to better prepare for financial decisions leading to, and during, their retirement years.
To promote the full participation of people with disabilities in all aspects of society and community life, the Department administers the Canada Disability Savings Program (CDSP). This year, the CDSP will focus on improving take-up and on implementing improvements arising from the three-year review of the Program led by the Department of Finance in late 2011.
2.3.2 Social Development
Program Activity Descriptions
This program activity includes grants and contributions, and programs in support of children, families, seniors, communities and people with disabilities, as well as the homeless or people at risk of homelessness. These programs aim to give these groups the knowledge, information and opportunities to move forward with their own solutions to social and economic challenges. It also includes the Universal Child Care Benefit, which helps Canada's families balance work and family life by financially supporting their child care choices.
Financial Resources ($ millions)
| 2012-2013 | 2013-2014 | 2014-2015 |
|---|---|---|
| 3,007.2 | 3,004.8 | 2,911.7 |
Human Resources (FTEs)
| 2012-2013 | 2013-2014 | 2014-2015 |
|---|---|---|
| 528 | 486 | 287 |
| Program Activity Expected Results | Performance Indicators | Targets |
|---|---|---|
| Homelessness is prevented and reduced. |
Number of people placed in longer-term stable housing through Homelessness Partnering Strategy-funded projects (new indicator). Source: Homelessness Electronic Reporting Information Network (HERIN) |
Target: 5,000 |
| Not-for-profit sector and partners have the capacity to respond to existing and emerging social issues for target populations. |
Number of partnerships/networks developed by funding recipients as a result of funded projects. Source: Administrative Data |
Target: (2012-13 is baseline year with new Program focus) |
| Seniors participate in, and contribute to, communities. |
Number of seniors involved in projects focused on sharing their knowledge, experience and expertise. Source: Administrative data |
Target: (2012-13 is baseline year with new Program focus) |
| People with disabilities can access community facilities. |
The number of facilities renovated, constructed and/or retrofitted over a three year period. Source: Administrative Data |
Target: 240 projects
Historical Results: |
|
The number of accessible information/communication technologies installed and/or modified (new indicator). Source: Administrative Data |
Target: 21 |
Planning Highlights
The 2011 Speech from the Throne continued to highlight the need for the federal government to support communities in their efforts to tackle local challenges, for example through tri-partite partnering with innovative charities and forward-thinking private sector companies on new approaches to social challenges. This renewed focus has an impact on a number of HRSDC programs. In particular, in 2012–2013, HRSDC will work on the transformation of the Social Development Partnerships Program and associated pilot projects.
Moving forward with other Speech from the Throne and Budget 2011 commitments, the Department will focus on delivering enhanced funding for the New Horizons for Seniors Program, the Enabling Accessibility Fund, and the Prime Minister's Volunteer Awards.
As the Government lead for people with disabilities, HRSDC will provide leadership at the federal level with respect to the UN Convention on the Rights of Persons with Disabilities, including input to Canada's first report to the UN.
Finally, the Department is continuing to implement the renewed Homelessness Partnering Strategy. HRSDC is working with its provincial and territorial counterparts to ensure alignment of priorities, and is continuing to invest in local communities across the country.
2.4 Strategic Outcome 4
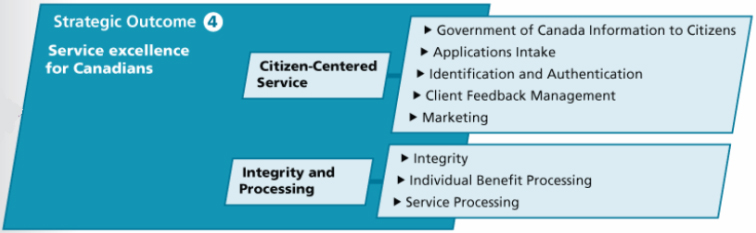
[text version of image : Strategic Outcome 4]
2.4.1 Citizen-Centred Service
Program Activity Descriptions
This program activity aims to improve service delivery by giving Canadians one-stop, easy-to-access, personalized service in person, by telephone, by Internet or by mail. This program activity is supported by overarching client strategies and partnerships with other departments, levels of government and community-based partners. It also includes client feedback mechanisms and the responsibility for increasing public awareness of Service Canada.
Financial Resources ($ millions)
| 2012-2013 | 2013-2014 | 2014-2015 |
|---|---|---|
| 400.2 | 391.0 | 390.2 |
Human Resources (FTEs)
| 2012-2013 | 2013-2014 | 2014-2015 |
|---|---|---|
| 5,584 | 5,441 | 5,428 |
| Program Activity Expected Results | Performance Indicators | Targets |
|---|---|---|
| Canadians have one-stop, personalized access to Government of Canada programs and services. |
Percentage of in-person clients proactively offered customized information in addition to the original request. Source: Client Satisfaction Survey, the Mystery Shopper Report, the In-Person Survey. |
Target: (2012-2013 is baseline year with new Program focus) |
|
Percentage of clients satisfied with the quality of service received through channels. Source: Client Satisfaction Survey |
Target: 85%
Historical Results: 2007-2008: 2005-2006: |
|
|
Percentage of Canadians with access to a Service Canada point of service within 50 km of where they live. Source: Administrative Data |
Target: 90%
Historical Results: |
a Phone results are for specialized enquiries (e.g. EI, CPP and OAS telephone channels). Results for the phone channel exclude general enquiries under the 1 800 O-Canada line.
Planning Highlights
Service Canada delivers program and service information, self-service and assisted service in both official languages across a multi-channel network. This network includes the Internet, call centres and more than 600 in-person locations in hundreds of communities across the country (i.e., the Click-Call-Visit service model).
In the coming year, HRSDC will be more responsive, efficient and modern in the way services are delivered to Canadians. The Department will continue to encourage Canadians to take advantage of electronic services and self-service options when seeking information and conducting transactions. HRSDC will undertake several projects to improve the way it delivers services online. These include ensuring that its websites are accessible to all Canadians and that the Canada Benefits website provides information on all the programs and benefits to which citizens are entitled. There will also be new features added to the My Service Canada Account to improve communication with clients and to allow them to quickly check on the status of requests. Improved online service delivery allows citizens to interact and transact with us—when, how and where they choose.
Service Canada's client contact approach will also be expanded with the aim of resolving enquiries the first time someone contacts us. This is a key element of aligning call centres with industry best practices and ensuring call centres are capable of supporting the service vision of the portfolio. In 2012–2013, Service Canada will implement an integrated service delivery strategy that optimizes first-contact resolution of client enquiries by:
- migrating clients to self-serve options for simple and common transactions;
- providing real-time support to self-serve options; and
- engaging call centres in the support of more high-value and complex transactional interactions.
In 2012–2013, the Department will redesign the Service Canada website to make it more user friendly, and examine other new approaches to ensure continued, easy to access, quality service to Canadians in the most efficient and cost-effective manner.
The Government of Canada announced in January 2012 that it would improve the way it does business to better address the needs of today’s youth, including helping them prepare for, find and maintain meaningful employment. Youth.gc.ca is being redesigned to both better meet the needs of today’s youth and provide them with a more interactive experience, through the use of social media tools such as Twitter and YouTube.
Service Canada will continue to negotiate service delivery agreements with other departments. This will ensure that Canadians can readily access more Government of Canada services through Service Canada, the service delivery agent for the Government of Canada.
2.4.2 Integrity and Processing
Program Activity Descriptions
The integrity program activity positions the Department to better ensure the accuracy of payments, the security and privacy of personal information, and the overall quality of service offerings provided by Service Canada.
The processing program activity consists of the adjudication of statutory benefits and the maintenance of accounts through an integrated national processing and payment network, which accounts for approximately 85 percent of all federal government payments to citizens. This includes the administration of over 50 international agreements for the delivery of benefits to Canadians.
Meeting Canadians' expectations that services and benefits are delivered to the right person in the right amount and at the right time is a cornerstone of the Department's service commitments. HRSDC continues to modernize its processing and service delivery functions to further enhance the efficiency, accuracy and integrity of its operations.
Service Canada has management frameworks, processes and risk-based controls to strengthen the integrity of departmental programs, thus ensuring operational and service compliance.
While increasing public confidence and trust in the delivery of government services, these efforts also yield substantial savings for the federal government and Canadian taxpayers, reaching $740 million in 2010–2011. These savings stem from identifying and then discontinuing benefits issued as a result of suspected fraud, abuse or client-error related to the Employment Insurance, Canada Pension Plan and Old Age Security. Included in this total amount are overpayments identified as a result of integrity program activities and future savings resulting from the discontinuation of ineligible benefits.
To maintain the public's trust and confidence in the way personal information is handled, the Department continues to place great emphasis on protecting the information Canadians have entrusted to us.
Financial Resources ($ millions)
| 2012-2013 | 2013-2014 | 2014-2015 |
|---|---|---|
| 618.0 | 580.4 | 579.0 |
Human Resources (FTEs)
| 2012-2013 | 2013-2014 | 2014-2015 |
|---|---|---|
| 7,958 | 7,448 | 7,434 |
| Program Activity Expected Results | Performance Indicators | Targets |
|---|---|---|
| Services and benefits are delivered accurately. |
Percentage of payments for Employment Insurance (EI), Canada Pension Plan (CPP), Old Age Security (OAS) and Guaranteed Income Supplement (GIS) delivered accurately. Source: Administrative Data |
Target: 95% Historical Results: Canada Pension Plan Old Age Security/Guaranteed Income Supplement |
| Services and benefits are delivered securely. |
Percentage of clients notified within 10 business days that their personal information was potentially put at risk. Source: Administrative data |
Target: 100% Historical Results: |
| Canadians receive services, benefit payments or notifications of non-payment within published service standards. |
Percentage of services, benefit payments or non-payment notifications delivered within service standards (new indicator). |
Target: |
|
Percentage of EI benefit payments or non-payment notifications issued within 28 days of filing. |
EI Benefit Historical Results: |
|
|
Percentage of OAS basic benefits paid within the first month of entitlement. |
OAS Benefit Historical Results: |
|
|
Percentage of CPP retirement benefits paid within the first month of entitlement. |
CPP Benefit Historical Results: |
|
|
Percentage of initial Apprenticeship Incentive Grant (AIG) payments and non-payment notifications issued within 28 calendar days. |
AIG Historical Results: |
|
|
Percentage of initial Apprenticeship Completion Grant (ACG) payments and non-payment notifications issued within 28 calendar days. |
ACG Historical Results: |
|
|
Percentage of initial Wage Earner Protection Program (WEPP) payments and non-payment notifications issued within 42 calendar days |
WEPP Historical Results: |
|
|
Percentage of Social Insurance Numbers (SINs) issued in one visit (based on complete applications with all supporting documents) and cards issued within five business days from date of receipt of request. Source: Administrative Data. |
SIN Historical Results: 2009-2010: |
Planning Highlights
Building on the progress already achieved in modernizing how the Department delivers services, HRSDC will move forward with Employment Insurance (EI) service improvements. This involves further increasing claims processing automation and continuing to implement national workload management. These service improvements will help reduce the cost of delivering EI and ensure that clients' needs are met. They will also help further improve the integrity of benefit processing through modernization and identity management strategies. In addition, the Department will enhance the electronic services available to individuals (e.g. direct deposit) and businesses (e.g. electronic submission of records of employment), thereby easing the administrative burden and minimizing red tape.
HRSDC will continue to refine our plans to transform how Canada Pension Plan (CPP), Old Age Security (OAS) and Guaranteed Income Supplement (GIS) benefits are delivered to a growing number of Canadian seniors. This includes plans for service delivery improvements to the OAS program which could, among other initiatives, leverage modern technologies to improve services for new applicants.
The Department will continue to strengthen the integrity control framework for the EI, OAS and CPP programs. This will take place through the continued implementation of risk-based approaches, such as automation of controls, modernization of processes and data-driven analytics. Such measures will allow the Department to address program integrity issues more effectively, while saving money for the Government and taxpayers by reducing incorrect payments due to fraud, abuse and client error. HRSDC will also review how the results of these activities are measured and reported to ensure the full impact of this work is appropriately detailed and understood.
Finally, HRSDC will continue to strengthen identity management. This will help reduce overpayments and increase program integrity, resulting in administrative efficiency and financial rigor for the Government. Strengthened identity management will also provide for safer, more secure online services. This is particularly important given the expansion of electronic and automated services offered to Canadians.
2.5 Internal Services
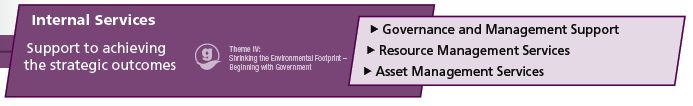
[text version of image : Internal Services]
Program Activity Descriptions
Internal services support the achievement of the Department's strategic outcomes by providing the resources, guidance, support services and information necessary to design and deliver programs and services. The definition of internal services is broad. It includes policy development, research, audits, evaluation, planning, risk management and executive functions. It also encompasses more traditional corporate services, such as access to information, privacy management, information management, information technology, human resources, learning and training, financial management and security.
At HRSDC, these services are managed by: Corporate Secretariat, the Chief Financial Officer, Human Resources Services, Strategic Policy and Research, Legal Services, Public Affairs and Stakeholder Relations, Internal Audit Services, Internal Integrity and Security, Policy Horizons, Service Canada College, and Innovation and Information Technology.
The proportion of resources for internal services across the country reflects the complexity and breadth of the Department's mandate, as well as the number and diversity of points of service and service channels. The decentralized service delivery network is complex. It is supported by an equally complex network of internal services, with over 2,000 internal services full-time employees located outside of the National Capital Region.
The creation of Shared Services Canada (SSC) in August 2011 will streamline and consolidate the delivery of e-mail, data centre and network services across the federal government.
Financial Resources ($ millions)
| 2012-2013 | 2013-2014 | 2014-2015 |
|---|---|---|
| 831.1 | 772.3 | 766.8 |
Human Resources (FTEs)
| 2012-2013 | 2013-2014 | 2014-2015 |
|---|---|---|
| 5,258 | 5,028 | 5,009 |
Planning Highlights
The main objective of the Enabling Services Renewal Program (ESRP) is to implement a high-quality internal service delivery model with lasting relevance. To achieve this goal, ESRP will transform internal services and improve service delivery through a redesign, amalgamation and streamlining of corporate services. Over a five–year period, the ESRP internal services redesign will adopt a Click-Call-Consult service delivery model that is based on Service Canada's integrated, client-segmented Click-Call-Visit model.
ESRP is already underway. Moving forward, the Department can expect streamlined standardized processes, which will decrease costs and improve internal services. The Program contains risks due to its complexity and scope, but HRSDC faces a much greater risk if it fails to modernize internal services. ESRP will be carefully monitored and evaluated during its implementation to ensure that the Program is successful.
ESRP will align, consolidate and, where possible, automate internal services to replace aging infrastructure and out-of-date business practices. For example, the Government of Canada has standardized the use of System Application and Products (SAP) and PeopleSoft. ESRP will configure and integrate these systems to better address Canadians' needs and enable the Department to take part in government-wide common business practices, such as electronic transfers of employee records.
ESRP will forge ahead on business transformation design and oversee the alignment of the enabling services branches' integrated business plans. In selected internal services operations, ESRP will lead the way by integrating the information and support to employees and managers based on improvements in the first stages of the program roll-out in April 2012. This will prepare the Department for April 2014 and the standardized process and system implementation that represents the core of the ESRP transformation.
In terms of human resources, HRSDC will continue to move forward with an integrated learning framework for the Department, and will update its workforce management strategy in order to build and sustain a talented workforce in a productive and supportive work environment within the context of the Department’s business, priorities and objectives. Vacancy Management Committees are in place to ensure consistency, fairness and transparency in the review and approval of indeterminate staffing requests across the Portfolio. A change management leadership framework will also support managers and executives, enabling them to better help employees implement the transformation agenda. Finally, employees will be engaged through the Voice of the Employee project, which will provide valuable feedback about how employees perceive the organization and the roll-out of the change initiatives.
The Treasury Board Secretariat and Statistics Canada have published the results of the 2011 Public Service Employee Survey (PSES). The Department will review the results and ensure that its integrated business plans include actions needed to address any challenges identified.
HRSDC will continue to implement the Departmental Language of Work Strategy. This Strategy demonstrates HRSDC’s leadership and creativity in fulfilling its language of work responsibilities and in fostering a corporate culture where the use of both official languages is encouraged and valued. The Department will also continue to implement and monitor the 2010–2013 Diversity and Employment Equity Action Plan. This Action Plan aims at changing the corporate culture in order to continue to create and maintain an inclusive workplace that reflects Canada’s diversity.
To reinforce departmental stewardship, HRSDC will continue to strengthen the Department's Financial Management Framework. In support of this objective, internal services will align financial and material management, roll-out express lane staffing, and strengthen the integrity of centrally managed cost pools. The Department will move forward with the HRSDC Privacy Renewal Action Plan approved in June 2011, implement the action plan for audit readiness, and continue efforts to strengthen departmental security. By working across the Department to leverage ongoing initiatives, tools and practices, internal services will limit investments and accelerate results.