
Treasury Board of Canada Secretariat
www.tbs-sct.gc.ca
Common menu bar links
Breadcrumb Trail
ARCHIVED - Industry Canada
 This page has been archived.
Archived Content
Information identified as archived on the Web is for reference, research or recordkeeping purposes. It has not been altered or updated after the date of archiving. Web pages that are archived on the Web are not subject to the Government of Canada Web Standards. As per the Communications Policy of the Government of Canada, you can request alternate formats on the "Contact Us" page.
Section 3: Supplementary Information
3.1 Financial Highlights
The financial highlights presented within this DPR are intended to serve as a general overview of IC's financial position and operations. The Department's financial statements can be found on IC's website.
| ($ millions) | % Change | 2009 | 2008 |
|---|---|---|---|
| Condensed Statement of Financial Position (unaudited) At March 31 |
|||
| ASSETS | |||
| Financial Assets | 11 | 1,823 | 1,635 |
| Non-Financial Assets | -1 | 110 | 111 |
| TOTAL | 11 | 1,933 | 1,746 |
| LIABILITIES | |||
| Accounts Payable and Accrued Liabilities | -24 | 650 | 856 |
| Deferred Revenue (Note 1) | 417 | 4,957 | 958 |
| Other Liabilities | 14 | 496 | 434 |
| Total Liabilities | 171 | 6,103 | 2,248 |
| EQUITY | 731 | (4,170) | (502) |
| TOTAL | 11 | 1,933 | 1,746 |
| Condensed Statement of Operations (unaudited) For the period Ended March 31 |
|||
| EXPENSES | |||
| Transfer Payments | -18 | 502 | 610 |
| Operating Expenses | 6 | 803 | 758 |
| Total Expenses | -5 | 1,305 | 1,368 |
| REVENUES | |||
| Sales of Services | 13 | 772 | 681 |
| Other | -23 | 36 | 47 |
| Total Revenues | 11 | 808 | 728 |
| NET COST OF OPERATIONS | -22 | 497 | 640 |
Note 1: Increase in liability of $4.26 billion from an auction for Advanced Wireless Services and Other Spectrum in the 2 GHz Range. This revenue is recognized over a 10-year period.
 D
D Total assets were $1.93 billion at the end of 2008–09, an increase of $187 million (11%) versus last year’s total assets. This increase is mainly due to the change of total financial assets, which is composed of accounts receivable and advances of $102 million, loans of $405 million, and investments of $1.32 billion. During FY 2009, an additional $250 million investment in the Business Development Bank of Canada caused a significant increase in financial assets. The rest of the variation was the combined result of loans and accounts receivable.
 D
D Total liabilities were $6.10 billion at the end of 2008–09, an increase of $3.86 billion (171%) versus last year’s total liabilities. The deferred revenue is the largest liability on the statement of financial position, representing 81% of total liability. At the end of FY 2009, deferred revenue was $4.96 billion, with a significant increase of $4.26 billion in comparison to last year, and this increase is attributed to an auction for Advanced Wireless Services and Other Spectrum in the 2-GHz Range. The deferred revenue is being recognized on a straight-line basis over the next 10 years.
 D
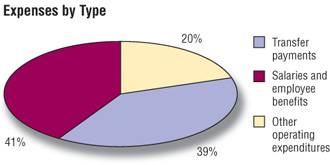
D Total expenses were $1.31 billion in 2008–09, a decrease of $63 million (5%) versus last year’s total expenses. The decrease is mainly attributed to a decrease of total transfer payments of $108 million due to a one-time payment of $105 million made in FY 2008, and it is partially offset by an increase in salaries and employee benefits and other minor changes in other operating expenditures.
 D
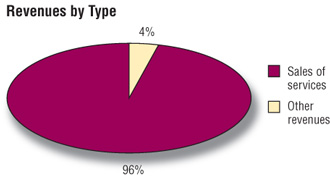
D Total revenues were $808 million in 2008–09, an increase of $80 million (11%) versus last year’s total revenues. Sales of services account continued to be the largest revenue component, representing 96% of total revenue. The main revenue streams include license fees, $496 million; trademarks, patents, copyrights, $144 million, and other, $168 million. The variation of $80 million in FY 2009 is attributable largely to the recognition of revenue from the spectrum auction recorded as a liability.
3.2 List of Tables
The following information is available on the Treasury Board Secretariat's website at:
http://www.tbs-sct.gc.ca/dpr-rmr/st-ts-eng.asp
- Table 1 – Sources of Respendable and Non-respendable Revenue
- Table 2 – User Fees / External Fees
- Table 3 – Details on Industry Canada's Transfer Payment Programs (TPPs)
- Table 4 – Up-Front Multi-Year Funding (formerly Foundations (Conditional Grants))
- Table 5 – Horizontal Initiatives
- Table 6 – Sustainable Development Strategy
- Table 7 – Green Procurement
- Table 8 – Response to Parliamentary Committees and External Audits
- Table 9 – Internal Audits and Evaluations
3.3 Other Items of Interest
IM/IT Governance and Responsibilities at Industry Canada
Section 41, Official Languages Act
3.4 Additional Information for Program Activities by Strategic
Outcome
- A Fair, Efficient and Competitive Marketplace
- An Innovative Economy
- Competitive Industry and Sustainable Communities
3.5 Expected Results Information for Program Sub-Activities and
Sub-Sub-Activities by Strategic Outcome
- A Fair, Efficient and Competitive Marketplace
- An Innovative Economy
- Competitive Industry and Sustainable Communities