
Treasury Board of Canada Secretariat
www.tbs-sct.gc.ca
Common menu bar links
Breadcrumb Trail
ARCHIVED - National Parole Board
 This page has been archived.
Archived Content
Information identified as archived on the Web is for reference, research or recordkeeping purposes. It has not been altered or updated after the date of archiving. Web pages that are archived on the Web are not subject to the Government of Canada Web Standards. As per the Communications Policy of the Government of Canada, you can request alternate formats on the "Contact Us" page.
Section II: Analysis by Strategic Outcome
Section II provides information on performance in 2007-08 based on NPB’s strategic outcomes and Program Activity Architecture (PAA). The strategic outcomes and PAA reflect the Board’s legislative responsibilities and the areas of performance in which Parliament and the public most frequently express interest.
Data Sources and Reliability
Information for this section was extracted from NPB files and reports, a survey of victims of crime, and two major automated systems – the Offender Management System (OMS), and the Pardons Application Decision System (PADS). Data from OMS and PADS, as well as data collection processes are subject to rigorous review, and correction where necessary. Through these monitoring processes, the Board strives to produce information that is timely and accurate.
1. Quality Conditional Release Decisions
Strategic Outcome: Quality conditional release decisions which contribute to public protection through the safe reintegration of offenders in the community.
Program Activity: Quality Conditional Release Decisions
Program Activity Description: Case review and quality decision-making by Board members; staff support for decision-making; training to ensure professionalism in all aspects of decision-making; and policy development and advice to guide decision-making.
Effectiveness for this activity is assessed by monitoring the outcomes of offenders on parole. Outcomes of release provide a complete picture of performance. Completion of a release by an offender without return to an institution is an indicator of success. Revocation of release for a breach of the conditions is not a positive result for the offender, but from a community perspective it is a positive intervention to reduce risk. Releases which result in a new offence are a negative result. Additional information is provided on violent re-offending by parolees as these incidents have the most serious consequences for the community. Further, the section reports on post-warrant expiry re-offending to provide information on the long-term effectiveness of parole.
| Planned Spending | Authorities | Actual Spending |
|---|---|---|
| $ 34,485 | $ 35,240 | $ 34,330 |
| Planned | Actual | Difference |
|---|---|---|
| 374 | 326 | 48* |
* The difference is explained, in part, by the transfer of resources to the Correctional Service of Canada (23 FTE) for the provision of information technology services.
| Program Activity | Priorities/Commitments | Recent Progress |
|---|---|---|
|
|
|
|
||
|
|
|
|
|
|
|
|
The Board uses three indicators related to the performance of parolees in the community:
- outcomes of conditional release;
- convictions for violent offences; and
- post-warrant expiry recidivism.
Information is also provided for offenders on statutory release (SR), although these offenders are released by law, and not at the discretion of the Board.
Outcomes of Conditional Release
Long-term information on outcomes for federal offenders under supervision indicates that:
- over 78% of releases on parole (day and full) are completed successfully;
- 14% of releases on parole are revoked for a breach of condition;
- 8% of releases on parole end in a new offence, 1% ends in a new violent offence;
- 58% of releases on SR are completed successfully, 28% are revoked for a breach of conditions, 13% end with a new offence and 3% end in a new violent offence.
Recent information on the outcomes of release (Table 1) is consistent with long-term trends. Care should be taken, however, with information for 2007-08, as numbers could change as cases make their way through the court process.
| RELEASE TYPE/YR. | SUCCESSFUL COMPLETION | REVOCATION for Breach of Condition | TOTAL WITHOUT RE-OFFENDING | REVOCATION WITH OFFENCE | TOTAL REVOCATIONS WITH OFFENCE | ||||||||
|---|---|---|---|---|---|---|---|---|---|---|---|---|---|
| Non Violent | Violent | ||||||||||||
| # | % | # | % | # | % | # | % | # | % | # | % | ||
| Day Parole | 2005-06 | 2483 | 81.6 | 397 | 13.1 | 2880 | 94.7 | 141 | 4.6 | 21 | 0.7 | 162 | 5.3 |
| 2006-07 | 2547 | 81.9 | 378 | 12.2 | 2925 | 94 | 164 | 5.3 | 22 | 0.7 | 186 | 6 | |
| 2007-08 | 2511 | 83.5 | 391 | 13 | 2902 | 96.4 | 96 | 3.2 | 11 | 0.4 | 107 | 3.6 | |
| Full Parole* | 2005-06 | 985 | 70.8 | 262 | 18.8 | 1247 | 89.6 | 128 | 9.2 | 17 | 1.2 | 145 | 10.4 |
| 2006-07 | 972 | 71 | 255 | 18.6 | 1227 | 89.6 | 133 | 9.7 | 9 | 0.7 | 142 | 10.4 | |
| 2007-08 | 990 | 72.9 | 262 | 19.3 | 1252 | 92.2 | 94 | 6.9 | 12 | 0.9 | 106 | 7.8 | |
| Statutory Release | 2005-06 | 3244 | 58.5 | 1652 | 29.8 | 4896 | 88.3 | 519 | 9.4 | 131 | 2.4 | 650 | 11.7 |
| 2006-07 | 3266 | 58.4 | 1648 | 29.5 | 4914 | 87.9 | 540 | 9.7 | 136 | 2.4 | 676 | 12.1 | |
| 2007-08 | 3348 | 58.8 | 1739 | 30.6 | 5087 | 89.4 | 496 | 8.7 | 110 | 1.9 | 606 | 10.6 | |
* Full parole includes only those offenders serving indeterminate sentences as offenders serving indeterminate sentences can only successfully complete full parole by dying.
Information on the outcomes of release for provincial offenders in the regions where NPB exercised parole decision-making authority for these offenders indicates that over the past ten years, 78% of releases were completed successfully, 3% resulted in a new offence, and 0.3% resulted in a new violent offence. In real numbers, 16 of 5,344 parole releases for provincial offenders in the last ten years, resulted in a new violent offence.
Offenders with Life Sentences for Murder
"Lifers" represent a growing segment of the federal offender population. In 2007-08 they represented 19% of the federally incarcerated population and 32% of day and full parolees. Offenders with life sentences are not entitled to statutory release. Successful completion rates for day parole for offenders with life sentences are higher than rates for most other groups of offenders, and rates of re-offending are lower. For example, over the past 10 years, 92% of day paroles for lifers have been successfully completed compared with 81% for offenders serving a determinate sentence. Table 2 provides information on outcomes for day parole by offence of conviction in 2006-07 and 2007-08. The group most likely to re-offend is the property offence group, followed by those incarcerated for a violent but non-sexual offence.
| Outcome | Murder | Sex Offence | Violent Non-Sex | Drugs | Property | Total | ||||||
|---|---|---|---|---|---|---|---|---|---|---|---|---|
| 06/07 | 07/08 | 06/07 | 07/08 | 06/07 | 07/08 | 06/07 | 07/08 | 06/07 | 07/08 | 06/07 | 07/08 | |
| Successful Completions | 91.5 | 92.6 | 94.4 | 93.0 | 77.7 | 78.2 | 87.1 | 87.2 | 71.3 | 75.4 | 81.9 | 83.5 |
| Revoked for breach of conditions | 7.0 | 6.9 | 4.5 | 7.0 | 16.1 | 17.4 | 8.9 | 10.1 | 15.9 | 17.4 | 12.2 | 13.0 |
| Revocations with offence | ||||||||||||
| Non-violent | 1.1 | 0.6 | 1.1 | 0.0 | 4.6 | 3.4 | 4.1 | 2.7 | 12.5 | 6.8 | 5.3 | 3.2 |
| Violent | 0.4 | 0.0 | 0.0 | 0.0 | 1.7 | 1.0 | 0.0 | 0.0 | 0.3 | 0.3 | 0.7 | 0.4 |
| Total | 1.5 | 0.6 | 1.1 | 0.0 | 6.3 | 4.4 | 4.1 | 2.7 | 12.8 | 7.2 | 6.0 | 3.6 |
Offenders serving life sentences for murder and released on full parole remain on parole for life. Long-term follow-up for this group indicates that about 9% re-offend. Since 1994-95, 1,886 offenders with life sentences for murder have had 2,120 full parole supervision periods. By March 31, 2008, 65% of these supervision periods were still active. The outcomes of the remaining cases were as follows:
- 13% involved the death of the offender on full parole.
- 13% were revoked for a breach of conditions.
- 6% were revoked for a non-violent offence.
- 3% were revoked for a violent offence.
Convictions for Violent Offences - Federal Offenders
- From 1996-97 to 2006-07, the annual number of convictions for violent offences by day and full parolees declined by 65%.
- Rates of conviction per 1,000 parolees also declined sharply (from 38 to 16 for day parole and from 13 to 3 for full parole).
- Comparison of violent conviction rates and violent crime rates in Uniform Crime Reports shows that full parolees are no more likely than the general public to commit a violent crime.
| YEAR | DAY PAROLE(convictions) | RATES PER 1,000 | FULL PAROLE (convictions) | RATES PER 1,000 | STATUTORY RELEASE (convictions) | RATES PER 1,000 | TOTAL CONVICTIONS |
|---|---|---|---|---|---|---|---|
| 1996/97 | 39 | 38 | 55 | 13 | 160 | 67 | 254 |
| 1997/98 | 38 | 30 | 49 | 12 | 157 | 63 | 244 |
| 1998/99 | 36 | 24 | 38 | 9 | 138 | 55 | 212 |
| 1999/00 | 58 | 37 | 47 | 10 | 160 | 57 | 265 |
| 2000/01 | 35 | 25 | 40 | 9 | 167 | 60 | 242 |
| 2001/02 | 33 | 25 | 33 | 8 | 149 | 52 | 215 |
| 2002/03 | 23 | 18 | 27 | 7 | 148 | 51 | 198 |
| 2003/04 | 20 | 15 | 21 | 5 | 149 | 50 | 190 |
| 2004/05 | 22 | 18 | 28 | 7 | 137 | 46 | 187 |
| 2005/06 | 21 | 15 | 21 | 5 | 131 | 43 | 173 |
| 2006/07* | 22 | 16 | 11 | 3 | 137 | 43 | 170 |
| 2007/08* | 13 | 10 | 15 | 4 | 110 | 35 | 138 |
* Figures may fluctuate during the 12 to 18 months following fiscal year end as offenders proceed through the courts.
Post Warrant Expiry Reoffending
Post-warrant expiry re-offending information is based on readmissions to a federal institution for offenders who completed their sentence on full parole or SR or were incarcerated to the end of their sentence. Long-term follow-up (sentences completed between 1992-93 and 1997-98) indicates that about 26% of these offenders have returned to a federal penitentiary. There are, however, differing rates of re-offending for offenders within this group:
- 11% who reached warrant expiry on full parole have returned to a federal institution;
- 32% of offenders who reached warrant expiry on SR, have returned to a federal institution;
- 36% of offenders who remained incarcerated to warrant expiry (e.g., detained), have returned to a federal institution.
Parole is founded on the principle that gradual release, based on effective programs and treatment, quality risk assessment, and effective community supervision enhances community safety. Information on post-warrant expiry re-offending reinforces this theory, suggesting that the detailed process of case preparation and risk assessment used by NPB and CSC for parole decision-making is effective in identifying those offenders most likely to remain free from violent crime in the community. Post-warrant expiry re-offending, as reported, deals only with federal re-offending (i.e., a new sentence of two years or more). If all new offences (e.g., fines, sentences of less than two years) were considered, the rate of re-offending would increase. NPB does not have access to this information at this time.
Lessons learned-quality conditional release decisions:
In 2007-08, NPB carried-out a number of activities designed to support quality decision-making, including:
- evaluation of the Board’s orientation and training program for Board members that produced numerous recommendations to enhance the content and delivery of training. NPB is currently developing an action plan to respond to these recommendations.
- introduction, based on assessment of issues related to visible minority offenders, of a new policy for the Hallmarks of a Quality Hearing which allows for the use of a cultural interpreter should such assistance be required by Board members.
- implementation of new policy for the use of video-conferencing technology to facilitate Board member involvement in hearings.
Open and Accountable Conditional Release Processes
Strategic Outcome: Open and accountable conditional release processes that ensure active involvement and engagement of victims and the public before and after conditional release decisions are made.
Program Activity: Conditional Release Openness and Accountability.
Program Activity Description: Information for victims of crime; assistance for observers at hearings and those who seek access to NPB’s decision registry; public information; and investigation of incidents in the community.
This program activity is designed to ensure that the Board operates in an open and accountable manner, consistent with the provisions of the CCRA, and that it shares information effectively in support of public safety. Work in this area recognizes that NPB operates in a difficult environment in which timely sharing of accurate information is fundamental to effective partnership and public trust. Results for this area are assessed by monitoring the timeliness of information shared, by conducting surveys of those who receive information and assistance from the Board (e.g. victims), and by conducting relevant management reviews and investigations.
| Planned Spending | Authorities | Actual Spending |
|---|---|---|
| $ 8,917 | $ 8,089 | $ 6,208 |
Note: Actual spending was less than planned spending primarily as a result of funding related to victims of crime that was placed in a frozen allotment pending changes to the CCRA.
| Planned | Actual | Difference |
|---|---|---|
| 77 | 66 | 11 |
| Progress Activity | Priorities/Commitments | Recent Progress |
|---|---|---|
|
|
|
|
|
|
|
The CCRA requires the Board to provide information for victims of crime, allow observers at its hearings and provide access to its decisions through a registry of decisions. Performance reporting in this area has two components dealing with outputs and outcomes:
- the volume of NPB activity in response to demands for information/assistance (outputs); and
- the satisfaction of those who receive information and assistance from the Board (outcomes).
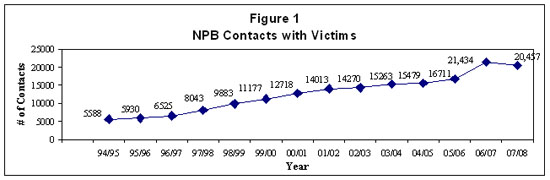
Contacts with Victims:
In 2007-08, the Board had over 20,000 contacts with victims. Most were victims of violence, such as sexual assault, or the family of murder victims. The vast majority (95%) of victims surveyed in past years have expressed satisfaction with the quality and timeliness of information provided by NPB staff.
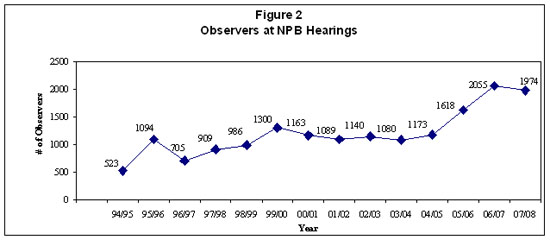
Observers at Hearings:
The Board had 1,974 observers at its hearings in 2007-08. The increase in observers in the past years can be attributed to growing public awareness of the observer provisions of the CCRA and the federal fund to pay the travel costs for victims to attend NPB hearings. Most observers (90%) agree that the hearing process is rigorous and that Board members are very thorough in reviewing information for decision-making.
Victims’ Presentations:
In 2007-08, victims made 244 presentations at hearings. Most were family members of murder or manslaughter victims. The majority of presentations (88%) were in person. The remainder came in the form of audio or video tapes. There has been an increase in the number of victims making presentations at hearings which appears to be linked to the fund to pay travel costs for victims to attend NPB hearings.
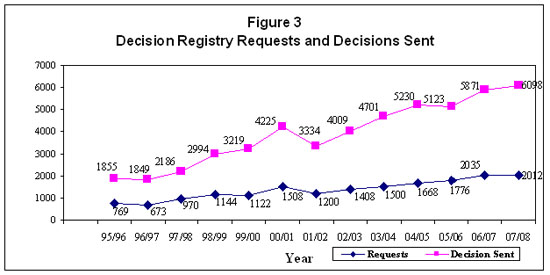
Decision Registry:
The CCRA permits access to specific NPB decisions and to decisions for research purposes through NPB's decision registry. For specific cases, any person who demonstrates an interest may, on written application to NPB, have access to the contents of the registry. Information that would jeopardize the safety of a person, reveal the source of information obtained in confidence, or adversely influence the reintegration of the offender is deleted. For research purposes, people may apply to the Board for access to decisions and receive information after the decisions have been screened to remove all personal identifiers.
The CCRA does not define the contents of the "registry of decisions", or what constitutes demonstrating interest in a case; however, in keeping with the concepts of openness and accountability, the Board makes available the complete risk assessment and decision documentation of Board members. Individuals demonstrate an interest by writing to the Board to ask for access to the decision registry. In 2007-08, the Board released 6,098 decisions from the registry. Victims access the registry most frequently (58%), followed by media (41%).
Lessons learned - victims, observers and the decision registry:
In response to recommendations from victims’ advocates, the Board began to explore the use of video-conferencing technology to enhance access by victims to NPB hearings. To support progress in this area, the Board continues to assess the need for policy and training and consider measures to ensure that sufficient resources are available to support proper implementation of this new approach. Effective progress also requires that NPB work in partnership with CSC to ensure that video-conferencing equipment is available in hearing rooms and in various sites in the community to support productive use of this technology.
3. Quality Pardon Decisions
Strategic Outcome: Quality pardon decisions and clemency recommendations which contribute to public protection and support the process of rehabilitation.
Program Activity: Pardon Decisions/Clemency Recommendations.
Program Activity Description: Case review and quality decisions to grant, deny or revoke pardons; support for pardon decision-making; development of pardons policy; collection of pardon revenues; and development of recommendations for clemency.
A pardon is a formal attempt to remove the stigma of a criminal record for people found guilty of a federal offence who, after satisfying their sentence and a specific waiting period, have shown themselves to be responsible citizens. A pardon is, therefore, a means to facilitate safe community reintegration. Assessment of results in this area considers efficiency (the average time required to process pardon applications) and effectiveness (rates of revocation of pardons).
| Planned Spending | Authorities | Actual Spending |
|---|---|---|
| $ 1,945 | $2,949 | $2,892 |
| Planned | Actual | Difference |
|---|---|---|
| 28 | 34 | (6) |
Historically, the Board received 15,000 to 20,000 pardon applications per year; however in 2005-06 and 2006-07, applications rose to 27,900 and 26,600 respectively. Workload growth continued in 2007-08, as applications reached 30,398. These increases generated workloads in excess of process capacity, leading to a backlog of applications. In response, NPB developed an action plan to enhance productivity in the short-term and to establish sustainability for the pardon program in the long-term. This plan calls for a wide range of improvements, including: policy refinement; technological advancements; process streamlining; creation of a team to eliminate the backlog of the applications; removal of the cap on the amount of revenues from user fees that NPB can access yearly; establishment of service standards for application processing; and increasing the user fee to align it with current operational and program realities.
NPB charges a $50.00 user fee for the processing of pardon applications. The Board may access 70% of revenues collected. The RCMP has access to 30% of user fees collected. Fees do not represent the full cost of a pardon. The fee was set at $50.00 so as not to serve as an impediment for Canadians who wish to benefit from a pardon.
| Program Area | Priorities/Commitments | Recent Progress |
|---|---|---|
|
|
|
|
||
|
The Criminal Records Act (CRA) authorizes the Board to: grant pardons for offences prosecuted by indictment, if it is satisfied the applicant is of good conduct, and is conviction-free for five years; and issue pardons for summary convictions, following a conviction free period of three years. In 2007-08, the average processing time for all pardons was 10 months. For cases involving summary convictions only, the average process time was six weeks.
| Decision | 2002-03 | 2003-04 | 2004-05 | 2005-06 | 2006-07 | 2007-08 | ||||||
|---|---|---|---|---|---|---|---|---|---|---|---|---|
| # | % | # | % | # | % | # | % | # | % | # | % | |
| Granted | 7,204 | 49 | 8,761 | 55 | 17,800 | 78 | 3,951 | 46 | 7076 | 47 | 14,514 | 58 |
| Issued | 7,232 | 49 | 6,832 | 43 | 4,745 | 21 | 4,402 | 51 | 7672 | 52 | 10,332 | 41 |
| Sub-Total | 14,436 | 98 | 15,593 | 98 | 22,545 | 98 | 8,353 | 98 | 14,748 | 99 | 24,846 | 99 |
| Denied | 286 | 2 | 265 | 2 | 375 | 2 | 196 | 2 | 103 | 1 | 175 | 1 |
| Total | 14,722 | 100 | 15,858 | 100 | 22,920 | 100 | 8,549 | 100 | 14,851 | 100 | 25,021 | 100 |
| Average Process Time | 17 months | 17 months | 12 months | 11 months | 13 months | 10 months | ||||||
The pardon revocation/cessation rate remains less than 4%, demonstrating that most people remain crime free after receipt of a pardon. The CRA includes two categories of revocation. The first is for offences that the court dealt with summarily. The Board reviews these cases and assesses the need to revoke. The second involves automatic revocation for an indictable offence. For this category, the RCMP notifies the Board of the offence, and the pardon ceases to exist.
| Period | Cumulative Pardons Granted/Issued to Date | Pardons Revoked / Ceased during the Year | Cumulative Pardons Revoked/Ceased | Cumulative Revocation/Cessation Rate (%) |
|---|---|---|---|---|
| 2003/04 | 306,985 | 1,314 | 10,594 | 3.45 |
| 2004/05 | 329,530 | 557 | 11,151 | 3.38 |
| 2005/06 | 337,883 | 456 | 11,607 | 3.44 |
| 2006/07 | 352,631 | 2397 | 14,004 | 3.97 |
| 2007/08 | 377,477 | 581 | 14,585 | 3.86 |
Lessons learned – sustainability for the pardon program:
Heavy and growing workloads related to pardons pointed clearly to the need for NPB to develop a resource management tool that would facilitate the development of resource needs for various workload scenarios. In response, the Board developed a resource formula, based on analysis of extensive operational data that will enable it to improve planning and program delivery. In particular, the formula will prove very useful in enabling the Board to ensure that it has sufficient capacity to process applications, consistent with the service standards that are being developed.
Strategic Management Priorities
For 2007-08, the Board continued work on two strategic management priorities that support all of its program activities. The first involves integrated business and human resource planning to ensure that the Board has sufficient numbers of Board members and staff, with the knowledge and skills to meet program needs. Entering 2007-08, the Board faced a significant shortage of Board members to meet conditional release decision-making workloads. In response, the Board developed a contingency plan designed to limit workloads, while maximizing the availability of Board members for decision-making purposes. Implementation of the contingency plan continued through the first six months of 2007-08 and proved successful. Despite limited resource capacity, the Board was able to meet workload demands. The Board also took action to deal with significant turnover among key staff. Implementation of the Board’s succession plan continued to ensure that the quality of program delivery was not jeopardized by the loss of significant corporate memory and experience.
The second strategic management priority focused on the Board’s new partnership arrangement with the Correctional Service of Canada in which the Board transferred $2.9 million annually to the Service in return for the provision of information technology services. In this, partnership arrangement, the Board sets its information technology priorities and user needs. The Service provides a range of services including desk top support, network maintenance and support, technical aspects of system development, and system support. During 2007-08, work related to the partnership dealt with governance and effective consultation processes. Throughout the year, CSC provided effective technology services for the Board.