
Treasury Board of Canada Secretariat
www.tbs-sct.gc.ca
Common menu bar links
Breadcrumb Trail
ARCHIVED - Public Service Labour Relations Board - Report
 This page has been archived.
Archived Content
Information identified as archived on the Web is for reference, research or recordkeeping purposes. It has not been altered or updated after the date of archiving. Web pages that are archived on the Web are not subject to the Government of Canada Web Standards. As per the Communications Policy of the Government of Canada, you can request alternate formats on the "Contact Us" page.
Section III: Supplementary Information
Financial Highlights
| % Change | 2010-11 | Restated 2009-10 |
|
|---|---|---|---|
| Total Assets | -33% | 1,587,787 | 2,385,137 |
| Total Liabilities | -10% | 3,077,150 | 3,400,996 |
| Equity of Canada | 47% | (1,489,363) | (1,015,859) |
| Total | -33% | 1,587,787 | 2,385,137 |
| % Change | 2010-11 | 2009-10 | |
|---|---|---|---|
| Total Expenses | 1% | 15,074,302 | 14,882,820 |
| Total Revenues | -100% | 0 | 64 |
| Net Cost of Operations | 1% | 15,074,302 | 14,882,756 |
Financial Highlights Charts/Graphs
Spending Distribution by Service
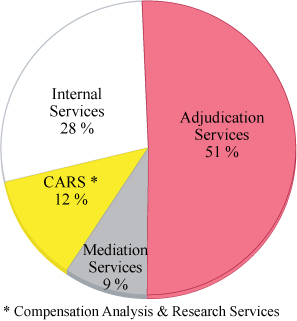
The PSLRB’s total financial expenses for 2010-11 were $15.1 million. The majority of the funds, $7.6 million (51%), were spent on adjudication services; compensation analysis and research services represented $1.8 million (12%) of the total expenses, and mediation services represented $1.4 million (9%) of the total expenses. Internal services represented $4.2 million (28%) of the total expenses.
Spending Distribution by Type
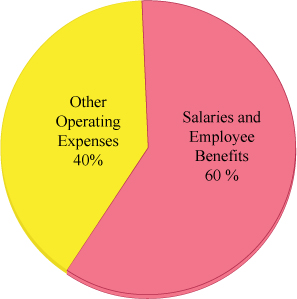
Total expenses for the PSLRB were $15.1 million in 2010-11, of which $9.1 million (60%) was spent on salaries and employee benefits. The remaining $6.0 million (40%) was spent on other operating costs such as transportation costs, professional services fees, accommodation costs, and costs for hearings and mediation facilities.
Financial Statements
For further details, consult the PSLRB’s financial statements, which can be found on its website at: http://www.pslrb-crtfp.gc.ca/reports/intro_e.asp.
All electronic supplementary information tables found in the 2010-11 Departmental Performance Report can be found on the Treasury Board of Canada Secretariat’s website at: http://www.tbs-sct.gc.ca/dpr-rmr/2010-2011/index-eng.asp.
Internal Audits and Evaluations
- Horizontal Internal Audit of Information Technology Asset Management in Small Departments and Agencies
Section IV: Other Items of Interest
Organizational Contact Information
Public Service Labour Relations Board
P.O. Box 1525, Station B
Ottawa, Ontario, Canada
K1P 5V2
Tel: 613-990-1800
Toll free: 866-931-3454
Fax: 613-990-1849
| General: | Fax: 613-990-1813 |
| Registry Operations and Policy: | Fax: 613-990-3927 |
| Dispute Resolution Services: | Fax: 613-990-9157 |
| Website: | www.pslrb-crtfp.gc.ca |
Email: mail.courrier@pslrb-crtfp.gc.ca
Additional Information
Appendix A
Supplementary Performance Information
Expected Results
1) Parties before the PSLRB receive a timely and fair resolution of their case
i) Performance indicator: Based on Client Satisfaction Survey data, percentage of clients who are satisfied with the Board’s services with respect to timeliness and fairness
Performance data:
- 67% were satisfied/very satisfied with the scheduling of hearings
- 60% were satisfied/very satisfied with postponements
- 55% were satisfied/very satisfied with the timely issuing of decisions
- 85% were satisfied/very satisfied with the timeliness of mediation services
- 91% were satisfied/very satisfied with the timeliness of information provided by the Registry
- 84% were satisfied/very satisfied with the opportunity to present their case
- 79% were satisfied/very satisfied with procedural fairness
Source: 2010 Client Satisfaction Survey
2) Dispute-related issues are fully or partially resolved through mediation interventions
i) Performance indicator: Percentage of mediation efforts in relation to grievances or complaints that fully resolve issues
Performance data:
- 81% of cases are fully resolved*
*Calculated as the percentage of the total number of completed mediation interventions (86) that were settled or withdrawn (70)
ii) Performance indicator: Success rate of preventive mediation cases (defined as a case not related to an adjudication case before the Board)
Performance data:
- 89% of cases are fully resolved*
*Calculated as the percentage of the total number of preventive mediation interventions (18) that were settled or withdrawn (16)
Outputs
Decisions on applications, complaints and grievances
i) Performance indicator: Percentage of decisions issued within four months of the last day of the hearing or other proceeding
Performance data: For decisions tracked during the 2010 calendar year, the average time for decisions to be issued was 1.8 months. Out of 126 decisions that were issued, the standard was met 86% of the time. A further 2.5% were issued within 5 months and a further 1.5% within 6 months of the last day of the hearing.
Target: 75%
Date to achieve target: 31/03/2011
ii) Performance indicator: Among decisions sent for judicial review, percentage of challenges upheld in relation to the total number of decisions issued over a 5-year period.
Performance data: 3%
Seventeen (17) applications were allowed out of a total of 651 decisions rendered over the 5-year period from April 1, 2006 to March 31, 2011
Target: 2%
Date to achieve target: 31/03/2011
Management of cases
i) Performance indicator: Compliance rate with service standards for case management
Performance data: Notices of hearings were sent to the parties within 1 month (31 days) prior to the first day of the hearing 70% of the time and were sent within 25 days 100% of the time. Decisions were delivered to the parties within 1 day of being issued by the adjudicator or Board member 100% of the time. New files were acknowledged to the parties within 7 working days 98% of the time.
Target: 80%
Date to achieve target: 31/03/2011
ii) Performance indicator: Percentage of adjudication cases closed during a year over the total number of new cases received during the same year
Performance data: During 2010-11, 3774 cases were carried over from the previous fiscal year. Two thousand, one hundred and eight (2108) new cases were received and 1487 were closed. Four thousand, three hundred and ninety-five (4395) cases will be carried over into 2011-12. Overall, 29% fewer cases were closed than were received during the year.
Target: 10%
Date to achieve target: 31/03/2011
Mediation in the negotiation and renewal of collective agreements, the management of relations resulting from the implementation of collective agreements, and in relation to grievances, complaints and other proceedings
i) Performance indicator: Percentage of grievance and complaint cases where the parties involved agreed to proceed with mediation efforts
Performance data: Parties agreed to proceed with mediation in 12% of new cases*.
*Calculated as the percentage of the total number of new 2010-11 cases referred to mediation (1463), in which the parties agreed to mediation (177).
Target: 50%
The PSLRB has no control over and cannot reasonably be expected to influence the parties’ desire to proceed with mediation, should either party not wish to. Given the voluntary nature of mediation, the PSLRB will revisit this indicator in future years.
Date to achieve target: 31/03/2011
ii) Performance indicator: Percentage of collective bargaining mediations that reduce outstanding issues
Performance data: 100%*
*In 2010-11, there was 1 collective bargaining mediation that resulted in a settlement of all outstanding issues.
Target: 50%
Date to achieve target: 31/03/2011
Conciliation and arbitration services
i) Performance indicator: Percentage of processes to establish public interest commissions and arbitration boards that are initiated within 5 business days of receiving all appropriate documentation
Performance data: 100%
Target: 100%
Date to achieve target: 31/03/2011
Appendix B
Grievances, Complaints and Applications Before the Public Service Labour Relations Board 2010-11
| Number of cases brought forward from previous years | Number of new cases received | Total number of cases | Number of cases closed (includes cases settled, withdrawn and decided) | Number of cases carried forward to 2011-2012 | Decisions or orders | ||
|---|---|---|---|---|---|---|---|
| Settled & withdrawn | decided | ||||||
| Individual | 2452 | 1672 | 4148 | 323 | 155 | 3574 | 73 |
| Group | 16 | 0 | 0 | 36 | 0 | ||
| Policy | 8 | 8 | 33 | 19 | 3 | ||
| Total grievances | 2452 | 1696 | 4148 | 519 | 3629 | 76 | |
| Complaints of unfair labour practices - Duty of fair representation |
146 | 25 | 200 | 42 | 52 | 32 | 17 |
| - Other | 29 | 74 | |||||
| Complaints under the Canada Labour Code | 28 | 7 | 35 | 8 | 2 | 25 | 3 |
| Total complaints | 174 | 61 | 235 | 104 | 131 | 20 | |
| Request to file certified copy of order with Federal court | 0 | 2 | 2 | 1 | 1 | 1 | |
| Certifications | 0 | 1 | 1 | 1 | 0 | 1 | |
| Revocations of certification | 0 | 1 | 1 | 1 | 0 | 1 | |
| Determination of successor rights | 0 | 0 | 0 | 0 | 0 | 0 | |
| Membership in a bargaining unit | 7 | 4 | 11 | 4 | 7 | 1 | |
| Designation of essential services positions | 7 | 0 | 7 | 3 | 4 | 4 | |
| Applications for review of Board decisions | 3 | 10 | 13 | 7 | 6 | 7 | |
| Requests for extension of time | 26 | 20 | 46 | 18 | 28 | 6 | |
| Subtotal applications1 | 43 | 38 | 81 | 35 | 46 | 21 | |
| Determination of management and confidential positions | 303 | 311 | 614 | 185 | 429 | 3722 | |
| Other applications (not specified above) | 802 | 2 | 804 | 644 | 160 | N/A3 | |
| Total applications | 1148 | 351 | 1499 | 864 | 635 | 3933 | |
| TOTAL | 3774 | 2108 | 5882 | 1487 | 4395 | 4893 | |
1 This subtotal excludes the work done on managerial and confidential exclusion proposals.
2 In all cases, the determinations were made by an order rendered by the PSLRB on consent.
3The total number of decisions/orders does not include those issued for “other applications.”
Appendix C
Synopsis of Applications for Judicial Review of Decisions
| Decisions rendered1 | Number of applications | Applications withdrawn | Applications dismissed | Applications allowed | Applications pending2 | Appeals of applications pending3 | |
|---|---|---|---|---|---|---|---|
| YEAR 1 (April 1, 2006 to March 31, 2007) |
116 | 25 | 9 | 11 | 4 | 1 | 0 |
| YEAR 2 (April 1, 2007 to March 31, 2008) |
112 | 23 | 8 | 9 | 6 | 0 | 0 |
| YEAR 3 (April 1, 2008 to March 31, 2009) |
114 | 24 | 4 | 18 | 2 | 0 | 0 |
| YEAR 4 (April 1, 2009 to March 31, 2010) |
183 | 30 | 11 | 15 | 3 | 1 | 0 |
| YEAR 5 (April 1, 2010 to March 31, 2011) |
126 | 25 | 0 | 1 | 2 | 22 | 1 |
| TOTAL | 651 | 127 | 32 | 54 | 17 | 24 | 1 |
1 Decisions rendered do not include cases dealt with under the expedited adjudication process and Managerial Exclusion Orders issued by the Board upon consent of the parties.
2 Applications that have yet to be dealt with by the Federal Court. Does not include appeals pending before the Federal Court of Appeal or the Supreme Court of Canada.
3 Results of appeals disposed of have been integrated into the statistics in this table.
Note: The figures for the last four fiscal years are not final, as not all the judicial review applications filed in those years have made their way through the court system.