
Treasury Board of Canada Secretariat
www.tbs-sct.gc.ca
Common menu bar links
Breadcrumb Trail
ARCHIVED - Canadian Heritage - Report
 This page has been archived.
Archived Content
Information identified as archived on the Web is for reference, research or recordkeeping purposes. It has not been altered or updated after the date of archiving. Web pages that are archived on the Web are not subject to the Government of Canada Web Standards. As per the Communications Policy of the Government of Canada, you can request alternate formats on the "Contact Us" page.
Section III: Supplementary Information
Financial Highlights
The financial highlights presented within this Departmental Performance Report are intended to serve as a general overview of Canadian Heritage financial position and operations. The unaudited financial statements are prepared in accordance with accrual accounting principles. The supplementary information presented in the financial tables in this report was prepared on a modified cash basis of accounting to be consistent with appropriations-based reporting.
| % Change | 2010-11 | 2009-10 | |
|---|---|---|---|
| Total Assets | -8% | 531,043 | 580,098 |
| Total Liabilities | -9% | 552,844 | 605,109 |
| Total Equity of Canada | -13% | (21,801) | (25,011) |
| Total Liabilities and Equity of Canada | -8% | 531,043 | 580,098 |
| % Change | 2010-11 | 2009-10 | |
|---|---|---|---|
| Total Expenses | -10% | 1,332,152 | 1,482,036 |
| Total Revenues | 6% | 73,041 | 69,066 |
| Net Cost of Operations | -11% | 1,259,111 | 1,412,970 |
Financial Highlights Charts/Graphs
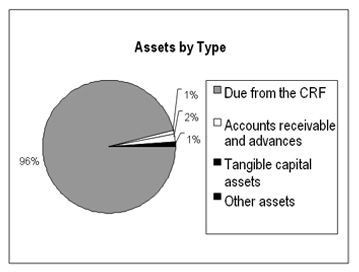
Total assets were $531 million at the end of 2010-11, a decrease of $49 million (8%) over the previous year’s total assets of $580 million.
The amount due from the Consolidated Revenue Fund (CRF) represented the largest portion of assets at $508 million or 96% of total assets.
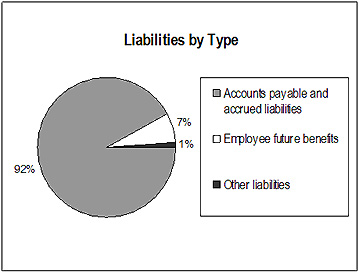
Total liabilities were $553 million at the end of 2010-11, a decrease of $52 million (9%) over the previous years’ total liabilities of $605 million.
Accounts payable and accrued liabilities represented the largest portion of liabilities at $508 million or 92% of total liabilities.
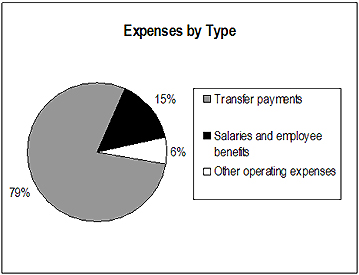
The Department’s total expenses were $1,332 million in 2010-11, a decrease of $150 million (10%) versus the previous year’s total expenses of $1,482 million.
Major expense areas included transfer payments ($1,049 million or 79%) and salaries and employee benefits ($202 million or 15%).
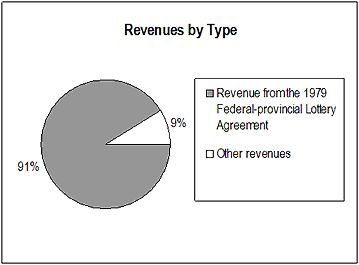
The Department’s total revenues were $73 million in 2010-11, an increase of $4 million (6%) versus the previous year’s total revenues of $69 million.
The revenue from the 1979 Federal-provincial Lottery Agreement represented the largest portion of revenues at $66 million or 91% of the total revenues.
Financial Statements
Full unaudited Financial Statements of the Department of Canadian Heritage for 2010-11, including the Statement of Management Responsibility Including Internal Control over Financial Reporting, are available at: http://www.pch.gc.ca/pc-ch/publctn/dpr-10-11-eng.cfm.
Canadian Heritage Portfolio
The Portfolio Affairs Office's responsibilities remained unchanged regarding existing portfolio agencies. However, in 2010-11, the addition of the Canadian Museum of Immigration at Pier 21 has increased the number of organizations in the Canadian Heritage Portfolio from 19 to 20.
The Portfolio Affairs Office assists the Minister and the Deputy Minister in carrying out their portfolio responsibilities and supporting the Government’s agenda. Its objective is to integrate horizontal policy issues, planning, reporting, allocation of financial resources, central agencies coordination, appointments, governance and strategic communications related to the Canadian Heritage Portfolio organizations.
List of Supplementary Information Tables
All electronic supplementary information tables found in the 2010-11 Departmental Performance Report can be accessed on the Treasury Board of Canada Secretariat’s website at: http://www.tbs-sct.gc.ca/dpr-rmr/2010-2011/index-eng.asp .
- Details on Transfer Payment Programs
- Up-Front Multi-Year Funding
- Horizontal Initiatives
- Green Procurement
- Internal Audits and Evaluations
- Sources of Respendable and Non-Respendable Revenue
- User Fees Reporting
- Response to Parliamentary Committees and External Audits
Section IV: Other Items of Interest
Organizational Contact Information
| Address: | Canadian Heritage 15 Eddy Street Gatineau, Quebec K1A 0M5 |
| Email: | info@pch.gc.ca |
| Telephone: | 819-997-0055 |
| Toll-free*: | 1-866-811-0055 |
| TTY** (Toll-free): | 1-888-997-3123 |
*The toll-free lines have agents available to answer your questions, Monday to Friday, 8:30 a.m. to 5:00 p.m. (Eastern Time).
**The TTY is a telecommunication device for people who are deaf, hard of hearing, or speech-impaired.
Other Items of Interest
- Legislation related to Canadian Heritage
- Portfolio Crown corporations and other organizations
- Regional offices
[1] “Type” is categorized as follows: Previously committed to—committed to in the first or second fiscal year before the subject year of the report; Ongoing—committed to at least three fiscal years before the subject year of the report; and New—newly committed to in the reporting year of the Departmental Performance Report.
[2] "Available liability" refers to the total amount of contingent liability that is available for allocation among institutions for the fiscal year, taking into account the maximum total that can be allocated each year under the Canada Travelling Exhibitions Indemnification Act ($1.5 billion) and any commitments carried over from the previous fiscal year.
[3] Data is not final until the release of the Program’s annual report. Numbers may not add up due to rounding. The CMF annual report for 2010-11 will be available at www.cmf-fmc.ca.
[4] More information is available in Section II of this report, under the Internal Services component.
[5] More information on this department-wide initiative is available in Section II of this report, under the Internal Services component.
[6] Financial Resources equal the total line for Program Activities and Internal Services.
[7] Canadian Fitness and Lifestyle Research Institute (2009). Sport Participation Rates in Canada. 2009 Physical Activity Monitor: Facts and Figures Bulletin Series. Bulletin #8
[8] Commencing in the 2009–10 Estimates cycle, the resources for Program Activity: Internal Service is displayed separately from other program activities; they are no longer distributed among the remaining program activities, as was the case in previous Main Estimates. This has affected the comparability of spending and FTE information by Program Activity between fiscal years.
[9] Description of Strategic Outcome 1 is available in 2010-11 Canadian Heritage Report on Plans and Priorities at: http://www.tbs-sct.gc.ca/rpp/2010-2011/inst/pch/pch02-eng.asp#2.1
[10] Department of Canadian Heritage analysis of the annual survey of the National Arts Training Contribution Program-funded institutions.
[11] As per the Department of Canadian Heritage’s analysis of program data for 2009-10.
[12] The Program started capturing the information in 2005-06.
[13] Canadian Media Production Association, Profile 2010: An Economic Report on the Screen-Based Production Industry in Canada, 2010, Exhibit 2-52, p. 52.
[14] Canadian Advertising Rates and Data. Accessed online May 30, 2011. www.cardonline.ca
[15] Department of Canadian Heritage analysis of data provided by the Canadian Music Industry Database and Quebec Collective Society for the Rights of Makers of Sound and Video recordings (SOPROQ).
[16] Canadian Media Production Association, Profile 2010: An Economic Report on the Screen-Based Production Industry in Canada, 2010, p. 4.
[17] Canadian Advertising Rates and Data. Accessed online May 30, 2011. www.cardonline.ca
[18] Statistics Canada, Survey of Book Publishers – 2009, Table 1. Accessed online http://www.statcan.gc.ca/pub/87f0004x/2011001/t027-eng.htm
[19] Statistics Canada, Sound Recording and Music Publishing, Catalogue no. 87F0008X, Table 2: Summary statistics for the music publishing industry, Canada, 2007 to 2009. Accessed online http://www.statcan.gc.ca/bsolc/olc-cel/olc-cel?catno=87F0008X&lang=eng
[20] Statistics Canada, Film and Video Post-production 2009. Accessed online http://www.statcan.gc.ca/bsolc/olc-cel/olc-cel?catno=87-009-X&lang=eng. Statistics Canada, Film and Video Distribution 2009. Accessed online http://www.statcan.gc.ca/bsolc/olc-cel/olc-cel?catno=87F0010X&lang=eng Statistics Canada, Motion Pictures Theatres 2009. Accessed online http://www.statcan.gc.ca/bsolc/olc-cel/olc-cel?catno=87F0009X&lang=eng
[21] Canadian Interactive Alliance, Canadian Interactive Industry Profile, 2008, p. 24.
[22] Interactive Advertising Bureau of Canada, Internet Revenue Survey, August 10, 2010. Accessed online http://www.iabcanada.com/pr-news/2009-internet-revenue-survey.
[23] Statistics Canada, Canadian Internet Use Survey, 2010. Accessed online http://www.statcan.gc.ca/daily-quotidien/110525/dq110525b-eng.htm.
[24] Canadian Radio-television Telecommunications Commission, Communications Monitoring Report 2010, Table 4.2.1.
[25] TV5 Qu�bec Canada Yearly Activity Report.
[26] Department of Canadian Heritage analysis of 2010 Nielsen SoundScan Top 2000 Chart.
[27] Statistics Canada, Survey of Book Publishers -2008, Catalogue no. 87F0004x. Accessed online http://www.statcan.gc.ca/pub/87f0004x/87f0004x2010001-eng.htm.
[28] Canadian Radio-television Telecommunications Commission, Communications Monitoring Report 2010, Table 4.3.6.
[29] Canadian Radio-television Telecommunications Commission, Communications Monitoring Report 2010, Table 4.3.6.
[30] TV5 Market share reports updated to Spring 2011.
[31] Analysis by the Department of Canadian Heritage of data from Motion Picture Theatre Associations of Canada.
[32] Analysis by the Department of Canadian Heritage of data from Nielsen VideoScan.
[33] Analysis by the Department of Canadian Heritage of data from Rentrak.
[34] Canada Community Newspaper Association, Circulation Report, Special Request, August 2010 and Hebdos Qu�bec, Portrait de la presse hebdomadaire au Qu�bec en 2010, June 2010
[35] Society of Composers, Authors and Music Publishers of Canada, SOCAN 2009 and 2008 Financial Reports, p. 5. Accessed online http://www.socan.ca/pdf/pub/FinancialReport2009.pdf.
[36] TV5 Monthly programming logs, 2010.
[37] Detailed information about Bill C-32: The Copyright Modernization Act is available at: http://www.balancedcopyright.gc.ca
Information about the Bill C-32 Legislative Committee, including the committee membership and transcripts of meeting proceedings, are available at: http://www.parl.gc.ca/committeebusiness/CommitteeHome.aspx?Cmte=CC32&Language=E&Mode=1&Parl=40&Ses=3.
[38] Consultation on the Implementation of Canada’s Policy on Audiovisual Treaty Coproduction is available at http://coproduction.pch.gc.ca/en/home/.
[39] Please refer to Priority 1 (Section I) for more details.
[40] Consultations that informed the development of the Canada Periodical Fund are available at: www.canadianheritage.gc.ca/pc-ch/conslttn/fcm-cmf/index-eng.cfm.
[41] Description of Strategic Outcome 2 is available in 2010-11 Canadian Heritage Report on Plans and Priorities at: http://www.tbs-sct.gc.ca/rpp/2010-2011/inst/pch/pch02-eng.asp#2.2
[42] Strategic Counsel/Globe and Mail/CTV (2009) Attitudes about Canada.
[43] World Values Survey Association (2011) Values Surveys Databank – 2006 Canada Data.
[44] Statistics Canada (2008) General Social Survey, Cycle 22.
[45] Association for Canadian Studies/L�ger Marketing (2010) Canada’s ‘Very Attached’: Quebecers push language over nation amongst markers of identity to which Canadians are most attached.
[46] Environics (2010) Focus Canada.
[47] Given that the results from participant surveys for a specific fiscal year are only made available the following fiscal year in September, statistics provided here reflect the 2009-10 survey results.
[48] Online version of the Summative Evaluation of the Exchanges Canada Program (2010) is available at: http://www.pch.gc.ca/pgm/em-cr/evaltn/2010/2010-03-1/index-eng.cfm
[49] For more information on the Roadmap, please see the horizontal initiatives tables on the following website: http://www.tbs-sct.gc.ca/rpp/2010-2011/inst/pch/st-ts04-eng.asp.
[50] During fall 2008, the study of old agreements and options to determine the format for future agreements was undertaken and discussions with spokespersons of the association movement on the options for improving the content of new agreements were conducted.
[51] Description of Strategic Outcome 3 is available in 2010-11 Canadian Heritage Report on Plans and Priorities at: http://www.tbs-sct.gc.ca/rpp/2010-2011/inst/pch/pch02-eng.asp#2.3
[52] Canadian Fitness and Lifestyle Research Institute (2009). Sport Participation Rates in Canada. 2009 Physical Activity Monitor: Facts and Figures Bulletin Series. Bulletin #8.
[53] This 2009 study examines local opportunities in the community for physical activity and sport, including availability, usage, importance and satisfaction with facilities and programs, availability and type of information, and social norms for walking. This report also includes adult sport participation data.
[54] Statistics Canada. Sport Participation in Canada (2005). Culture, Tourism and the Centre for Education Statistics Division. Research paper.
[55] Statistics Canada. (2003). Ethnic Diversity Survey: a portrait of Multicultural Society. Ottawa, Canada p. 14.
[56] Strengthening Canada: The Socio-economic Benefits of Sport Participation in Canada: 2005 Report. Ottawa, Canada p.36.
[57] Op. Cit. Strengthening Canada: p. 9.
[58] Op. Cit. Strengthening Canada: p. iii, iv.
[59] The delayed release of the “2010 and Beyond Panel” report delayed the start of the Sport Excellence Strategy’s renewal process. As a result, formal implementation of the renewed Strategy did not occur in 2010-11. However work in the area of high performance continued in the spirit of the original Strategy; specifically, a focus on achieving podium results at the Olympic and Paralympic Games.
[60] Participation number includes 2009-10 data from the Federal-Provincial/Territorial Sport Participation Bilateral Agreements as year-end activity report are due in June 2011. In addition, not all 2010-11 reports are available to Sport Canada to date.
[61] Comparable information is not available for Canadian Sport Centres.