Common menu bar links
Breadcrumb Trail
ARCHIVED - Hazardous Materials Information Review Commission - Report
 This page has been archived.
Archived Content
Information identified as archived on the Web is for reference, research or recordkeeping purposes. It has not been altered or updated after the date of archiving. Web pages that are archived on the Web are not subject to the Government of Canada Web Standards. As per the Communications Policy of the Government of Canada, you can request alternate formats on the "Contact Us" page.
Section II: Analysis of Program Activities by Strategic Outcome
Performance Status Legend
Exceeded: More than 100 per cent of the expected level of performance (as evidenced by the indicator and target or planned activities and outputs) for the expected result identified in the corresponding RPP was achieved during the fiscal year.
Met All: 100 per cent of the expected level of performance (as evidenced by the indicator and target or planned activities and expected outputs) for the expected result identified in the corresponding RPP was achieved during the fiscal year.
Mostly Met: 80 to 99 per cent of the expected level of performance (as evidenced by the indicator and target or planned activities and expected outputs) for the expected result identified in the corresponding RPP was achieved during the fiscal year.
Somewhat Met: 60 to 79 per cent of the expected level of performance (as evidenced by the indicator and target or planned activities and outputs) for the expected result identified in the corresponding RPP was achieved during the fiscal year.
Not Met: Less than 60 per cent of the expected level of performance (as evidenced by the indicator and target or planned activities and outputs) for the expected result identified in the corresponding RPP was achieved during the fiscal year.
Strategic Outcome
Trade secret exemptions are provided in a way that balances the right of industry to protect their confidential business information with the right of workers to receive accurate information concerning the health and safety hazards posed by chemicals in the workplace.
Program Activity
Claims Exemption Process
Program Activity Description
Under this activity, HMIRC registers claims for exemption received from a supplier or employer who wishes to withhold confidential business information, decides on the validity of the claim, adjudicates and issues decisions on the compliance of the material safety data sheet or label to which the claim relates, and administers an appeal process to these decisions.
| Planned Spending | Total Authorities | Actual Spending |
|---|---|---|
| 4,232 | 4,216 | 3,306 6 |
6 The difference in spending reflects the first year of reporting separately on the Program Activity and Internal Services. See Internal Services below.
| Planned | Actual | Difference |
|---|---|---|
| 39 | 32 | 7 7 |
7 The difference in FTEs reflects the use of temporary help services due to the difficulty in recruiting qualified biologists with a specialization in toxicology, an identified shortage group in the public service.
| Expected Results |
Performance Indicators |
Targets | Performance Status |
|---|---|---|---|
| Claimants are able to sell their products without disclosing confidential business information within an appropriate amount of time | Percentage of claims registered within 7 days | 100% | 100% Met All |
| Workers are provided with corrected health and safety information within an appropriate amount of time | Percentage of claims for which the elapsed time between the registration of the claim and the issuance of the decision is within the target period | 90% within 365 days | 45% Not Met Percentage is lower than targeted due to rendering decisions on older claims from the backlog; the backlog was eliminated, as planned, by 31 March 2011. |
| Disputes are resolved prior to appeal | Percentage of disputes resolved prior to appeal | 100% | 100% Met All |
Performance Summary and Analysis of Program Activity
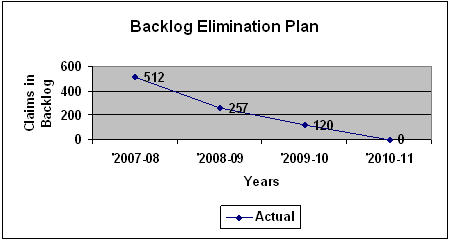
The Commission's Program Activity, the Claim Exemption Process, successfully completed the three-year Claims Elimination Plan (See Table 1 on following page). Elimination of the backlog of 512 claims from 2008 will significantly reduce the time between registering a claim and issuing a decision, providing workers earlier access to corrected health and safety information.
Table 1

In 2010-2011 the program registered 100% of claims with complete information within 7 days. This allowed claimants to sell their products in a timely manner while protecting confidential business information. The Commission showed a modest improvement in the percentage of claims reviewed within 365 days; the performance status noted above reflects decisions rendered on old claims from the backlog as well as on new claims.
Claims processing activity in 2010-11 is reflected in Table 2 below which provides detail on the number of claims at various points of the process. During this time, 312 new claims were registered with the Commission and 381 claims were processed by Commission staff via decisions (365) or withdrawals (16).
| 2010-11 Claims processing activity | Number of claims |
|---|---|
| Claims registered in 2010-11 | 312 |
Claims processed in 2010-11
|
381 |
| Claims in queue at 31 March 2011 | 323 |
Undertakings were initiated in revised legislation in 2008 to allow claimants to voluntarily correct errors and violations in MSDSs submitted with their claims. If claimants agree to changes requested by the Commission and resubmit an approved MSDS within the period specified in the undertaking, a decision is rendered and published that the MSDS is compliant. When claimants resubmit the MSDS, they also send it out to their clients who purchase substances and employ workers; in this way compliant health and safety information is provided earlier to Canadian workers. This effectively reduces the number of orders issued by the Commission.
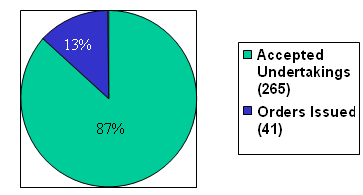
A review of data for voluntary undertakings by claimants in Chart 1 shows a significant number are taking advantage of this option. In 2010-11, 265 claimants or 87% who were originally assessed with non-compliant MSDSs, chose to voluntarily correct them mid way through the assessment process rather than wait for the Commission to order changes.
Chart 1: Early Compliance through Voluntary Undertakings

The Commission continues to monitor and correct violations identified in MSDSs. Priority is assigned to claims using criteria based on the nature of the identified hazards of the product. Table 3 shows the trend over the last three years: a reduction in the total percentage of violations. Corrections made to accurately reflect hazard information on an MSDS can have significant correlation and application to other MSDSs prepared by the same claimant; the Commission would like to more actively promote this use of its expertise.
| Data description | 2008-2009 | 2009-2010 | 2010-2011 |
|---|---|---|---|
| Total violations | 2,861 | 1,085 | 1,251 |
| Total number of claims (decisions issued) | 504 | 240 8 | 365 |
| Average number of violations per claim | 5.7 | 4.5 9 | 3.4 |
8 Results for 2009-10, as previously published in DPR 2009-10, inadvertently recorded data for 13 rather than 12 months. These results have been adjusted from 257 claims to 240, and 4.2 violations per claim to 4.5, in DPR 2010-11.
9 Ibid.
Lessons Learned
Ongoing analysis of the number and type of MSDS violations may provide insight in the development of more proactive compliance measures in the future. The earlier claimants can produce compliant MSDSs, the earlier correct and accurate health and safety information will be available to Canadian workers.
Program Activity
Internal Services
Program Activity Description:
Internal Services are groups of related activities and resources that are administered to support the needs of programs and other corporate obligations of an organization. At HMIRC these groups are: Management and Oversight Services; Communications Services; Human Resources Management Services; Financial Management Services; Information Management Services; Information Technology Services; Acquisition Services; and Travel and Other Administrative Services. Internal Services include only those activities and resources that apply across an organization and not to those provided specifically to a program.
| Planned Spending | Total Authorities | Actual Spending |
|---|---|---|
| 1,472 | 1,757 | 2,760 10 |
| Planned | Actual | Difference |
|---|---|---|
| 15 | 11 | 4 11 |
10 This total includes contracted one-time initiatives undertaken in FY 2010-11 to address the renewal of integrated planning and information technology requirements.
11 The difference in FTEs in Internal Services is due to a review of administrative positions and the use of an interdepartmental MOU.
Performance Summary and Analysis of Program Activity
In 2010-11 the Commission completed the development of its Integrated Plan 2010-12. This plan effectively aligns activities and resources with strategic directions, supports its mandate and includes an evaluation methodology to measure success.
The Commission modernized its internal services to ensure compliance with current federal legislative frameworks based on renewed guiding principles including risk management. This will support decision-making and strengthen management accountability.
The Commission established SWAT to examine workplace issues and make recommendations on improvements in the workplace. Throughout the process, employees were regularly consulted and SWAT presented them with updates to ensure the transparency, accountability and usefulness of its conclusions. At the end of the year SWAT proposed a number of innovative ways to enhance various aspects of the Commission, including clarity of roles and responsibilities, information sharing, orientation and career management.
