Common menu bar links
Breadcrumb Trail
ARCHIVED - National Energy Board - Report
 This page has been archived.
Archived Content
Information identified as archived on the Web is for reference, research or recordkeeping purposes. It has not been altered or updated after the date of archiving. Web pages that are archived on the Web are not subject to the Government of Canada Web Standards. As per the Communications Policy of the Government of Canada, you can request alternate formats on the "Contact Us" page.
Section III: Supplementary Information
Financial Highlights
| % Change | 2010-11 | 2009-10* | |
|---|---|---|---|
| Total Assets | 3.1% | 40,880 | 39,658 |
| Total Liabilities | -23.1% | 15,741 | 20,467 |
| Equity of Canada | 31.0% | 25,139 | 19,191 |
| Total | 3.1% | 40,880 | 39,658 |
*2009-10 restated
During the year, the NEB adopted the revised Treasury Board Accounting Standard (TBAS) 1.2 - Departmental and Agency Financial Statements which is effective for the Board for the 2010-11 fiscal year. The major change in NEB accounting policies required by the adoption of the revised TBAS 1.2 is the recording of amounts due from the Consolidated Revenue Fund as an asset on the Statement of Financial Position.
The most significant change in the Statement of Financial position relates to liabilities and, specifically, Deferred Revenue which represents the balance at year-end of unearned regulatory levies. The NEB cost recovers its annually estimated expenditures on a quarterly basis and recognizes the revenue in the fiscal quarter related to these estimated expenditures. A change in the National Energy Board Cost Recovery Regulations in 2009-10 resulted in a one-time transitional annual billing for the period January to December 2010. One-quarter of this revenue has been recognized in 2009-10 and three-quarters has been recorded as Deferred Revenue related to the 2010-11 fiscal year.
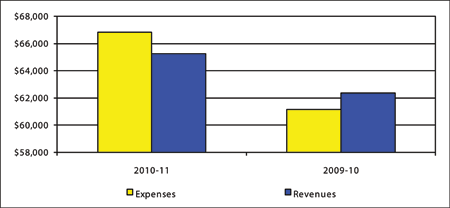
| % Change | 2010-11 | 2009-10 | |
|---|---|---|---|
| Total Expenses | 9.3% | 66,834 | 61,155 |
| Total Revenues | 4.7% | 65,260 | 62,344 |
| Net Cost of Operations | -232.4% | 1,574 | (1,189) |
A change in the accounting treatment for the billing adjustment was implemented during the 2009-10 fiscal period. In previous fiscal periods, the billing adjustment was recognized when invoiced. Beginning in 2009-10, the billing adjustment will be recognized in the period in which the variance arises. In this transition year, the billing adjustment applicable to both 2008 and 2009 was recorded in fiscal year 2010 (2009-10), resulting in a significant increase to revenue and a corresponding decline in 2011 (2010-11). This should stabilize on a go-forward basis and the normal trends expected due to the cost-recovery process will be evident.
Financial Highlights Charts and/or Graphs
Revenues vs. Expenses
(000's)

Text description of this graph
Financial Statements
The NEB’s Financial Statements can be found on the NEB’s website.[13]
List of Supplementary Information Tables
All electronic supplementary information tables found in the 2010–11 Departmental Performance Report can be found on the Treasury Board of Canada Secretariat website.[14]
- Sources of Non-Respendable Revenue
- User Fees Reporting
- Green Procurement
- Response to Parliamentary Committees and External Audits
- Internal Audits and Evaluations
Section IV: Other Items of Interest
Organizational Contact Information
| Address: | National Energy Board 444 Seventh Avenue SW Calgary, Alberta T2P 0X8 |
| Email: | info@neb-one.gc.ca |
| Internet: | http://www.neb-one.gc.ca |
| Telephone: | 403-292-4800 |
| Toll free: | 1-800-899-1265 |
| Fax: | 403-292-5503 |
| Toll free fax: | 1-877-288-8803 |
| TTY (teletype): | 1-800-632-1663 |
Additional Information
NEB Strategic Plan
The NEB’s Strategic Plan is available on the NEB’s website.[15]
NEB Annual Report
For more information on the NEB’s activities in 2010, the NEB’s 2010 Annual Report is available on the NEB’s website.[16]
Footnotes
[1] See Public Accounts of Canada 2010, http://www.tpsgc-pwgsc.gc.ca/recgen/txt/72-eng.html.
[2] Focus on Safety and the Environment, http://www.neb-one.gc.ca/clf-nsi/rsftyndthnvrnmnt/sfty/sftyprfrmncndctr/sftyprfrmncndctr-eng.html
[3] All statistics in this report are reported based on the fiscal year. Statistics in other NEB publications, such as the Annual Report and Safety Performance Indicator reports, are based on the calendar year. This affects comparability of data between publications.
[4] Worker was involved in a motor vehicle accident.
[5] Unauthorized crossing activities include excavation, construction, or other activities which would impede access to, or visibility of, the right of way.
[6] Incidents include serious injuries, unintended gas releases, oil leaks, fires and pipeline ruptures.
[7] NEB Arctic Offshore Drilling Review, http://www.neb-one.gc.ca/clf-nsi/rthnb/pplctnsbfrthnb/rctcffshrdrllngrvw/rctcffshrdrllngrvw-eng.html
[8] NEB Environment Page, http://www.neb-one.gc.ca/clf-nsi/rsftyndthnvrnmnt/nvrnmnt/nvrnmnt-eng.html
[9] Funding Review Committee Reports, http://www.neb-one.gc.ca/clf-nsi/rthnb/pblcprtcptn/prtcpntfndngprgrm/fndngrvwcmmttrprt-eng.html
[10] NEB Public Participation and Land Matters, http://www.neb-one.gc.ca/clf-nsi/rthnb/pblcprtcptn/nvlvngthpblc-eng.html
[11] NEB Energy Reports, http://www.neb-one.gc.ca/clf-nsi/rnrgynfmtn/nrgyrprt/nrgyrprt-eng.html
[12] The Canadian norm comes from Towers Watson’s 2010 Global Workforce Study, which includes a cross section of Canadian industries.
[13] NEB Financial Statements, http://www.neb-one.gc.ca/clf-nsi/rpblctn/rprt/dprtmntlprfrmncrprt/2010-2011fnnclsttmnt-eng.html
[14] See 2010–11 Part III—Departmental Performance Reports (DPR): Supplementary Information (Tables), http://www.tbs-sct.gc.ca/dpr-rmr/2010-2011/index-eng.asp
[15] NEB Strategic Plan, http://www.neb-one.gc.ca/clf-nsi/rthnb/whwrndrgvrnnc/strtgcpln-eng.html
[16] NEB Annual Report, http://www.neb-one.gc.ca/clf-nsi/rpblctn/rprt/nnlrprt/nnlrprt-eng.html
