
Treasury Board of Canada Secretariat
www.tbs-sct.gc.ca
Common menu bar links
Breadcrumb Trail
ARCHIVED - National Energy Board - Report
 This page has been archived.
Archived Content
Information identified as archived on the Web is for reference, research or recordkeeping purposes. It has not been altered or updated after the date of archiving. Web pages that are archived on the Web are not subject to the Government of Canada Web Standards. As per the Communications Policy of the Government of Canada, you can request alternate formats on the "Contact Us" page.
Chair and CEO's Message
I am pleased to present the National Energy Board’s (NEB or the Board) Departmental Performance Report. The NEB is Canada’s federal energy regulator. Our mandate is to regulate pipelines, energy development and trade in the Canadian public interest. Our goals are public and worker safety, environmental protection and efficient energy infrastructure and markets.
In 2010-11, the Board assessed a number of applications for new pipeline facilities, pipeline tolls and tariffs, pipeline abandonment, and requests to resolve interested party complaints about NEB-regulated companies. Of particular note, the Board issued a decision approving the 1,196-km Mackenzie Gas Pipeline through Canada’s Northwest Territories.
The NEB also regulates oil and gas exploration, development, and production in Canada’s North. Until recently, the NEB’s role as the decision-maker for Arctic offshore drilling was not a focus of public attention. This changed suddenly with the blowout in the Gulf of Mexico. In response, the Board announced that it would review its current Arctic safety and environmental offshore drilling requirements. The review is examining the best available information concerning the hazards and risks associated with offshore drilling activities in the Canadian Arctic, and the safety measures to both prevent and respond to accidents and malfunctions. Our final report, to be published by the end of 2011, will identify the information that the Board will require should applications for offshore drilling in the Canadian Arctic be filed in the future.
While the Canadian pipeline industry continues to be a safe method of transporting energy, the Board has noticed an increase in the number and severity of incidents in recent years. Pipeline safety, including the safety of Canadians who build, operate and live near them, is very important to the Board and to Canadians. To understand the reasons behind the recent trend, the Board analyzed over 100 incidents and shared the results at a workshop to discuss incident-reduction strategies. The lessons learned from these discussions will be integrated into the NEB’s ongoing activities and process enhancements.
Following an amendment to the National Energy Board Act, the NEB established a Participant Funding Program to provide financial assistance to support public engagement in oral hearings for facility applications filed under the Act. Through this program, individuals, landowners, not-for-profit organizations and Aboriginal groups affected by pipeline applications can apply for support to participate in hearing processes.
The past year has been one of great change for the National Energy Board. However, it was also a year in which our commitment to continual learning and accountability has served Canadians well. We look forward to continuing to be active and effective in Canada’s pursuit of a sustainable energy future.
Ga�tan Caron
Chair and CEO
Section I: Organizational Overview
Raison d'�tre
The National Energy Board (NEB or the Board) is an independent federal quasi-judicial regulatory tribunal established in 1959 to promote safety and security, environmental protection, and economic efficiency in the Canadian public interest within the mandate set by Parliament for the regulation of pipelines, energy development and trade.
Responsibilities
The main responsibilities of the NEB are established in the National Energy Board Act (NEB Act) and include regulating:
- The construction, operation, and abandonment of pipelines that cross international borders or provincial/territorial boundaries, as well as the associated pipeline tolls and tariffs;
- The construction and operation of international power lines and designated inter-provincial power lines; and
- Imports of natural gas and exports of crude oil, natural gas liquids, natural gas, and electricity.
Additionally, the Board has regulatory responsibilities for oil and gas exploration and production activities on frontier lands not otherwise regulated under joint federal/provincial accords. These regulatory responsibilities are set out in the Canada Oil and Gas Operations Act (COGO Act) and the Canada Petroleum Resources Act. These responsibilities apply to the West Coast offshore, the Northwest Territories, Nunavut, the Arctic offshore, Hudson Bay, parts of the Gulf of St. Lawrence and the Bay of Fundy, and onshore Sable Island.
The NEB has environmental responsibilities under the Canadian Environmental Assessment Act (CEA Act), and the Mackenzie Valley Resource Management Act, as well as under the NEB Act. Certain Board inspectors are appointed Health and Safety Officers by the Minister of Labour to administer Part II of the Canada Labour Code as it applies to NEB-regulated facilities and activities.
The Board also monitors aspects of energy supply, demand, production, development and trade that fall within the jurisdiction of the federal government. The Board reports to Parliament through the Minister of Natural Resources.
Strategic Outcome(s) and Program Activity Architecture (PAA)
The figure below illustrates the NEB’s strategic outcome and program activity architecture. The Board’s program activities and program sub activities all contribute to achieving its strategic outcome.
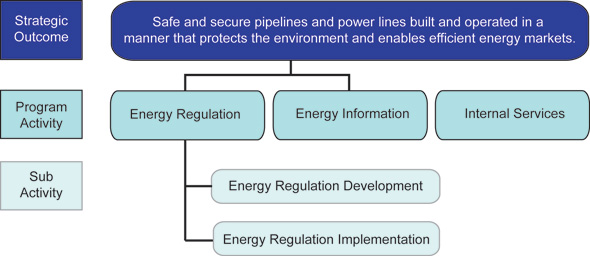
Text description of this graph
Organizational Priorities
Performance/Priority Status Legend
|
Exceeded: More than 100 per cent of the expected level of performance (as evidenced by the indicator and target or planned activities and outputs) for the expected result or priority identified in the corresponding Report on Plans and Priorities (RPP) was achieved during the fiscal year. Met all: 100 per cent of the expected level of performance (as evidenced by the indicator and target or planned activities and expected outputs) for the expected result or priority identified in the corresponding RPP was achieved during the fiscal year. Mostly met: 80 to 99 per cent of the expected level of performance (as evidenced by the indicator and target or planned activities and expected outputs) for the expected result or priority identified in the corresponding RPP was achieved during the fiscal year. Somewhat met: 60 to 79 per cent of the expected level of performance (as evidenced by the indicator and target or planned activities and outputs) for the expected result or priority identified in the corresponding RPP was achieved during the fiscal year. Not met: Less than 60 per cent of the expected level of performance (as evidenced by the indicator and target or planned activities and outputs) for the expected result or priority identified in the corresponding RPP was achieved during the fiscal year. |
| Priority | Type[a] | Strategic Outcome(s) and/or Program Activity(ies) |
|---|---|---|
| Provide a clear and coherent regulatory framework | New | Energy Regulation |
| Status: Mostly met | ||
|
A clear and coherent regulatory framework, with supporting processes and tools, is essential for achieving the NEB’s strategic outcome by communicating the Board’s expectations to NEB-regulated companies.
|
||
[a] “Type” is categorized as follows: Previously committed to—committed to in the first or second fiscal year before the subject year of the report; Ongoing—committed to at least three fiscal years before the subject year of the report; and New—newly committed to in the reporting year of the Departmental Performance Report.
| Priority | Type | Strategic Outcome(s) and/or Program Activity(ies) |
|---|---|---|
| Improve performance of regulated companies | New | Energy Regulation |
| Status: Met all | ||
|
The NEB’s ability to influence the behaviours of NEB-regulated companies in key areas (i.e. safety, environment, public participation, financial integrity, emergency management, and security) significantly contributes to the achievement of its strategic outcome.
|
||
| Priority | Type | Strategic Outcome(s) and/or Program Activity(ies) |
|---|---|---|
| Provide timely regulatory decisions in the Canadian public interest | New | Energy Regulation |
| Status: Mostly met | ||
|
The Board’s ability to provide timely regulatory decisions is a cornerstone of delivering on its strategic outcome by helping to ensure that the rights and interests of those affected by NEB-regulated facilities and activities are respected and to enable efficient energy markets.
|
||
| Priority | Type | Strategic Outcome(s) and/or Program Activity(ies) |
|---|---|---|
| Provide relevant, neutral and credible energy information | New | Energy Information |
| Status: Mostly met | ||
|
Through its Energy Information Program, the NEB provides a range of energy information products to help Canadians better understand energy use in Canada and the Board’s regulatory role.
|
||
| Priority | Type | Strategic Outcome(s) and/or Program Activity(ies) |
|---|---|---|
| Ensure the NEB has the capacity to effectively deliver on its mandate | New | Internal Services |
| Status: Met all | ||
|
Effective management and leadership support the achievement of the NEB’s strategic outcome by enhancing organizational performance.
|
||
Risk Analysis
Organizational Context
In working to achieve its strategic outcome, the NEB must consider the context in which it operates. During 2010-11, the global economic recovery from the recession became more firmly entrenched and Canada’s economic recovery was stronger than expected. The oil industry was robust although the natural gas sector continued to experience historically low levels of activity due to low gas prices.
Crude oil prices climbed from about US$80 per barrel in March 2010 to US$103 per barrel in March 2011. A number of approved pipelines began operations, including Keystone, Enbridge’s Alberta Clipper, the Keystone Cushing Extension, and Enbridge Southern Lights. As well, development plans for several oil sands projects that were put on hold during the economic downturn were reinstated in 2010-11 as the global economic outlook continued to strengthen. During 2010-11, the oil sands were the focus of increased scrutiny from environmental stakeholders as production and activity levels increased.
Natural gas prices did not change from 2009-10, remaining in the range of US$4-5 per MMBtu. This stability was due to the recession’s impact on energy demand and the continued development of unconventional gas resources, including shale gas, throughout North America. Unconventional gas resources, particularly in northeastern British Columbia, continued to be developed in Canada. Pipeline infrastructure to connect this new natural gas supply to the North American pipeline grid moved forward during the year with completion of the Groundbirch pipeline in December 2010 and NEB approval of the Horn River pipeline in January 2011.
Electricity prices increased in both wholesale and end-use markets in 2010-11 as the economy improved. Compared with 2009-10, the weighted average of wholesale power prices in Alberta and Ontario was up by 45 per cent and 30 per cent, respectively. Regulated rates also increased in several other provinces. Demand for electricity increased in Alberta and Ontario, in part due to economic growth (Alberta) and high air conditioning demand in the summer (Ontario). In both provinces, coal-fired generation was reduced. Because of low precipitation in the major hydroelectricity regions (Quebec, British Columbia, Ontario and Manitoba), net-exports of electricity decreased by 40 per cent compared with the previous fiscal year.
Risks, Implications and Strategies
The NEB takes seriously any potential threats to public safety and the environment. In 2010-11, significant oil spills in the United States had immediate and potentially enduring effects on how Canadians regard the safety of energy systems. The level of scrutiny and demand for accountability from Canadian stakeholders has never been higher. Canadians want to be assured that all is being done to prevent similar incidents in Canada. Accordingly, the NEB announced in May 2010 that it would review Arctic safety and environmental drilling requirements. The Board is proactively preparing for future applications and learning from recent oil spills. To conduct this review, work activities were re-prioritized and resources were diverted from other northern projects such as improvements to the legislative framework in the North and the offshore.
Numbers of media requests, Access to Information Act (ATIA) requests and parliamentary appearances by the NEB increased considerably in 2010-11. This level of interest was unprecedented in the history of the Board and required a quick response to meet new demands. The organization developed new ATIA and parliamentary enquiry procedures and assigned additional resources through internal reallocation to process ATIA requests.
To enhance its strategic capacity to deal with new challenges and expectations, the Board initiated a reorganization at the beginning of 2011. Two new executive leadership positions, Strategic Leader–Regulatory and Strategic Leader–Business Integration, were created. A new executive management committee, the Strategic Leadership Group, was also established to enhance the Board’s strategic planning and direction function.
While comparable to recent years, the hearing load for 2010-11 was high from a historical perspective. Board staff participated in significant early engagement work with Aboriginal groups and stakeholders to promote awareness of the NEB’s processes and opportunities for public participation. This early engagement work, combined with the high number of hearings, increased the resources needed for hearings and required flexibility from staff in managing workloads.
Summary of Performance
2010-11 Financial Resources ($ millions)
| Planned Spending | Total Authorities | Actual Spending |
|---|---|---|
| 52.5 | 63.1 | 58.8 |
Please note: Financial Resources should equal the sum of the Total line for Program Activities and Internal Services.
2010-11 Human Resources (full-time equivalents-FTEs)
| Planned | Actual | Difference |
|---|---|---|
| 392.6 | 374.3 | 18.3 |
Please note: Amounts may vary due to rounding
| Performance Indicators | Targets | 2010-11 Performance[b] |
|---|---|---|
| Frequency of disabling injuries and pipeline failures | 0 disabling injuries and 0 pipeline failures; assessed via reported incidents and year by year improvement | Mostly met Disabling injuries: Zero. This is a decrease from three disabling injuries in 2009-10. Fatalities: One.[c] This is an increase from zero fatalities in 2009-10. Pipeline failures: One. This is a decrease from four failures in 2009-10. |
| Frequency of major releases into the environment (Major release = greater than 100m� of liquid hydrocarbon) | 0 releases; assessed via reported incidents and year by year improvement | Met all Major releases >100m�: Zero. This is a decrease from three major releases in 2009-10. |
| Canadian energy and transportation markets are working well |
Adequate oil and natural gas pipeline capacity in place based on pipeline utilization |
Mostly met There was some apportionment on Canadian crude oil pipelines in 2010-11, indicating insufficient capacity. This was due to ruptures on adjacent U.S. crude oil pipelines, which reduced the ability of Canadian crude to reach U.S. markets. This resulted in some production being shut-in. There was adequate capacity on natural gas pipelines and petroleum product pipelines. Oil and gas prices in Canada tracked those in the U.S., indicating that Canadian markets worked well. Pipeline shipper satisfaction averaged 3.48 on a scale of 1 to 5 (1 = very dissatisfied and 5 = very satisfied). This is lower than the average of 3.54 for the previous two survey years. Key areas of concern for shippers were customer service and operational issues; however, 55 per cent of shippers reported being satisfied or very satisfied with service overall. |
[b] All statistics in this report are reported based on the fiscal year. Statistics in other NEB publications, such as the Annual Report and Safety Performance Indicator reports, are based on the calendar year. This affects comparability of data between publications.
[c] Worker was involved in a motor vehicle accident.
| Program Activity | 2009-10 Actual Spending ($ millions) |
2010-11[d] ($ millions) | Alignment to Government of Canada Outcome | |||
|---|---|---|---|---|---|---|
| Main Estimates |
Planned Spending |
Total Authorities[e] |
Actual Spending |
|||
| Energy Regulation | 29.1 | 23.9 | 23.9 | 32.8 | 30.8 | Strong Economic Growth |
| Energy Information | 6.8 | 4.0 | 4.0 | 7.6 | 7.2 | Strong Economic Growth |
| Total | 35.9 | 27.9 | 27.9 | 40.4 | 38.0 | |
[d] Commencing in the 2009–10 Estimates cycle, the resources for Program Activity: Internal Services is displayed separately from other program activities; they are no longer distributed among the remaining program activities, as was the case in previous Main Estimates. This has affected the comparability of spending and FTE information by program activity between fiscal years.
[e] There are variances between planned spending and total authorities/actual spending because planned spending did not include funding received for the NOVA Gas Transmission Ltd. system, the LMCI and the Enhanced Aboriginal Engagement program.
| Program Activity | 2009-10 Actual Spending ($ millions) |
2010-11 ($ millions) | |||
|---|---|---|---|---|---|
| Main Estimates |
Planned Spending |
Total Authorities |
Actual Spending |
||
| Internal Services | 20.3 | 24.6 | 24.6 | 22.7 | 20.8 |
Expenditure Profile
The NEB is funded through parliamentary appropriations. The Government of Canada recovers approximately 90 per cent of the appropriation from the regulated industry. The revenues are deposited directly into the Consolidated Revenue Fund. This process is regulated by the Cost Recovery Regulations under the NEB Act.
The NEB spending trend shows that expenditures have increased over the last three years. Spending increased in 2008-09 due to negotiated changes to the collective agreement and incremental FTEs as approved by the Treasury Board. In 2009-10, spending increases were primarily attributable to the Board’s decision in February 2009 to transfer jurisdiction of TransCanada Pipeline’s NOVA Gas Transmission Ltd. (NGTL) system to the NEB. Funding was received for the additional FTEs required as a result of this increase in regulatory responsibility. These FTE positions were partially filled in 2009-10.
In 2010-11, spending increased as the NEB realized the full impact of the transfer in jurisdiction of the NGTL system and finished staffing the additional FTE positions. Spending also increased due to the Arctic Review initiative.
Spending Trend
($ millions)
Text description of this graph
- Main estimates increased in 2010-11 because of the inclusion of funding from an approved Treasury Board Submission the previous year ($9.6 million for the NGTL system, the LMCI and the Enhanced Aboriginal Engagement program).
- Planned spending is aligned with the main estimates each year. Therefore, the figures are equal for 2009-10 and 2010-11.
- Total Authorities increased in 2009-10 as a result of the Treasury Board Submission noted above. Therefore, total authorities in 2010-11 are virtually equal to the previous year.
- Actual Spending increased year over year because the Board was able to augment the net staff complement over time as a result of the additional funding from the Treasury Board Submission noted above. However, the Board is still not fully staffed. The lapse for the year was 6.8 per cent ($4.3 million). This was a result of lapses in the Participant Funding Program, the Hearing Reserve, and vacant positions.
Estimates by Vote
For information on our organizational Votes and/or statutory expenditures, please see the 2010–11 Public Accounts of Canada (Volume II) publication. An electronic version of the Public Accounts is available on the Public Works and Government Services Canada website.[1]