
Treasury Board of Canada Secretariat
www.tbs-sct.gc.ca
Common menu bar links
Breadcrumb Trail
ARCHIVED - Canadian Heritage - Report
 This page has been archived.
Archived Content
Information identified as archived on the Web is for reference, research or recordkeeping purposes. It has not been altered or updated after the date of archiving. Web pages that are archived on the Web are not subject to the Government of Canada Web Standards. As per the Communications Policy of the Government of Canada, you can request alternate formats on the "Contact Us" page.
Section III Supplementary Information
Financial Highlights
The financial highlights presented below are intended to serve as a general overview of the Department's financial position and operations. The unaudited financial statements are prepared in accordance with accrual accounting principles. The supplementary information presented in the financial tables in this report was prepared on a modified cash basis of accounting in order to be consistent with appropriations-based reporting.
| Condensed Statement of Financial Position At End of Year (March 31, 2010) |
% Change | 2008-09 | 2009-10 |
|---|---|---|---|
| Assets | |||
|
Financial Assets |
-3% |
559,334 |
577,768 |
| Total Assets | -3% | 580,098 | 597,579 |
| Liabilities | |||
| Total Liabilities | -3% | 605,109 | 626,837 |
| Equity Of Canada | |||
| Total Equity of Canada | -15% | (25,011) | (29,258) |
| Total Liabilities and Equity of Canada | -3% | 580,098 | 597,579 |
| Condensed Statement of Financial Operations At End of Year (March 31, 2010) |
% Change | 2008-09 | 2009-10 |
| Expenses | |||
|
Transfer Payments |
5% |
1,144,432 |
1,092,109 |
| Revenues | |||
| Total Revenues | -1% | 69,066 | 69,465 |
| Net Cost of Operations | 4% | 1,412,970 | 1,359,787 |
Financial Highlights Charts/Graphs
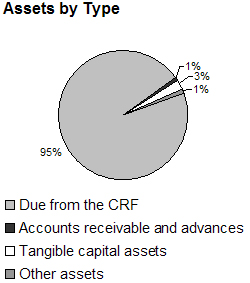
Total assets were $580 million at the end of 2009-2010, a decrease of $17.5 million (3 percent) versus last year's total assets. The decrease of the amount due from the Consolidated Revenue Fund (CRF) explains the variance. Accounts receivable and advances, tangible capital assets and other assets are comparable from one year to the other.
The amount due from the CRF is the largest asset component, representing 95 percent of assets.
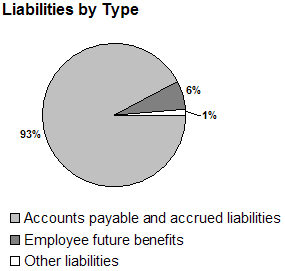
Total liabilities were $605 million at the end of 2009-2010, a decrease of $22 million (3 percent) versus last year's total liabilities. The decrease is explained by adjustments made following an intensive exercise to correct overestimated accounts payable and also by payables due to the ratification of the PSAC collective agreement recorded in 2008-2009. The variation in rates established by Treasury Board for the calculation of severance benefits explains the decrease in the liability for employee future benefits.
Accounts payable and accrued liabilities are the largest component of liabilities. Together they represent 93 percent of total liabilities.
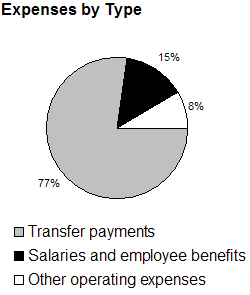
Total expenses were $1,482 million at the end of 2009-2010, an increase of $52.8 million (4 percent) versus last year's total expenses. Transfer payment expenses remain stable taking into account increases and decreases of certain grants and contributions programs mainly due to the Canada's Economic Action Plan and the Strategic Review. The decrease of salaries and employee benefits expenses is explained by a decrease in the number of employees and by the adjustment of the liability for employee future benefits.
Major expense areas include transfer payments (77 percent) and salaries and employee benefits (15 percent).![]Revenues by Type](images/fh-pdf-4-eng.jpg)
Total revenues were $69.1 million at the end of 2009-2010, an increase of $399,000 (1 percent) versus last year's total revenues.
The revenue from the 1979 Federal-provincial Lottery Agreement, totalling $65 million in 2009-2010, accounted for 94 percent of the revenues. As stipulated in the agreement, the amount received annually is adjusted to reflect inflation.
Financial Statements
Full unaudited Financial Statements of the Department for 2009-2010, including the Statement of Management Responsibility Including Internal Control over Financial Reporting, are available online at: http://www.pch.gc.ca/pc-ch/publctn/dpr-09-10-eng.cfm.
Canadian Heritage Portfolio
The role of the Portfolio Affairs Office remains the same as in 2007-2008
(more detailed information is available online at: http://www.tbs-sct.gc.ca/dpr-rmr/2007-2008/inst/pch/pch04-eng.asp#a32.
List of Tables
For more detailed information, please see the following tables available online at http://www.pch.gc.ca/pc-ch/publctn/mindep-eng.cfm
and at http://www.tbs-sct.gc.ca/dpr-rmr/st-ts-eng.asp.
- Details on Transfer Payment Programs
- Up-Front Multi-Year Funding
- Horizontal Initiatives
- Green Procurement
- Internal Audits and Evaluations
- Response to Parliamentary Committees and External Audits
- Sources of Respendable and Non-Respendable Revenue
- User Fees Reporting
- Report on the Administration of the Investment Canada Act (Canadian Heritage Web Site only)
Other Items of Interest
- Accountability Structure
- Governance
- Role of Regions
- Hyperlinks to Canadian Heritage Web Site
|
Address: |
Canadian Heritage |
|
Email: |
|
|
Telephone: |
819-997-0055 |
|
Toll-free*: |
1-866-811-0055 |
|
TTY**(Toll-Free): |
1-888-997-3123 |
*The toll-free lines have agents available to answer your questions, Monday to Friday, 8:30 a.m. to 5:00 p.m. (Eastern Standard Time).
**The TTY is a telecommunication device for people who are deaf, hard of hearing, or speech-impaired.
1 Total authority: total amount authorized by Parliament (Main Estimates, Supplementary Estimates, Budget Implementation acts) and any other authority provided for the reporting fiscal year.
2 For detailed Program Activity descriptions, please see Section II of the Department of Canadian Heritage 2009-2010 Report on Plans and Priorities available online at http://publiservice.tbs-sct.gc.ca/rpp/2009-2010/inst/pch/pch02-eng.asp#a17. Internal Services is shown as a distinct Program Activity at the end of Section II.
3 The Department undertook a major restructuring of its 2009-2010 Program Activity Architecture which prevents reporting 2008-2009 expenditures under the new architecture.
4 In accordance with the categorization issued by Treasury Board Secretariat and which is detailed as follows :
Exceeded: More than 100 per cent of the expected level of performance (as evidenced by the indicator and target or planned activities and outputs) for the expected result or priority identified in the corresponding Report on Plans and Priorities was achieved during the fiscal year.
Met All: 100 per cent of the expected level of performance (as evidenced by the indicator and target or planned activities and expected outputs) for the expected result or priority identified in the corresponding Report on Plans and Priorities was achieved during the fiscal year.
Mostly Met: 80 to 99 per cent of the expected level of performance (as evidenced by the indicator and target or planned activities and expected outputs) for the expected result or priority identified in the corresponding Report on Plans and Priorities was achieved during the fiscal year.
Somewhat Met: 60 to 79 per cent of the expected level of performance (as evidenced by the indicator and target or planned activities and outputs) for the expected result or priority identified in the corresponding Report on Plans and Priorities was achieved during the fiscal year.
Not Met: Less than 60 per cent of the expected level of performance (as evidenced by the indicator and target or planned activities and outputs) for the expected result or priority identified in the corresponding Report on Plans and Priorities was achieved during the fiscal year.
5 For reporting purposes and where applicable throughout the document, this term will be referred to as the 2010 Winter Games and includes the Olympic and Paralympic Games held in Vancouver and Whistler.
The Conference Board of Canada, Valuing Culture: Measuring and Understanding the Canadian Creative Economy, 2008, p. iv.
7 Department of Canadian Heritage analysis of 2008 data provided by the Canadian Music Industry Database (CMID) and the Quebec Collective Society for the Rights of Makers of Sound and Video Recordings (SOPROQ).
8 Statistics Canada, Special tabulation based on the 2004 Survey of Book Publishers, 2006.
9 Canadian Media Directors Council, Media Digest 09/10, 2009, pp. 43, 49.
10 Canadian Film and Television Production Association, Profile 2009: An Economic Report on the Canadian Film and Television Production Industry, 2009, pp. 36, 60.
11 Decima Research, 2008 Books Readership Study, 2008, p. 8.
12 Decima Research, 2008 Magazine Readership Study, 2008, p. 8.
13 Decima Research, Attitudes and Behaviours Towards Canadian Music 2008, 2008, p. 7.
14 Department of Canadian Heritage analysis of 2009 Nielsen Soundscan Top 2000 Chart data.
15 Department of Canadian Heritage analysis of 2009 BBM Infosys data.
16 Department of Canadian Heritage analysis of 2008-2009 reports that include the TV5MONDE Annual Activity/Results Report, the TV5 Québec Canada Monthly Programming Reports and Annual Consolidation, and the Radio-Canada Annual Export Budget Report.
17 Phoenix Strategic Perspectives, The Arts and Heritage in Canada: Access and Availability 2007, 2007, pp. i-ii.
18 The Conference Board of Canada, Valuing Culture: Measuring and Understanding the Canadian Creative Economy, 2008, p. iv.
19 Statistics Canada, Labour Force Survey, 2009.
20A description of all program activities as well as a list of the supporting program sub-activities for each program activity is available online in the Department of Canadian Heritage 2009-2010 Report on Plans and Priorities at http://www.tbs-sct.gc.ca/rpp/2009-2010/inst/pch/pch02-eng.asp#a21.
21 Department of Canadian Heritage analysis of the annual survey of the National Arts Training Contribution Program-funded institutions.
22 Department of Canadian Heritage analysis of program data for 2008-2009.
23 Department of Canadian Heritage, "Government of Canada Ensures Financial Stability of Cultural Sector by Renewing Arts Investments for Next Five Years," 2010-06-07 (http://www.pch.gc.ca/pc-ch/infoCntr/cdm-mc/index-eng.cfm?action=doc&DocIDCd=CJM090829)
24 Department of Canadian Heritage analysis of 2008 Canadian Music Industry Database (CMID) and Quebec Collective Society for the Rights of Makers of Sound and Video Recordings (SOPROQ) data.
25 Statistics Canada, Special tabulation based on the 2004 Survey of Book Publishers, 2006.
26 Canadian Media Directors Council, Media Digest 09/10, 2009, pp. 43, 49.
27 Canadian Film and Television Production Association, Profile 2009: An Economic Report on the Canadian Film and Television Production Industry, 2009, pp. 36, 60.
28 Statistics Canada, Sound Recording and Music Publishing 2008, Statistics Canada Catalogue no. 87F0008X, Table 9, 2010, p.8. http://www.statcan.gc.ca/pub/87f0008x/87f0008x2010001-eng.pdf (accessed July 28, 2010).
29 Ibid., Table 2, p. 3.
30 Statistics Canada, Book Publishers - 2008, Statistics Canada Catalogue no. 87F0004X, Table 1, 2010, p. 10.
http://www.statcan.gc.ca/pub/87f0004x/87f0004x2010001-eng.pdf (accessed July 28, 2010).
31 Statistics Canada, Periodical Publishing 2008, Statistics Canada Catalogue no. 87F0005X, Table 1, 2010, p. 2.
http://www.statcan.gc.ca/pub/87f0005x/87f0005x2010001-eng.pdf (accessed July 28, 2010).
32 Statistics Canada, Newspaper Publishers 2008, Statistics Canada Catalogue no. 63-241-X, Tables 2 and 3, 2010, pp. 2-3. http://www.statcan.gc.ca/pub/63-241-x/63-241-x2010001-eng.pdf (accessed July 28, 2010).
33 Statistics Canada, Film and Video Production 2008, Statistics Canada Catalogue no. 87-010-X, Table 1, 2010, p. 2.
http://www.statcan.gc.ca/pub/87-010-x/87-010-x2010001-eng.pdf (accessed July 28, 2010).
Statistics Canada, Film, Television and Video Post-production 2008, Statistics Canada Catalogue no. 87-009-X, Table 1, 2010, p. 2. http://www.statcan.gc.ca/pub/87-009-x/87-009-x2010001-eng.pdf (accessed July 28, 2010).
Statistics Canada, Motion Picture Theatres 2008. Statistics Canada Catalogue no. 87F0009X, Table 1, 2010, p. 2.
http://www.statcan.gc.ca/pub/87f0009x/87f0009x2010001-eng.pdf (accessed July 28, 2010).
34 Canadian Radio-television Telecommunications Commission, Communications Monitoring Report 2009,Table 4.3.1, 2009, p. 124.
35 Ibid.,Table 4.2.1, p. 95.
36 Department of Canadian Heritage analysis of 2009 BBM Infosys data.
37 Canadian Radio-television Telecommunications Commission, Communications Monitoring Report 2009, Table 4.3.6, 2009, p. 130.
38 Same as 35.
39 Same as 36.
40 TV5 Québec Canada Yearly Activity/Report.
41 Canadian Film and Television Production Association, Profile 2009: An Economic Report on the Canadian Film and Television Production Industry, 2009, p. 13 (Data available in Quebec only).
42 Department of Canadian Heritage analysis 2009 Motion Picture Theatre Associations of Canada data.
43 A proxy measure is an indirect measure used when a direct measure is not available. Proxy measures are correlated to direct measures.
44 Department of Canadian Heritage analysis 2009 Nielsen SoundScan Top 2000 Chart data.
45 Idem.
46 Department of Canadian Heritage analysis of 2007 and 2008 data provided by the Society of Composers, Authors and Music Publishers of Canada.
47 Statistics Canada, Special tabulation based on 2008 Survey of Book Publishers, 2010.
48 Canadian Media Directors Council, Media Digest 09/10, 2009, pp. 43, 49.
49 More information is available online at http://www.pro.rcip-chin.gc.ca
50 Angus Reid Public Opinion, Vancouver 2010 Winter Olympics, "Canadians Provide High Marks to Vancouver 2010 Opening Ceremony", February 18, 2010, http://www.visioncritical.com/wp-content/uploads/2010/02/2010.02.18_Opening_CAN.pdf
51 The Vancouver Sun, "Vancouver's Olympics made Canadians feel proud, poll shows", March 5, 2010, http://www.vancouversun.com/sports/Vancouver/
+Olympics+made+Canadians+feel+proud+poll+shows/2647210/story.html
52 Library and Archives Canada, Decima Research Survey, Canada, Attitudes and Perceptions of the Canadian population towards Canada's official languages, 2006. http://epe.lac-bac.gc.ca/100/200/301/pwgsc-tpsgc/por-ef/canadian_heritage/2006/247-05-e/index.html
53 Data from 2006 Canada Census, Statistics Canada. http://www12.statcan.gc.ca/census-recensement/2006/dp-pd/tbt/Rp-eng.cfm?
LANG=E&APATH=3&DETAIL=0&DIM=0&FL=A&FREE=0&GC=0&GID=0&GK=0&GRP=1&PID=
99018&PRID=0&PTYPE=88971,97154&S=0&SHOWALL=0&SUB=0&Temporal=2006&THEME=
70&VID=0&VNAMEE=&VNAMEF=
54 Department of Canadian Heritage analysis of 2007 and 2008 data provided by the Society of Composers, Authors and Music Publishers of Canada.
55 Transfer Payment Program 2008-2009 compared with Transfer Payment Program 2009-2010.
56 More information is available online at http://www.exchanges.gc.ca
http://epe.lac-bac.gc.ca/100/200/301/pwgsc-tpsgc/por-ef/canadian_heritage/2006/247-05-e/index.html
58 The Branch whose programs are supporting Official Languages is currently developing a new approach that will give more current data.
59 Same as 53.
60 Idem.
61 Idem.
62 Canadian Fitness & Lifestyle Research Institute (2009). Let's Get Active! Planning Effective Communication Strategies. 2008 Physical Activity Monitor. CFLRI. (http://www.cflri.ca/eng/statistics/surveys/documents/PAM2008FactsFigures
_Bulletin03_Sport_ParticipationEN.pdf)
63 Statistics Canada. Sport Participation in Canada (2005). Culture, Tourism and the Centre for Education Statistics Division. Research Paper.
64 Ekos Research Associates, Inc., 2009 Status of the High Performance Athlete, Ottawa, 2010.
65 Athletes who are approved for funding and are financially supported through the Athlete Assistance Program are referred to as "carded" athletes. The Program support is referred to as "carding."
66 Beginning in the 2009-2010 Estimates cycle, the resources for Internal Services are displayed separately from other program activities. As in the case of the previous Main Estimates, they are no longer distributed among program activities under Strategic Outcomes 1 through 3. This has affected the comparability of spending and FTE information by program activity between fiscal years.
67 The Management Accountability Framework Round VI assessments are available online at http://www.tbs-sct.gc.ca/maf-crg/assessments-evaluations/2008/assessments-evaluations-eng.asp.
68 For more detailed information on the Canada Economic Action Plan, please see information available online at
http://www.actionplan.gc.ca/initiatives/eng/index.asp?mode=5&btnSubmit=Submit&clientId=9.
69 Data are not final until the release of the 2009-2010 Canadian Television Fund annual report, which will be available online at www.cmf-fmc.ca
70 The estimated total budget includes program commitments and administration. Data are not final until the release of the 2009-2010 Canadian Television Fund annual report, which will be available online at www.cmf-fmc.ca
71 Due to differences between the broadcast year and the Canadian Television Fund fiscal year, the most recent audience data available are from 2007-2008. Audience data from 2008-2009 will not be available until the Canadian Television Fund publishes its 2009-2010 annual report.