
Treasury Board of Canada Secretariat
www.tbs-sct.gc.ca
Common menu bar links
Breadcrumb Trail
ARCHIVED - Office of the Commissioner of Official Languages - Report
 This page has been archived.
Archived Content
Information identified as archived on the Web is for reference, research or recordkeeping purposes. It has not been altered or updated after the date of archiving. Web pages that are archived on the Web are not subject to the Government of Canada Web Standards. As per the Communications Policy of the Government of Canada, you can request alternate formats on the "Contact Us" page.
Section III: Supplementary Information
This section presents the financial highlights, lists some supplementary information tables relevant to the Office of the Commissioner, and cites other items of interest.
Financial Highlights
Audited Financial Statements
The Office of the Commissioner’s audited financial statements are for the year ended March 31, 2010.
| Condensed Statement of Financial Position At March 31 |
% Change | 2009–2010 ($000) |
2008–2009 ($000) |
|---|---|---|---|
| Assets | (26%) | 3,239 | 4,360 |
| Liabilities | (10%) | 5,276 | 5,844 |
| Equity of Canada | 37% | (2,037) | (1,484) |
| Total | (26%) | 3,239 | 4,360 |
The reduction of $1.1 million in assets at year-end is related to: the reduction in the “due” from the Consolidated Revenue Fund account, which no longer reflects accrued salaries at March 31, 2008, for Public Service Alliance of Canada collective agreements signed late in 2008–2009; the reduction in the “recoverable” from the Treasury Board for overpayments to the employee benefit plans; and the reduction in tangible capital assets, as amortization exceeded the purchase of new acquisitions.
The reduction of $0.6 million in liabilities at year-end is related to the reduction in accrued salaries and severance pay, net of the increase in the payments to the employee benefit plans to Treasury Board and in the new one-time vacation pay entitlement to employees after their second year of service.
The increase of $0.5 million in the equity of Canada results from the reduction of $1.1 million in assets less the reduction of $0.6 million in liabilities. Like other departments and agencies, the Office of the Commissioner receives most of its funding through annual parliamentary appropriations. Items recognized in the statement of operations and the statement of financial position in one year may be funded through parliamentary appropriations in prior, current or future years. Accordingly, the Office of the Commissioner has different net results of operations for the year on a government funding basis (Public Accounts of Canada) than on an accrual accounting basis (financial statements). Consequently, at the end of the 2009–2010 fiscal period, the equity of Canada indicates that the Office of the Commissioner has items that may require funding in future years.
Planned Spending, Total Authorities and Actual Spending
The headings “Planned Spending”, “Total Authorities” and “Actual Spending” displayed in the financial tables in this report can be summarized as follows:
- Planned spending is the basic funding provided by Parliament at the beginning of the year by means of the Main Estimates.
- Total authorities include both the Main Estimates (planned spending) for the year, as well as any additional or supplementary funding provided by Parliament during the year.
- Actual spending represents the cash-related expenses and acquisitions of assets, such as tangible capital assets, made during the year and not the non-cash expenses incurred during the year as per the financial statements (i.e., services provided free of charge by other departments).
Parliamentary Appropriations Approved (Total Authorities)
Section II of this report presents the financial and human resources approved by Parliament and allocated to the Office of the Commissioner as per its Program Activity Architecture, approved by the Treasury Board and presented in Section I of this report.
In 2009–2010, Parliament approved $22.3 million. These appropriations are composed of $19.9 million in Main Estimates (planned spending) and a further $2.4 million in Supplementary Estimates. The $2.4 million includes collective agreement settlements ($0.6 million), severance and parental leave payments ($0.6 million), employee benefit plan payments ($0.3 million) and the 2008–2009 carry-forward funding ($0.9 million).
In 2008–2009, Parliament approved $22 million. The increase of $0.3 million in 2009–2010 is mainly related to an increase in employee benefit plan payments to Treasury Board.
Parliamentary Appropriations Used (Actual Spending)
In 2009–2010, the Office of the Commissioner spent $21.3 million of the $22.3 million in parliamentary appropriations approved. The amount spent by program activity is reported in Section II of this report.
The Office of the Commissioner, subject to parliamentary approval, may carry forward lapsed amounts of up to 5% of its operating budget (based on Main Estimates program expenditures) into the next fiscal year. Accordingly, the organization lapsed $1.0 million in 2009–2010 mainly due to a shortfall in staff that created delays on projects and a reduction in operating expenses.
Full-time Equivalents Used
The summary table of resources in Section 1 of this report indicates that the Office of the Commissioner used 170.7 FTEs in 2009–2010, which represents 96% of its planned 177.5 FTEs, up from 87.5% in 2008–2009. Despite the ongoing challenges in recruiting and retaining staff, this represents an increase of 10% in the number of FTEs used from last year, attributable mainly to an increase of 13.5 indeterminate employee FTEs.
| 2009-2010 | 2008–2009 | ||||
|---|---|---|---|---|---|
| Operating Expenses | Protection Through Compliance Assurance | Promotion Through Policy and Com- munications |
Internal Services | Total | Total |
| Salaries and employee benefits | $6,183,198 | $5,843,495 | $5,084,329 | $17,111,022 | $16,484,546 |
| Professional and special services | 473,242 | 1,147,727 | 1,582,279 | 3,203,248 | 3,988,591 |
| Accommodation | 605,666 | 605,666 | 519,141 | 1,730,473 | 1,719,240 |
| Transportation and telecommunications | 192,051 | 357,399 | 604,460 | 1,153,910 | 1,160,976 |
| Amortization of tangible capital assets | 269,283 | 269,283 | 230,815 | 769,381 | 744,219 |
| Other expenses* | 50,620 | 343,081 | 490,421 | 884,122 | 836,133 |
| Net Cost of Operations | $7,774,060 | $8,566,651 | $8,511,445 | $24,852,156 | $24,933,705 |
* Other expenses include communication and printing; repairs and maintenance; utilities, materials and supplies; rentals of photocopiers; and other items. The increase from 2008–2009 is mainly related to shared application software maintenance contracts with Public Works and Government Services Canada having been reclassified from professional services to repairs and maintenance.
The Office of the Commissioner must report appropriations used (Actual Spending), which are displayed in the Public Accounts of Canada and not appropriations set aside for non-cash expenses.
The timing differences are reconciled as follows:
| 2009–2010 | 2008–2009 | |
|---|---|---|
| Net cost of operations per audited financial statements | $24,852,156 | $24,933,705 |
| Add or Deduct: Non-cash expenses affecting net cost of operations but not affecting appropriations | ||
| Amortization of tangible capital assets | (769,381) | (744,219) |
| Services provided without charge by other government departments* |
(3,014,303) | (2,922,992) |
| Decrease (increase) in vacation pay and compensatory leave | (139,803) | 22,895 |
| Decrease (increase) in accrued employee severance benefits | 64,984 | (501,834) |
| Other adjustments | 12,867 | (74,424) |
| 21,006,520 | 20,713,131 | |
| Add or Deduct: Cash expenses not affecting net cost of operations but affecting appropriations | ||
| Paid repexpenses | (2,500) | 1,500 |
| Acquisitions of tangible capital assets | 281,826 | 452,124 |
| Current year appropriations used | $21,285,846 | $21,166,755 |
*Services provided without charge by other government departments refers mainly to accommodations provided by Public Works and Government Services Canada for the Ottawa headquarters and five regional offices ($1.7 million)—reported separately in the Statement of Operations under Accommodation and contributions covering employer’s share of employees’ insurance premiums and expenditures paid by Treasury Board ($1.2 million)—reported as part of the employee benefits in the Statement of Operations.
Cost of Operations Reported in the Audited Financial Statements
In 2009–2010, the Office of the Commissioner’s net cost of operations was $24.9 million, as reported in its audited financial statements.
The net decrease of $82,000 from 2008–2009 is essentially a combination of a net increase in salary and employee benefits of $626,000, and a decrease of $730,000 in temporary help, part of Professional and Special Services. The need for temporary help decreased as positions were staffed. Being a small agency, the Office of the Commissioner must call on professionals since it cannot have on staff all the expertise required to fulfill its mandate. Professional and Special Services, much as in 2008–2009, represent the second highest expense after salaries and benefits: roughly 13% of the net cost of operations.
Allocation of Cost of Operations by Program Activity
The audited 2009–2010 financial statements present the Office of the Commissioner’s allocation of the $24.9 million to program activities.
The Protection Through Compliance Assurance Program Activity represents 31% of operating expenses, the Promotion Through Policy and Communications Program Activity represents 35% and the Internal Services Program Activity represents 34%.
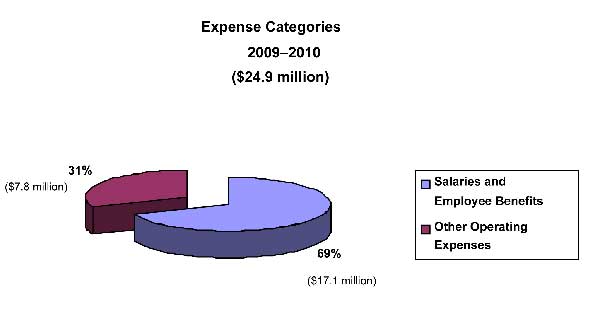
Allocation of Cost of Operations by Expense Categories
The audited 2009–2010 financial statements also report $24.9 million in operating costs.
Salaries and employee benefits represent 69% of operating expenses, whereas other operating expenses represent 31%.
List of Supplementary Information Tables
The following electronic supplementary information tables for this Performance Report can be found on the Treasury Board Secretariat’s website:
- User Fees—User Fees Act (the Office of the Commissioner of Official Languages became subject to the Access to Information Act on April 1, 2007);
- User Fees—Policy on Service Standards for External Fees; and
- Internal Audits.
Other Items of Interest
Statutory reports, publications and other information are available from:
Office of the Commissioner of Official Languages
344 Slater Street, 3rd Floor
Ottawa, Ontario K1A 0T8
Telephone: 613-996-6368
1 A terroir is a determined geographical area, defined by a human community, which generates and accumulates along its history a set of distinctive cultural traits, knowledge and practices based on a system of interactions between the natural environment and human factors. (See UNESCO, A Project for the Terroirs around the World. Information materials for the UNESCO 34th General Conference, October 16–November 3, 2007.)
2The expected results presented in the tables in this section are the same as those outlined in the Office of the Commissioner’s 2009–2010 Report on Plans and Priorities, with possible minor changes in wording.
3 An admissible complaint is a complaint that is accepted for investigation by the Commissioner on the basis of initial evaluation by the Complaint Reception Centre because its subject matter:
- may potentially constitute an infraction of the letter, spirit or intent of the Official Languages Act;
- relates to a federal institution; or
- relates to a specific incident or series of incidents.
4 A follow-up audit examines whether an institution implemented recommendations made by the Commissioner in an earlier audit.