
Treasury Board of Canada Secretariat
www.tbs-sct.gc.ca
Common menu bar links
Breadcrumb Trail
ARCHIVED - Canadian Heritage
 This page has been archived.
Archived Content
Information identified as archived on the Web is for reference, research or recordkeeping purposes. It has not been altered or updated after the date of archiving. Web pages that are archived on the Web are not subject to the Government of Canada Web Standards. As per the Communications Policy of the Government of Canada, you can request alternate formats on the "Contact Us" page.
Section III – Supplementary Information
3.1 Financial Highlights
The financial highlights presented within this Departmental Performance Report are intended to serve as a general overview of Canadian Heritage’s financial position and operations. The unaudited financial statements are prepared in accordance with accrual accounting principles. The supplementary information presented in the financial tables in this report was prepared on a modified cash basis of accounting in order to be consistent with appropriations-based reporting.
| As at March 31 Condensed Statement of Financial Position |
% Change | 2009 | 2008 |
|---|---|---|---|
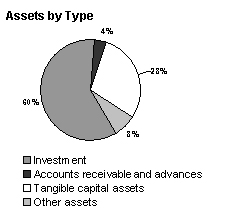
| Assets | |||
| Financial Assets Non-Financial Assets |
-23 -1 |
35,191 19,820 |
45,502 19,975 |
| Total | -16 | 55,011 | 65,477 |
| Liabilities | |||
| Total Liabilities | 10 | 630,172 | 574,176 |
| Equity | |||
| Total Equity | 13 | (575,161) | (508,699) |
| Total LIABILITIES & EQUITY | -16 | 55,011 | 65,477 |
| For the year ended March 31 Condensed Statement of Financial Position |
% Change | 2009 | 2008 |
|---|---|---|---|
| Expenses | |||
| Transfer Payments Operating Expenses Total Expenses |
-1 9 1 |
1,092,109 337,111 1,429,220 |
1,107,754 310,115 1,417,869 |
| Revenues | |||
| Total Revenues | 1 | 69,465 | 69,010 |
| Net Cost of Operations | 1 | 1,359,755 | 1,348,859 |
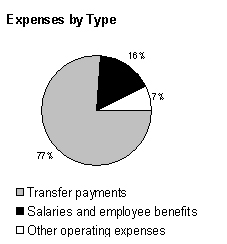
Total expenses were $1,429M for 2008-2009, an increase of $11.3M (0.8 percent) versus last year’s total expenses. Transfer payment expenses remained stable, taking into account increases and decreases of certain grants and contributions programs. Increase of salaries and employee benefits expenses was explained by the ratification of the PSAC collective agreement and an increase in the number of employees.
Major expense areas include transfer payments (77 percent) and salaries and employee benefits (16 percent).
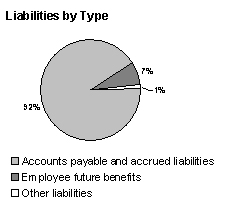
Total liabilities were $630.2M at the end of 2008-2009, an increase of $56M (9.75 percent) versus last year’s total liabilities. The increase was explained by new accounts payable for specific grants and contributions programs, and payables due to the ratification of the PSAC collective agreement. Increases in rates established by Treasury Board for the calculation of severance benefits and payroll explained the increase in liability for employee future benefits.
Accounts payable and accrued liabilities are the largest component of liabilities. Together they represent 92 percent of total liabilities.
Total expenses were $1,429M for 2008-2009, an increase of $11.3M (0.8 percent) versus last year’s total expenses. Transfer payment expenses remained stable, taking into account increases and decreases of certain grants and contributions programs. Increase of salaries and employee benefits expenses was explained by the ratification of the PSAC collective agreement and an increase in the number of employees.
Major expense areas include transfer payments (77 percent) and salaries and employee benefits (16 percent).
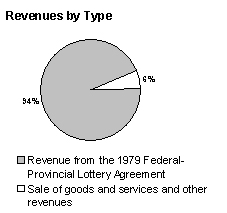
Total revenues were $69.5M at the end of 2008-2009, an increase of $455,000 (0.66 percent) versus last year’s total revenues.
The revenue from the 1979 Federal-Provincial Lottery Agreement, totalling $65M in 2009, accounted for 94 percent of the revenues. As stipulated in the Agreement, the amount received annually is adjusted to reflect inflation.
Full Financial Statements of the Department of Canadian Heritage for 2008-2009 are available at: http://www.pch.gc.ca/pc-ch/publctn/mindep-eng.cfm.
3.2 Supplementary Information Tables
All electronic supplementary information tables for this 2008-2009 Departmental Performance Report can be found on the Treasury Board of Canada Secretariat’s Web site at: http://www.tbs-sct.gc.ca/dpr-rmr/st-ts-eng.asp and on Canadian Heritage Web site at: http://www.pch.gc.ca/pc-ch/publctn/mindep-eng.cfm.
- Table 1: Sources of Respendable and Non-Respendable Revenue
- Table 2: User Fees / External Fees
- Table 3: Details on Transfer Payment Programs
- Table 4: Up-Front Multi-Year Funding
- Table 5: Horizontal Initiatives
- Table 6: Sustainable Development Strategy
- Table 7: Green Procurement
- Table 8: Response to Parliamentary Committees and External Audits
- Table 9: Internal Audits
- Table 10: Evaluations
| Name of Transfer Payment Programs (above $5M) | Amount of Grants ($ millions) |
Amount of Contributions ($ millions) |
Total ($ millions) |
|---|---|---|---|
| Aboriginal Peoples’ Program (including Young Canada Works) | 0.6 | 56.8 | 57.4 |
| Arts Presentation Canada Program | 5.8 | 24.1 | 29.9 |
| Athlete Assistance Program | 26.5 | 0.0 | 26.5 |
| Book Publishing Industry Development Program | 0.0 | 36.2 | 36.2 |
| Building Communities through Arts and Heritage | 4.4 | 2.4 | 6.8 |
| Canada Magazine Fund | 0.0 | 14.3 | 14.3 |
| Canada Music Fund | 0.0 | 25.0 | 25.0 |
| Canada New Media Fund | 0.0 | 14.5 | 14.5 |
| Canadian Arts and Heritage Sustainability Program | 15.9 | 8.4 | 24.3 |
| Canadian Culture Online Program | 0.0 | 13.1 | 13.1 |
| Canadian Television Fund | 0.0 | 120.0 | 120.0 |
| Celebration, Commemoration and Learning Program | 3.6 | 42.2 | 45.8 |
| Community Historical Recognition Program | 0.0 | 0.0 | 0.0 |
| Cultural Spaces Canada | 0.5 | 28.7 | 29.2 |
| Development of Official Language Communities Program | 7.7 | 224.4 | 232.1 |
| Enhancement of Official Languages Program (including Young Canada Works) | 1.3 | 120.2 | 121.5 |
| Exchanges Canada Program | 0.0 | 18.5 | 18.5 |
| Grants/Contributions to TV5 Program | 4.4 | 2.6 | 7.0 |
| Hosting Program | 0.0 | 44.5 | 44.5 |
| Katimavik Program | 0.0 | 19.0 | 19.0 |
| Multiculturalism Program | 0.2 | 4.0 | 4.2 |
| Museum Assistance Program (including Young Canada Works) | 2.0 | 11.9 | 13.9 |
| National Arts Training Contribution Program | 0.0 | 18.4 | 18.4 |
| Publications Assistance Program | 45.4 | 0.0 | 45.4 |
| Sport Support Program | 0.0 | 111.9 | 111.9 |
| Total | 118.3 | 961.1 | 1079.4 |
3.3 Other Items of Interest
3.3.1 Accountability Structure
| Minister of Canadian Heritage and Official Languages | The Honourable James Moore |
| Minister of State (Status of Women) | The Honourable Helena Guergis |
| Minister of State (Sport) | The Honourable Gary Lunn |
| Deputy Minister | Judith A. LaRocque |
| Associate Deputy Minister | Susan Peterson |
| Executive Committee | Decision-making body chaired by the Deputy Minister; the Associate Deputy Minister, Assistant Deputy Ministers and Corporate Secretary are members. |
| Assistant Deputy Minister, Cultural Affairs | Jean-Pierre Blais |
| Assistant Deputy Minister, Citizenship and Heritage | Diane Fulford |
| Assistant Deputy Minister, International and Intergovernmental Affairs and Sport | Marie-Genevičve Mounier |
| Assistant Deputy Minister, Public and Regional Affairs | Nicole Bourget |
| Assistant Deputy Minister, Planning and Corporate Affairs | Tom Scrimger |
Each Assistant Deputy Minister is accountable for managing his/her Sector and shares the accountability for the delivery of results associated with the seven departmental Program Activities as set out in the Program Activity Architecture. This model fosters collaboration among sectors. Directors General, Regional Executive Directors, Directors and Managers are accountable for Program Sub-Activities, and Program Sub-Sub-Activities and report to their respective Assistant Deputy Minister.
3.3.2 Governance
The governance structure of the Department of Canadian Heritage remains the same as in
2007-2008 (see: http://www.tbs-sct.gc.ca/dpr-rmr/2007-2008/inst/pch/pch04-eng.asp#a29).
Decisions are made through three levels of governance committees.
Management Level 1 – The Decision-making Committees: Executive Committee; Talent Management Board; and the Departmental Audit Committee.
Management Level 2 – The Operational Committees (Chaired by the Deputy Minister or by the Associate Deputy Minister): Communications and Coordination Committee; Strategic Policy, Planning and Evaluation Committee; Operations and Management Committee.
Management Level 3 – The Advisory Committees: Policy Committee; Integrated Planning and Evaluation Committee; Human Resources and Workplace Management Advisory Committee; Finance Committee; Information Management and Information Technology (IM/IT) Committee; Program Management and Service Delivery Committee; and Legal Services Planning and Priorities Committee.
3.3.3 Departmental Support for Portfolio Management
The role of the Portfolio Affairs Office remains the same as in 2007-2008 (see: http://www.tbs-sct.gc.ca/dpr-rmr/2007-2008/inst/pch/pch04-eng.asp#a32).
The Portfolio Affairs Office assists the Minister and Deputy Minister in carrying out their portfolio responsibilities and supporting the Government’s agenda. It provides a “single window” on the Portfolio to integrate policy, planning, reporting, renewal of financial resources, central agencies coordination, appointments, governance and communications related to the Canadian Heritage portfolio organizations.
3.3.4 Role of Regions
The role of the regions remains the same as in 2007-2008 (see: http://www.tbs-sct.gc.ca/dpr-rmr/2007-2008/inst/pch/pch04-eng.asp#a33).
In addition to its headquarters in Gatineau, Québec, the Department connects with Canadians through five regional offices and 20 points of service across Canada as well as through its Web site. These offices serve a wide range of client organizations at the community level by managing certain grants and contribution programs.
3.3.5 Internal Services
Internal Services are covered under Program Activity 8. In 2008-2009, one of the priorities was to strengthen management practices (Priority 5). Results of this priority are summarized in Section 1.2.2 of this Report. The Department planned to review and continually adjust its corporate management infrastructure and its governance structure to respond to new requirements regarding results-based management, comptrollership, risk management, internal audit and evaluation, service delivery, public service modernization, governance and accountability.
Key Initiatives involved in Priority 5 were the following:
- Key Initiative 16 – Implementing the Department of Canadian Heritage’s Action Plan Supporting Blue Ribbon Panel Conclusions.
- Key Initiative 17 – Public Service Renewal.
- Key Initiative 18 – Canadian Heritage Management Accountability Framework Action Plan.
- a) Results-based Management
- b) Integrated Risk Management – Initiatives related to Risk Assessment and Management in Operations and/or in Corporate Decision Making
- c) Internal Audit – Implementing the New Treasury Board Policy on Internal Audit and Contributing to Strengthening Accountability in the Department
- d) Shared Services and Information Management/Information Technology (IM/IT)
Additional Information
These Key Initiatives were met. Details on results of these Key Initiatives can be found online in Appendix A at
http://www.pch.gc.ca/pc-ch/publctn/mindep-eng.cfm.
3.3.6 Hyperlinks to Canadian Heritage Web site
http://www.pch.gc.ca/index-eng.cfm
Legislation related to Canadian Heritage
Portfolio Crown corporations and other organizations
Regional offices
Canadian Heritage, Intersections: Navigating the Cultural Landscape, Cultural Affairs Sector 2007-2008
Annual Report
http://www.pch.gc.ca/pc-ch/org/sectr/ac-ca/pblctns/anl-rpt/2007-2008/index-eng.cfm
http://www.pch.gc.ca/pc-ch/org/sectr/ac-ca/pblctns/anl-rpt/2007-2008/index-fra.cfm
Appendix A
Detailed Information on the Results of Key Initiatives is available online only at http://www.pch.gc.ca/pc-ch/publctn/mindep-eng.cfm.
Contact: National Headquarters
Department of Canadian Heritage
15 Eddy Street
Gatineau, Québec
K1A 0M5
Tel.: (819) 997-0055
Toll Free: 1 866 811-0055
ATME*: (819) 997-3123
Email: info@pch.gc.ca
Footnotes:
[1] Human Resources and Social Development Canada.
Indicators of Well-being in Canada (Geographic Distribution).
http://www4.hrsdc.gc.ca/indicator.jsp?lang=en&indicatorid=34#MOREON_2
[2] Statistics Canada. Portrait of the Canadian Population in 2006, by Age and Sex: National portrait. http://www12.statcan.ca/english/census06/analysis/agesex/NatlPortrait2.cfm
[3] Statistics Canada. Immigration in Canada:
A Portrait of the Foreign-born Population, 2006 Census: Immigration: Driver of population growth.
http://www12.statcan.ca/english/census06/analysis/immcit/foreign_born.cfm
[4] Statistics Canada. The Daily - Study: Canada’s immigrant labour market, September 10, 2007. http://www.statcan.ca/Daily/English/070910/d070910a.htm
[5] Human Resources and Social Development Canada. Indicators of Well-being in Canada (Aboriginal Population). http://www4.hrsdc.gc.ca/indicator.jsp?lang=en&indicatorid=36
[6] Statistics Canada. The Evolving Linguistic Portrait, 2006 Census:Highlights. http://www12.statcan.ca/english/census06/analysis/language/highlights.cfm
[7] These figures are stated in constant 2002 dollars. The Conference Board of Canada. Valuing Culture: Measuring and Understanding Canada’s Creative Economy, 2008, p. 26. http://www.conferenceboard.ca/documents.aspx?did=2671
[8] Phoenix Strategic Perspectives. A Report for the Department of Canadian Heritage: The Arts and Heritage in Canada - Access and Availability 2007.
[9] Canadian Internet Project. Canada Online
– A comparative analysis of Internet users and non-users in Canada and the world: Behaviour, attitudes and trends,
2004, p. 5. http://www.cipic.ca/en/documents/Canadapercent20Onlinepercent20Finalpercent20
Englishpercent20Versionpercent2010302005.pdf
[10] Canadian Internet Project II 2007, "Canada Online! The Internet, media and emerging technologies: Users, attitudes, trends and international comparisons", section 3, p. 2.
[11] BBM Canada.
[12] Valuing Culture: Measuring and Understanding the Canadian Creative Economy, The Conference Board of Canada, 2008.
[13] Canadian Heritage estimate based on Statistics Canada data for cultural and overall employment in 2003. See Economic Contribution of Culture to Canada’s Provinces (2007).
[14] Valuing Culture: Measuring and Understanding the Canadian Creative Economy, The Conference Board of Canada, 2008. http://www.conferenceboard.ca/documents.aspx?did=2671
[15] Canadian Heritage estimate based on Statistics Canada data for cultural and overall employment in 2003. See Economic Contribution of Culture to Canada’s Provinces (2007). http://www.statcan.gc.ca/pub/81-595-m/81-595-m2006037-eng.htm
[16] The Arts and Heritage in Canada: Access and Availability 2007, Phoenix Strategic Perspectives.
[17] This data is based on Sport Canada’s Annual Olympic Ranking Index of Nations. The Index is based on results per nation across all Olympic events at Olympic Games and World Championships, over a four-year time frame. The Index is produced annually – at the end of each calendar year, once the Olympic Games and/or World Championships of that year have been completed. The results are aggregated with the results of the three previous years to produce a comprehensive four-year cycle of results across all Olympic events. For summer sports, this represents approximately 1,000 events over a four-year period; for Winter sports, almost 300 events.
[18] Canadian Sport Tourism Alliance.
[19] Canadian Sport Tourism Alliance.