
Treasury Board of Canada Secretariat
www.tbs-sct.gc.ca
Common menu bar links
Breadcrumb Trail
ARCHIVED - Canadian Food Inspection Agency
 This page has been archived.
Archived Content
Information identified as archived on the Web is for reference, research or recordkeeping purposes. It has not been altered or updated after the date of archiving. Web pages that are archived on the Web are not subject to the Government of Canada Web Standards. As per the Communications Policy of the Government of Canada, you can request alternate formats on the "Contact Us" page.
Section III – Supplementary Information
3.1 Financial Information
3.1.1 Financial Highlights
The financial highlights presented within this report are intended to serve as a general overview of the CFIA's financial position and operations. Financial statements are prepared in accordance with accrual accounting principles, Treasury Board accounting policies and year-end instructions issued by the Office of the Comptroller General which are consistent with Canadian generally accepted accounting principles for the public sector as required under Section 31 of the Canadian Food Inspection Agency Act. The Agency has been audited since its creation and has always received an unqualified opinion.
| Condensed Statement of Financial Position As at March 31 |
% Change | 2009 | 2008 |
|---|---|---|---|
| Assets | |||
| Total Assets | (5.59%) | 274,269 | 290,505 |
| Total | (5.59%) | 274,269 | 290,505 |
| Liabilities | |||
| Total Liabilities | 12.35% | 226,956 | 202,004 |
| Equity | |||
| Total Equity | (46.54%) | 47,313 | 88,501 |
| Total | (5.59%) | 274,269 | 290,505 |
| Condensed Statement of Operations Year ended March 31 |
% Change | 2009 | 2008 |
|---|---|---|---|
| REVENUE | |||
| Total Revenues | (10.94%) | 54,299 | 60,971 |
| EXPENSES | |||
| Total Expenses | 0.13% | 805,691 | 804,637 |
| Net Cost of Operations | 1.03% | 751,392 | 743,666 |
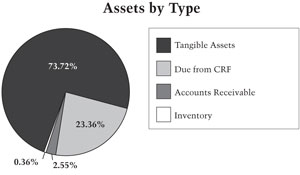
Total assets at the end of 2008-2009 were $274 million, a decrease of $16 million (6%) over previous year's total assets of $290 million. Tangible assets represented the largest portion of total assets, at $202 million or 74% of total assets, while due from CRF represented 23% at $64 million. Accounts receivable only represented 3%, followed by inventory which represented less than 1% of total assets.
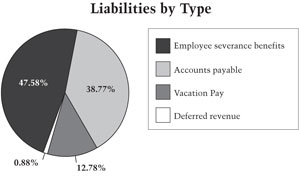
Total liabilities at the end of 2008-2009 were $227 million, an increase of $25 million (12%) over the previous year's total liabilities of $202 million. Employee severance benefits represented 48% of total liabilities, at $108 million, followed by the accounts payable which represented 39% of total liabilities, at $88 million. Vacation pay represented $29 million or 13%, while deferred revenue only represented less than 1% of total liabilities.
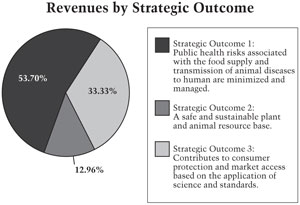
The Agency's total revenues amounted to $54 million for 2008-2009. The $7 million (11%) decrease from the previous year is primarily due to the government's approval of certain user fee remissions to address inequities in the current fee structure. More than half of the revenue was derived from the Strategic Outcome 1. Strategic Outcome 3 represented 33% of all revenues, or $18 million, where $7 million, or 13% were derived from Strategic Outcome 2.
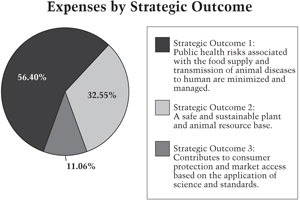
The total expenses for CFIA were $805 million in 2008-2009. The majority of the funds, $454 million or 56%, was spent for Strategic Outcome 1. Strategic Outcome 2 represented $263 million or 33% of total expenses, while Strategic Outcome 3 represented $89 million or 11% of total expenses.
3.1.2 Auditor General's Audit Opinion on Financial Statements and Audited Financial Statements
 [D]
[D]
CANADIAN FOOD INSPECTION AGENCY
Statement of Management Responsibility
Responsibility for the integrity and objectivity of the accompanying financial statements for the year ended March 31, 2009 and all information contained in these statements rests with the Agency’s management. These financial statements have been prepared by management in accordance with Treasury Board accounting policies and year-end instructions issued by the Office of the Comptroller General which are consistent with Canadian generally accepted accounting principles for the public sector as required under Section 31 of the Canadian Food Inspection Agency Act.
Management is responsible for the integrity and objectivity of the information in these financial statements. Some of the information in the financial statements is based on management's best estimates and judgment and gives due consideration to materiality. To fulfil its accounting and reporting responsibilities, management maintains a set of accounts that provides a centralized record of the Agency's financial transactions. Financial information submitted to the Public Accounts of Canada and included in the Agency's Departmental Performance Report is consistent with these financial statements.
Management maintains a system of financial management and internal control designed to provide reasonable assurance that financial information is reliable, that assets are safeguarded and that transactions are in accordance with the Financial Administration Act, are executed in accordance with prescribed regulations, within Parliamentary authorities, and are properly recorded to maintain accountability of Government funds. Management also seeks to ensure the objectivity and integrity of data in its financial statements by careful selection, training and development of qualified staff, by organizational arrangements that provide appropriate division of responsibilities, and by communication programs aimed at ensuring that regulations, policies, standards and managerial authorities are understood throughout the Agency.
The Departmental Audit Committee is responsible for ensuring that the President has independent, objective advice, guidance, and assurance as to the adequacy of the Agency's control and accountability processes. In order to give this support to the President, the Departmental Audit Committee exercises active oversight of core areas of the Agency's controls and accountabilities, including values and ethics, risk management, management control framework, internal audit functions, and accountability reporting.
The financial statements of the Agency have been audited by the Auditor General of Canada, the independent auditor for the Government of Canada.
Stephen Baker Vice-President, Finance, Administration and Information Technology
Ottawa, Canada
August 7, 2009
Carole Swan, President
Ottawa, Canada
August 7, 2009
| 2009 | 2008 | |
|---|---|---|
| ASSETS | ||
| Financial assets: | ||
| Due from the Consolidated Revenue Fund | $64,568 | $77,326 |
| Accounts receivable and advances (Note 4) | 6,768 | 8,679 |
| 71,336 | 86,005 | |
| Non-financial assets: | ||
| Inventory | 1,220 | 1,310 |
| Tangible capital assets (Note 5) | 201,713 | 203,190 |
| 202,933 | 204,500 | |
| TOTAL ASSETS | $274,269 | $290,505 |
| LIABILITIES | ||
| Accounts payable and accrued liabilities | $87,875 | $81,773 |
| Vacation pay | 29,035 | 28,051 |
| Deferred revenue | 2,537 | 1,611 |
| Employee severance benefits (Note 6) | 107,509 | 90,569 |
| 226,956 | 202,004 | |
| EQUITY OF CANADA | 47,313 | 88,501 |
| $274,269 | $290,505 |
Contingent liabilities (Note 8)
Contractual obligations (Note 9)
The accompanying notes are an integral part of these financial statements.
Stephen Baker Vice-President, Finance, Administration and Information Technology
Carole Swan, President
| 2009 | 2008 | ||||
|---|---|---|---|---|---|
| Food Safety and Public Health | Science and Regulation | Animal and Plant Resource Protection | Total | Total | |
| Revenues | |||||
| Inspection fees | $24,710 | $9,209 | $3,941 | $37,860 | $42,805 |
| Registrations, permits, certificates | 2,154 | 6,836 | 1,439 | 10,429 | 11,693 |
| Miscellaneous fees and services | 9 | 2,239 | 1,240 | 3,488 | 3,878 |
| Establishment license fees | 1,716 | 139 | - | 1,855 | 1,776 |
| Grading | 236 | 2 | - | 238 | 224 |
| Administrative monetary penalties | 365 | - | - | 365 | 522 |
| Interest | 36 | 5 | 23 | 64 | 73 |
| Total Revenues | 29,226 | 18,430 | 6,643 | 54,299 | 60,971 |
| Operating expenses | |||||
| Salaries and employee benefits | 347,491 | 66,559 | 168,918 | 582,968 | 578,477 |
| Professional and special services | 38,413 | 13,350 | 19,658 | 71,421 | 72,979 |
| Accommodation | 16,029 | 141 | 10,754 | 26,924 | 22,722 |
| Amortization | 14,188 | 2,073 | 8,928 | 25,189 | 24,124 |
| Travel and relocation | 10,948 | 2,284 | 8,511 | 21,743 | 28,143 |
| Utilities, materials and supplies | 11,216 | 1,112 | 7,085 | 19,413 | 22,789 |
| Communications | 5,964 | 912 | 4,973 | 11,849 | 11,377 |
| Repairs | 1,840 | 1,352 | 4,695 | 7,887 | 9,888 |
| Furniture and equipment | 4,051 | 694 | 2,909 | 7,654 | 11,332 |
| Information | 893 | 271 | 2,799 | 3,963 | 5,194 |
| Equipment rentals | 426 | 80 | 1,763 | 2,269 | 2,301 |
| Miscellaneous | 682 | 164 | 289 | 1,135 | 1,901 |
| Loss on disposal of tangible capital assets | 259 | 38 | 163 | 460 | 98 |
| Total operating expenses | 452,400 | 89,030 | 241,445 | 782,875 | 791,325 |
| Compensation payments (Note 7) | - | - | 20,480 | 20,480 | 10,630 |
| Other | 1,406 | 160 | 770 | 2,336 | 2,682 |
| Total transfer payments | 1,406 | 160 | 21,250 | 22,816 | 13,312 |
| Total Expenses | 453,806 | 89,190 | 262,695 | 805,691 | 804,637 |
| Net Cost of Operations | $424,580 | $70,760 | $256,052 | $751,392 | $743,666 |
The accompanying notes are an integral part of these financial statements.
| 2009 | 2008 | |
|---|---|---|
| Equity of Canada, beginning of year | $88,501 | $91,095 |
| Net cost of operations | (751,392) | (743,666) |
| Net cash provided by Government of Canada | 657,802 | 679,972 |
| Change in due from the Consolidated Revenue Fund | (12,758) | 682 |
| Services received without charge from other government departments (Note 10) | 64,746 | 60,037 |
| Assets funded by other government departments | 414 | 381 |
| Equity of Canada, end of year | $47,313 | $88,501 |
The accompanying notes are an integral part of these financial statements.
| 2009 | 2008 | |
|---|---|---|
| Operating activities | ||
| Cash received from: Fees, permits and certificates | $(57,001) | $(60,298) |
| Cash paid for: | ||
| Salaries and employee benefits | 516,620 | 516,093 |
| Operating and maintenance | 149,031 | 189,502 |
| Transfer payments | 25,784 | 10,040 |
| Cash used by operating activities | 634,434 | 655,337 |
| Capital investment activities | ||
| Acquisition of tangible capital assets | 23,425 | 25,252 |
| Proceeds from disposal of assets | (57) | (617) |
| Cash used by capital investment activities | 23,368 | 24,635 |
| Financing activity | ||
| Net cash provided by Government of Canada | (657,802) | (679,972) |
| Net cash used | $ - | $ - |
The accompanying notes are an integral part of these financial statements.
CANADIAN FOOD INSPECTION AGENCY
Notes to the Financial Statements
Year ended March 31, 2009
1. Authority and Purposes
The Canadian Food Inspection Agency (the "Agency") was established, effective April 1, 1997, under the Canadian Food Inspection Agency Act. The Act consolidates all federally mandated food and fish inspection services and federal animal and plant health activities into a single agency.
The Agency is a departmental corporation named in Schedule II to the Financial Administration Act and reports to Parliament through the Minister of Agriculture and Agri-Food.
The mandate of the Agency is to enhance the effectiveness and efficiency of federal inspection and related services for food, animals and plants. The objectives of the Agency are to contribute to a safe food supply and accurate product information; to contribute to the continuing health of animals and plants; and to facilitate trade in food, animals, plants, and related products.
In delivering its mandate, the Agency operates under the following program activities:
- a) Food Safety and Public Health: ensures that food is safe, consumers have appropriate information on which to base healthy food choices and prevents the transmission of animal disease to humans.
- b) Science and Regulation: provides a fair and effective regulatory regime for food, animals and plants, and maintains the integrity of the Agency’s regulatory policy, inspection and certification activities.
- c) Animal and Plant Resource Protection: protects Canada’s livestock, crops and forests from regulated pests and diseases including invasive species and regulates agricultural products, including products of biotechnology.
The Agency is responsible for the administration and enforcement of the following acts: Agriculture and Agri-Food Administrative Monetary Penalties Act, Canada Agricultural Products Act, Canadian Food Inspection Agency Act, Feeds Act, Fertilizers Act, Fish Inspection Act, Health of Animals Act, Meat Inspection Act, Plant Breeders' Rights Act, Plant Protection Act, and Seeds Act.
In addition, the Agency is responsible for enforcement of the Consumer Packaging and Labelling Act and the Food and Drugs Act as they relate to food, except those provisions that relate to public health, safety, or nutrition.
The Minister of Health remains responsible for establishing policies and standards relating to the safety and nutritional quality of food sold in Canada. The Minister of Health is also responsible for assessing the effectiveness of the Agency’s activities related to food safety.
Operating and capital expenditures are funded by the Government of Canada through parliamentary appropriations. Compensation payments under the Health of Animals Act and the Plant Protection Act and employee benefits are authorized by separate statutory authorities. Revenues generated by its operations are deposited to the Consolidated Revenue Fund and are available for use by the Agency.
2. Summary of Significant Accounting Policies
The financial statements are prepared in accordance with Treasury Board accounting policies and year-end instructions issued by the Office of the Comptroller General which are consistent with Canadian generally accepted accounting principles for the public sector as required under Section 31 of the Canadian Food Inspection Agency Act.
Significant accounting policies are as follows:
a) Parliamentary appropriations
The Agency is mainly financed by the Government of Canada through parliamentary appropriations. Appropriations provided
to the Agency do not parallel financial reporting according to generally accepted accounting principles since appropriations
are primarily based on cash flow requirements. Consequently, items recognized in the statement of operations and the statement
of financial position are not necessarily the same as those provided through appropriations from Parliament. Note 3 provides
a high level reconciliation between the bases of reporting.
b) Net cash provided by Government of Canada
The Agency operates within the Consolidated Revenue Fund (CRF), which is administrated by the Receiver General for Canada.
All cash received by the Agency is deposited to the CRF and all cash disbursements made by the Agency are paid from the
CRF. The net cash provided by Government is the difference between all cash receipts and all cash disbursements including
transactions between departments of the federal government.
c) Due from the Consolidated Revenue Fund (CRF)
Due from the CRF represents the net amount of cash that the Agency is entitled to draw from the CRF without further appropriations
to discharge its liabilities. These amounts have been charged to current or prior years’ appropriations but will be paid
in the future.
d) Revenues
Revenues for fees, permits and certificates are recognized in the accounts based on the services provided in the year.
Funds received from external parties for specified purposes are recorded upon receipt as deferred revenue. Revenue from external parties for specified purposes is recognized in the period in which the related expenses are incurred.
Other revenues are accounted for in the period in which the underlying transaction or event occurred that gave rise to the revenues.
e) Expenses
Expenses are recorded on an accrual basis:
- Contributions are recognized in the year in which the recipient has met the eligibility criteria or fulfilled the terms of a contractual transfer agreement.
- Vacation pay and compensatory leave are expensed as the benefits accrue to employees under their respective terms of employment.
- Services received without charge from other government departments for accommodation, the employer’s contribution to the health and dental insurance plans and legal services are recorded as operating expenses at their estimated cost.
f) Employee future benefits
- (i) Pension benefits:
The Agency's eligible employees participate in the Public Service Pension Plan (Plan), a multi-employer plan administered by the Government of Canada. Both the employees and the Agency contribute to the cost of the Plan. The Agency’s contributions are expensed during the year in which the services are rendered and represent the total pension obligation of the Agency. The Agency is not required under present legislation to make contributions with respect to actuarial deficits of the Plan. - (ii) Severance benefits:
Eligible employees are entitled to severance benefits, as provided for under labor contracts and conditions of employment. The cost of these benefits is accrued as employees render the services necessary to earn them. The obligation relating to the benefits earned by employees is calculated using information derived from the results of the actuarially determined liability for employee severance benefits for the Government as a whole. - (iii) Other future benefit plans:
The federal government sponsors a variety of other future benefit plans from which employees and former employees can benefit during or after employment or upon retirement. The Public Service Health Care Plan and the Pensioners’ Dental Services Plan represent the two major future benefit plans available to the Agency’s employees.
The Agency does not pay for these programs as they fall under the federal government’s financial responsibilities, but the Agency records its share of the annual benefits paid under these programs as a service received without charge from other government departments. No amount is recorded in the Agency’s financial statements with regard to either the actuarial liability of these programs at year end or the annual increase of such liabilities.
g) Accounts receivable and advances
Accounts receivable and advances are stated at amounts expected to be ultimately realized; a provision is made for receivables
where recovery is considered uncertain.
h) Contingent liabilities
Contingent liabilities are potential liabilities which may become actual liabilities when one or more future events occur
or fail to occur. To the extent that the future event is likely to occur or fail to occur, and a reasonable estimate of
the loss can be made, an estimated liability is accrued and an expense recorded. If the likelihood is not determinable or
an amount cannot be reasonably estimated, the contingency is disclosed in the notes to the financial statements.
i) Environmental liabilities
Environmental liabilities reflect the estimated costs related to the management and remediation of environmentally contaminated
sites. Based on management’s best estimates, a liability is accrued and an expense recorded when the contamination occurs
or when the Agency becomes aware of the contamination and is obligated, or is likely to be obligated to incur such costs.
If the likelihood of the Agency’s obligation to incur these costs is not determinable, or if an amount cannot be reasonably
estimated, the costs are disclosed as contingent liabilities in the notes to the financial statements.
j) Inventories
Inventories consist of laboratory materials, supplies and livestock held for future program delivery and not intended for
re-sale. They are valued at cost. If they no longer have service potential, they are valued at the lower of cost or net
realizable value.
k) Tangible capital assets
All tangible capital assets and leasehold improvements having an initial cost of $10,000 ($3,000 for computer equipment
and software) or more are recorded at their acquisition cost. Amortization of tangible capital assets is done on a straight-line
basis over the estimated useful life of the asset as follows:
| Asset class | Amortization Period |
|---|---|
| Buildings | 20-30 years |
| Machinery and equipment | 5-20 years |
| Computer equipment and software | 3-10 years |
| Vehicles | 7-10 years |
| Leasehold improvements | Lesser of the remaining term of the lease or useful life of the improvement |
| Assets under construction | Once in service, in accordance with asset class |
l) Measurement uncertainty
The preparation of these financial statements in accordance with Treasury Board accounting policies and year-end instructions
issued by the Office of the Comptroller General, which are consistent with Canadian generally accepted accounting principles
for the public sector, requires management to make estimates and assumptions that affect the amounts of assets, liabilities,
revenues and expenses reported in the financial statements. At the time of preparation of these statements, management believes
the estimates and assumptions to be reasonable. The most significant items where estimates are used are contingent liabilities
(include claims and litigation), the liability for employee severance benefits and the useful life of tangible capital assets.
Actual results could significantly differ from those estimated. Management’s estimates are reviewed periodically and, as
adjustments become necessary, they are recorded in the financial statements in the year they become known.
3. Parliamentary Appropriations
The Agency receives most of its funding through annual Parliamentary appropriations. Items recognized in the statement of operations and the statement of financial position in one year may be funded through Parliamentary appropriations in prior, current or future years. Accordingly, the Agency has different net results of operations for the year on a government funding basis than on an accrual accounting basis. The differences are reconciled in the following tables:
a) Reconciliation of net cost of operations to current year appropriations used:
| (in thousands of dollars) | 2009 | 2008 |
|---|---|---|
| Net cost of operations | $751,392 | $743,666 |
| Adjustments for items affecting net cost of operations but not affecting appropriations: | ||
| Add (less): | ||
| Services received without charge from other government departments | (64,746) | (60,037) |
| Amortization of tangible capital assets | (25,189) | (24,124) |
| Revenue not available for spending | 415 | 607 |
| Net changes in future funding requirements | (39,713) | (3,520) |
| Low value assets funded by other government departments | (47) | (132) |
| Loss on disposal of tangible capital assets | (460) | (98) |
| Post-capitalization of tangible capital assets | 439 | 264 |
| (129,301) | (87,040) | |
| Adjustments for items not affecting net cost of operations but affecting appropriations: | ||
| Add (less): | ||
| Acquisition of tangible capital assets | 23,425 | 25,252 |
| Proceeds from disposal of assets | (57) | (617) |
| 23,368 | 24,635 | |
| Current year appropriations used | $645,459 | $681,261 |
b) Appropriations provided and used:
| (in thousands of dollars) | 2009 | 2008 |
|---|---|---|
| Vote 30 - Operating expenditures | $557,710 | $601,941 |
| Vote 35 - Capital expenditures | 44,396 | 26,493 |
| Statutory contributions to employee benefits plans and compensation payments | 94,853 | 85,872 |
| Less: | ||
| Appropriations available for future years | (19) | (386) |
| Lapsed appropriation – operating | (33,143) | (28,488) |
| Lapsed appropriation – capital | (18,338) | (4,171) |
| Current year appropriations used | $645,459 | $681,261 |
c) Reconciliation of net cash provided by Government to current year appropriations used:
| (in thousands of dollars) | 2009 | 2008 |
|---|---|---|
| Net cash provided by Government of Canada | $657,802 | $679,972 |
| Revenue not available for spending | 415 | 607 |
| Change in due from the Consolidated Revenue Fund | ||
| Variation in accounts receivable and advances | 1,911 | 9,481 |
| Variation in accounts payables and accrued liabilities | 6,102 | (12,422) |
| Variation in deferred revenue | 926 | (773) |
| Other adjustments | (21,697) | 4,396 |
| (12,758) | 682 | |
| Current year appropriations used | $645,459 | $681,261 |
4. Accounts Receivable and Advances
The following table presents details of accounts receivable and advances:
| (in thousands of dollars) | 2009 | 2008 |
|---|---|---|
| Receivables from other government departments and agencies | $1,245 | $2,448 |
| Receivables from external parties | 5,793 | 6,731 |
| Employee advances | 113 | 150 |
| Other | 106 | - |
| 7,257 | 9,329 | |
| Less: | ||
| Allowance for doubtful accounts on external receivables | (489) | (650) |
| Total | $6,768 | $8,679 |
5. Tangible Capital Assets
| Capital asset class | Cost | Accumulated amortization | Net book value | |||||||
|---|---|---|---|---|---|---|---|---|---|---|
| Opening balance | Acqui- sitions | Disposals and writeoffs | Closing balance | Opening balance | Amorti- zation | Disposals and writeoffs | Closing balance | 2009 | 2008 | |
| Land | $3,331 | $ - | $ - | $3,331 | $ - | $ - | $ - | $ - | $3,331 | $3,331 |
| Buildings | 253,192 | 1,242 | 2,167 | 252,267 | 159,053 | 9,142 | 2,137 | 166,058 | 86,209 | 94,139 |
| Machinery and equipment | 79,288 | 4,282 | 4,776 | 78,794 | 30,927 | 4,997 | 4,544 | 31,380 | 47,414 | 48,361 |
| Computer equipment and software | 48,067 | 1,870 | 7,706 | 42,231 | 37,112 | 4,866 | 7,639 | 34,339 | 7,892 | 10,955 |
| Vehicles | 35,078 | 345 | 661 | 34,762 | 15,459 | 4,732 | 529 | 19,662 | 15,100 | 19,619 |
| Assets under construction | 20,836 | 16,657 | 2,849 | 34,644 | - | - | - | - | 34,644 | 20,836 |
| Leasehold improvements | 13,197 | 2,717 | 102 | 15,812 | 7,248 | 1,452 | 11 | 8,689 | 7,123 | 5,949 |
| Total | $452,989 | $27,113 | $18,261 | $461,841 | $249,799 | $25,189 | $14,860 | $260,128 | $201,713 | $203,190 |
Amortization expense for the year ended March 31, 2009 is $25,189 (2008 - $24,124).
6. Employee Benefits
(a) Pension benefits
The Agency’s employees participate in the Public Service Pension Plan (Plan), a multi-employer plan, which is sponsored and administered by the Government of Canada. Pension benefits accrue up to a maximum period of 35 years at a rate of 2 percent per year of pensionable service times the average of the best five consecutive years of earnings. The benefits are integrated with Canada/Quebec Pension Plans benefits and are indexed to inflation.
Both the employees and the Agency contribute to the cost of the Plan. In 2008-2009, the Agency contributed $53,472,000 (2008 - $54,322,000), which represents approximately 2.03 times (2008 – 2.23 times) the contributions by employees.
The Agency's responsibility with regard to the Plan is limited to its contributions. Actuarial surpluses or deficiencies are recognized in the financial statements of the Government of Canada, as the Plan's sponsor.
(b) Severance benefits
The Agency provides severance benefits to its employees based on eligibility, years of service and final salary. These severance benefits are not pre-funded and thus have no assets, resulting in a plan deficit equal to the accrued benefit obligation. Benefits will be paid from future appropriations. Information about the severance benefits, measured for March 31, is as follows:
| (in thousands of dollars) | 2009 | 2008 |
|---|---|---|
| Accrued benefit obligation, beginning of year | $90,569 | $83,564 |
| Expense for the year | 24,683 | 14,127 |
| Benefits paid during the year | (7,743) | (7,122) |
| Accrued benefit obligation, end of year | $107,509 | $90,569 |
7. Compensation Payments
The Health of Animals Act and the Plant Protection Act allow for the Minister, via the Agency, to compensate owners of animals and plants destroyed pursuant to the Acts. During the year, compensation payments incurred pursuant to these two Acts totaled $20,480,000 (2008 - $10,630,000). These payments pertained to the following diseases:
| (in thousands of dollars) | 2009 | 2008 |
|---|---|---|
| Sudden Oak Death | $10,478 | $7,052 |
| Chronic Wasting Disease | 6,306 | 1,180 |
| Avian Influenza | 1,198 | 468 |
| Plum Pox Virus | 720 | 315 |
| Asian Long Horn Beetle | 469 | 105 |
| Scrapie | 444 | 10 |
| Emerald Ash Borer | 98 | 507 |
| Other | 767 | 993 |
| $20,480 | $10,630 |
8. Contingent Liabilities
a) Contaminated sites
Liabilities are accrued to record the estimated costs related to the management and remediation of contaminated sites where
the Agency is obligated or likely to be obligated to incur such costs. There are currently no known contaminated sites identified
where such action is possible. The Agency’s ongoing effort to assess contaminated sites may result in additional environmental
liabilities related to newly identified sites, or changes in the assessments or intended use of existing sites. These liabilities
will be accrued by the Agency in the year in which they become known.
b) Claims (including legal claims and employee grievances) and litigation
Claims relating to both legal and employee grievances have been made against the Agency in the normal course of operations. Some of these potential liabilities may become actual liabilities when one or more future events occur or fail to occur. To the extent that the future event is likely to occur or fail to occur, and a reasonable estimate of the loss can be made, an estimate of liability is accrued and an expense recorded in the financial statements.
Amounts have been accrued for contingent liabilities as at March 31, 2009 pertaining to legal claims. The amount of the contingent liabilities for legal claims recognized is based on management’s best estimate. Other legal claims against the Agency and other defendants include class actions suits related to bovine spongiform encephalopathy (BSE) for which amounts and likelihood of liability cannot be determined. The limited disclosure regarding the contingent liabilities for legal claims recognized by the Agency is a direct reflection of the sensitivity and status of on-going claims.
No amounts have been accrued pertaining to employee grievances as at March 31, 2009.
9. Contractual Obligations
The nature of the Agency’s activities can result in some large multi-year contracts and agreements whereby the Agency will be obligated to make future payments when the services/goods are received. Significant contractual obligations that can be reasonably estimated are summarized as follows:
| (in thousands of dollars) | 2010 | 2011 | 2012 | 2013 | 2014 and thereafter |
Total |
|---|---|---|---|---|---|---|
| Capital projects | $6,945 | $ 24 | $ - | $ - | $ - | $6,969 |
| Operating leases | 60 | 5 | 3 | - | - | 68 |
| Transfer payments | 1,165 | 634 | - | - | - | 1,799 |
| Other agreements | 8,026 | 3,027 | 2,210 | 1,653 | 1,623 | 16,539 |
| Total | $16,196 | $3,690 | $2,213 | $1,653 | $1,623 | $25,375 |
10. Related Party Transactions
The Agency is related as a result of common ownership to all Government of Canada departments, agencies, and Crown corporations. The Agency enters into transactions with these entities in the normal course of business and on normal trade terms.
a) Services received without charge from other government departments
During the year, the Agency received without charge from other departments, the employer’s contribution to the health and dental insurance plans, accommodation, legal services, and audit services. These services without charge have been recognized in the Agency’s statement of operations as follows:
| (in thousands of dollars) | 2009 | 2008 |
|---|---|---|
| Employer’s contribution to the health and dental insurance plans | $37,006 | $36,031 |
| Accommodation | 26,627 | 22,238 |
| Legal services | 886 | 1 586 |
| Audit services | 225 | 182 |
| Other | 2 | - |
| $64,746 | $60,037 |
The Government of Canada has structured some of its administrative activities for efficiency and cost-effectiveness purposes so that one department performs these on behalf of all without charge. The cost of these services, which include payroll and cheque issuance services provided by Public Works and Government Services Canada, are not included in the Agency's statement of operations.
b) Receivables and payables outstanding at year-end with related parties are as follows:
| (in thousands of dollars) | 2009 | 2008 |
|---|---|---|
| Accounts receivable from other government departments and agencies | $1,245 | $2,448 |
| Accounts payable to other government departments and agencies | 10,814 | 7,913 |
11. Comparative Information
Certain comparative figures have been reclassified to conform to the current year’s presentation.
3.2 List of Supplementary Information Tables
- Sources of Respendable and Non-Respendable Revenue
- Sources of Respendable Revenue
- Sources of Non-Respendable Revenue
- 2008-09 User Fee Reporting - User Fees Act
- Details on Project Spending
- Details on Transfer Payments Programs
- Agency Regulatory Plans
- Horizontal Initiatives
- Table A: CFIA-led initiative – National Aquatic Animal Health Program
- Table B: All Other Horizontal Initiatives.
- Internal Audits and Evaluations
- Table A: Audits
- Table B: Evaluations
- Response to Parliamentary Committees and External Audits
- Green Procurement
3.3 Other Items of Interest
- RPP Commitments Performance Table
- Operational Commitments
- Management Commitments
- Summary of Performance Indicators
- Performance Indicators by Operational Priority
- Further Information on the Assessment of Compliance
1 Strategic outcome: Long-term and enduring benefit to Canadians that stems from the Agency’s vision and mission. It represents the difference the Agency intends to make for Canadians.
2 A frozen allotment is the result of a direction from the Treasury Board Secretariat to withhold spending on a specific initiative until the organization has met one or more conditions.
3 Full Time Equivalent (FTE): A measure of human resource consumption. It calculates the number of assigned hours of work over the total hours of regularly scheduled work (37.5 hours per week over 12 months). For example, an employee who works half-time (18.75 hours per week) over a 12 month period is equivalent to a 0.5 FTE.
4 This is the net change in FTEs in 2008-09, including all hires and departures.
5 For more information on Government of Canada Outcomes, please refer to: http://www.tbs-sct.gc.ca/pubs_pol/dcgpubs/mrrsp-psgrr/wgf-cp-eng.asp
6 Zoonotic: Zoonotic diseases are diseases transmissible from animals to humans.
7 The Agency does not have specific performance indicators at the strategic outcome level. The summary presented here is supported by the performance information outlined in Sections II and III. This also applies to the Performance 2008-09 section in tables 1-2 and 1-3.
8 The "2007-08 Actual Spending" data has been modified to reflect the CFIA's current PAA. This also applies to the 2007-08 Actual Spending data in Tables 1-2 and 1-3.
9 In 2008-09, the CFIA transitioned to a new PAA which included the re-allocation of Internal Services spending and FTEs across the new program activities. This has affected the comparability of spending and FTE information between the 2007-08 and 2008-09 fiscal years.
10 The 2007-08 Actual Spending figure includes a one-time payment of $20 million for settlement of the reclassification of meat inspector positions.
11 In 2008-09, the CFIA transitioned to a new PAA which included the re-allocation of Internal Services spending and FTEs across the new program activities. This has affected the comparability of spending and FTE information between the 2007-08 and 2008-09 fiscal years.
12 In 2008-09, the CFIA transitioned to a new PAA which included the re-allocation of Internal Services spending and FTEs across the new program activities. This has affected the comparability of spending and FTE information between the 2007-08 and 2008-09 fiscal years.
13 Refer to Tables 2-2 through 2-8 in Section 2.2 for the relevant data systems and process controls rating for each performance indicator.
14 For more details on risk areas, please refer to section 1.5.
15 The jurisdiction for inspection of non-federally registered establishments is shared with provincial/territorial governments. These establishments are managed using a risk-based management model, where the CFIA prioritizes its compliance activities in areas of high risk, taking enforcement actions in areas of low compliance and gathering intelligence related to contraventions.
16 For further performance analysis regarding federally registered meat establishments, see Table 2-2.
17 In 2008-09, the CFIA transitioned to a new PAA which included the re-allocation of Internal Services spending and FTEs across the new program activities. This has affected the comparability of spending and FTE information between the 2007-08 and 2008-09 fiscal years.
18 Where applicable, performance indicator results have been rounded off.
19 Sub-indicators are detailed measures of performance that are rolled-up to provide an overall summary of results for an individual performance indicator.
20 The new wording for this indicator and target is also included in sections 3.3.2 and 3.3.3.
21 The OIE's Terrestrial Animal Health Code is used to determine a risk classification for a country or zone on the management of human and animal health risks associated with the presence of BSE. There are three risk categories: negligible risk, controlled risk and undetermined risk. The controlled risk category describes commodities from a country or zone that pose a negligible risk of transmitting the BSE agent due to commodity-specific risk mitigation measures. The respective country or zone must demonstrate an education and reporting program; an effective feed ban; and identify, track and destroy certain progeny and herd mates of the BSE-infected animal. The OIE Terrestrial Animal Health Code is available at: http://www.oie.int/eng/normes/mcode/en_sommaire.htm. Refer to Chapter 11.6 of the Code for information on BSE.
22 In 2008-09, the CFIA transitioned to a new PAA which included the re-allocation of Internal Services spending and FTEs across the new program activities. This has affected the comparability of spending and FTE information between the 2007-08 and 2008-09 fiscal years.
23 In 2008-09, the CFIA transitioned to a new PAA which included the re-allocation of Internal Services spending and FTEs across the new program activities. This has affected the comparability of spending and FTE information between the 2007-08 and 2008-09 fiscal years.
24 This indicator reflects only foreign animal diseases. The CFIA also conducts a wide variety of activities with regard to animal diseases already established in Canada. Performance measures to illustrate performance in this regard will be developed and will be reported on in future years.
25 Major deviations with respect to the Enhanced Feed Ban could include: evidence of cross-contamination of ruminant feed with prohibited material, the unavailability of written procedures and required records, and labeling violations. Major deviations with respect to the Feeds Regulations could include: evidence of cross-contamination with medications, the unavailability of required records and labeling violations.
26 The low number of establishments means one incidence of non-compliance drops the overall rate by 2.2 per cent.
27 For further discussion of market access related to PCN, refer to section 2.2.3 Domestic and International Market Access.
28 The Agency’s work in this area also falls under the Integrated Regulated Frameworks program activity.
29 In 2008-09, the CFIA transitioned to a new PAA which included the re-allocation of Internal Services spending and FTEs across the new program activities. This has affected the comparability of spending and FTE information between the 2007-08 and 2008-09 fiscal years.
30 In 2008-09, the CFIA transitioned to a new PAA which included the re-allocation of Internal Services spending and FTEs across the new program activities. This has affected the comparability of spending and FTE information between the 2007-08 and 2008-09 fiscal years.
31 No performance indicators for the Biodiversity Protection program activity were identifed in the 2008-09 RPP. The Agency decided to create a new indicator, comprised of four sub-indicators: two sub-indicators (Plants with Novel Traits and Novel Fertilizer) were drawn from the 2007-2008 Performance Report and two sub-indicators (Feed and Veterinary Biologics) were newly created.
32 As performance indicators for this program activity were not set in the 2008-09 RPP, there were also no targets specified. The targets for the Plants with Novel Traits and Novel Fertilizer sub-indicators have been brought forward from the 2007-2008 Performance Report.
33 In 2008-09, the CFIA transitioned to a new PAA which included the re-allocation of Internal Services spending and FTEs across the new program activities. This has affected the comparability of spending and FTE information between the 2007-08 and 2008-09 fiscal years.
34 There are instances where a regulatory initiative would be published in the Canada Gazette, Part II, without being pre-published in the Canada Gazette, Part I.
35 In 2008-09, the CFIA transitioned to a new PAA which included the re-allocation of Internal Services spending and FTEs across the new program activities. This has affected the comparability of spending and FTE information between the 2007-08 and 2008-09 fiscal years.
36 No data was available for 2008-09; as such, the Agency is unable to provide a data system quality rating.
37 No data was available for 2008-09; as such, the Agency is unable to provide a data system quality rating.
38 The "Actual 2006-07" data has been restated to reflect the CFIA's current PAA. This also applies to the 2006–07 Actual Spending data for Non-Respendable Revenue and the 2006-07 Actual Spending data in Section 3.2.4 details on Transfer Payments Programs.
39 The "Actual 2006-07" data has been restated to reflect the CFIA's current PAA. This also applies to the 2006–07 Actual Spending data for Non-Respendable Revenue and the 2006-07 Actual Spending data in Section 3.2.4 details on Transfer Payments Programs.
40 R = Regulating; O = Other products and services.
41 The Full Cost includes all direct and indirect expenditures. In addition to each sub-activity’s share of Governance and Management expenditures, it also includes services provided without charge by other government departments.
42 These figures are taken from the reference levels established in the Annual Reference Level Update (ARLU) and include the estimated amounts of services provided without charges by other government departments.
43 For more information on the One World, One Health concept, visit: http://www.oneworldonehealth.org/index.html
44 At the CFIA, the HACCP system is designed to help processors meet food safety standards by implementing processing controls throughout production, thus preventing food safety hazards from occurring.
45 Discontinued due to changes in program design.
46 Postponed pending implementation of 2008 audit recommendations.
47 Cancelled and integrated with Food and Consumer Safety Action Plan.
48 Meat Inspection Reform has been re-named Meat Inspection–Continuous Improvements. This initiative is also discussed in Section 2.2.1 under the Food Safety and Nutrition Risks program activity.