Common menu bar links
Breadcrumb Trail
ARCHIVED - Economic Development Agency of Canada for the Regions of Quebec
 This page has been archived.
Archived Content
Information identified as archived on the Web is for reference, research or recordkeeping purposes. It has not been altered or updated after the date of archiving. Web pages that are archived on the Web are not subject to the Government of Canada Web Standards. As per the Communications Policy of the Government of Canada, you can request alternate formats on the "Contact Us" page.
3 Additional information
3.1 Significant financial data
The financial highlights presented in this report are intended to provide a general overview of the Agency’s operations and financial situation. Detailed Financial Statements33 are to be found on the Agency’s Web site.
The actual expenditures presented in the preceding tables were prepared on a cash basis, while the financial highlights that follow were prepared on an accrual basis; tables reconciling these two accounting methods are presented in the Notes to the Agency’s Financial Statements (note 3).
Summary financial information as at March 31, 2009
FINANCIAL HIGHLIGHTS
| (In thousands of dollars) | Percentage variance | 2009 | 2008 |
|---|---|---|---|
| For the period ending March 31: Summary of financial situation | |||
| Assets | |||
| Total assets | -3% | 152,335 | 156,476 |
| TOTAL | -3% | 152,335 | 156,476 |
| Liabilities | |||
| Total liabilities34 | -42% | 53,825 | 93,087 |
| �quity | |||
| Total equity | -55% | 98,510 | 63,389 |
| TOTAL | -3% | 152,335 | 156,476 |
| For the period ending March 31: Summary of results | |||
| Expenditures | |||
| Total expenditures | -15% | 264,970 | 312,662 |
| Revenue | |||
| Total revenues | 23% | 822 | 669 |
| Net operating cost | -15% | 264,148 | 311,993 |
For the period ending March 31, 2009
3.2 Financial highlights
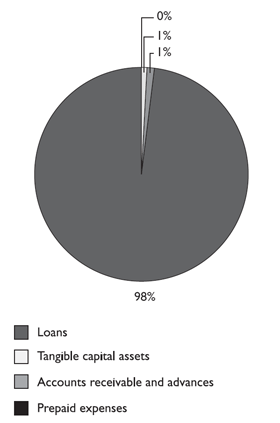
ASSETS

- Total assets of $152.3 million at the close of 2008-2009, down 3% from 2007-2008.
- Loans account for 97.8% of the Agency’s assets, or $149 million.
- Accounts receivable represent 0.5%, prepaid expenses 0.4%, and tangible capital assets 1.3% of total assets.
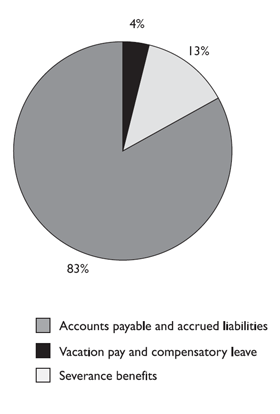
LIABILITIES

- Total liabilities of $53.8 million at the close of 2008-2009, down 42% from 2007-2008.
- The decrease in liabilities is primarily attributable to year-end payables ($66.2 million as at March 31, 2008 and $27.4 million as at March 31, 2009).
- Accounts payable account for the majority (83%) of liabilities, at $44.7 million.
- Vacation pay and compensatory leave, $1.9 million, and severance benefits, $7.2 million.
REVENUES

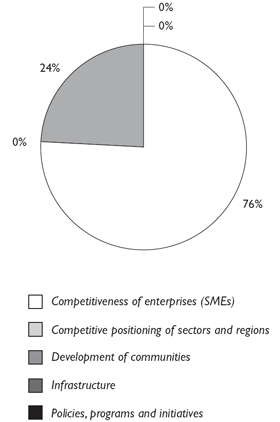
- Total revenues of $822,000 in 2008-2009.
- Revenue composed of interest ($629,000) and repayments above 100% ($193,000) on conditionally repayable and unconditionally repayable contributions.
EXPENSES

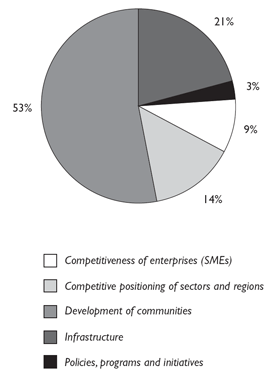
- Total expenses of $265 million in 2008-2009
- Expenses consist primarily of non-repayable and conditionally repayable contributions (totalling $206 million).
- The majority of funds ($140.3 million) used for development of Canada’s communities
- $54.4 million for Infrastructure
- $38.4 million for Competitive positioning of sectors and regions
- $24.5 million for Competitiveness of enterprises (SMEs)
- $7.4 million for Policies, programs and initiatives
3.3 Tables in electronic format posted on the Treasury Board Secretariat Website
The following tables are posted on the Treasury Board Secretariat Web site:
www.tbs-sct.gc.ca/dpr-rmr/2008-2009/index-eng.asp
Table 1: Sources of Non-respendable Revenue
The table illustrates revenue and provides an historical perspective. Revenue consists primarily of repayments of the repayable contributions awarded by the Agency.
Table 2a: User Fees Act
The table presents revenue and user fees costs.
Table 2b: Policy on Service Standards for User Fees
In line with the Policy on service standards for user fees, the table presents the latest performance results and main events or plans regarding stakeholder consultation.
Table 5: Details of Transfer Payment Programs (TPPs)
The table illustrates the results of TPPs in relation to commitments and planned results as set out in the 2008-2009 RPP where the amount of the transfer exceeds $5 million.
Table 8: Sustainable Development Strategy (SDS)
The table presents progress with respect to commitments made since the tabling of the SDS and the Agency’s expected results from the SDS as set out in the 2008-2009 RPP.
Table 10: Response to Parliamentary Committees and to External Audits
The table lists responses given to Parliamentary Committee reports, Auditor General of Canada reports and external audits concerning Agency activities in 2008-2009.
Table 11a: Internal Audits 2008-2009
The table lists internal audits reports.
Table 11b: Evaluations 2008-2009
The table lists evaluation reports.
Notes:
33 www.dec-ced.gc.ca/eng/publications/agency/rmr.html
34 The decrease in liabilities is primarily attributable to year-end payables ($66.2 million as at March 31, 2008 and $27.4 million as at March 31, 2009).
