Common menu bar links
Breadcrumb Trail
ARCHIVED - Transportation Safety Board of Canada
 This page has been archived.
Archived Content
Information identified as archived on the Web is for reference, research or recordkeeping purposes. It has not been altered or updated after the date of archiving. Web pages that are archived on the Web are not subject to the Government of Canada Web Standards. As per the Communications Policy of the Government of Canada, you can request alternate formats on the "Contact Us" page.
Section 2: Analysis of Program Activity
2.1 Performance Management Framework
The TSB's actual performance management framework consists of five documents. The five-year TSB Strategic Plan is used to set the strategic directions. The Report on Plans and Priorities outlines to parliamentarians and Canadians the results the organization plans to achieve with the resources entrusted to it and how it will measure its performance. The annual Business Plan states the key initiatives and activities in support of the corporate priorities. It also outlines the key priorities for each branch and division and the resource allocation decisions for the coming year. Finally, the Annual Report and the Departmental Performance Report close the accountability loop by respectively reporting to Parliament on the TSB activities, findings and recommendations and the results achieved with the resources allocated to the organization.
2.2 Performance Measurement Table
The following table shows the TSB performance measurement. It is now being revised to align it with the new organizational PAA and to meet the requirements of the Management and Results Structure Policy. The five priorities listed in Section 1.3.6 of this document are aimed at supporting and enhancing the TSB's ability to conduct safety investigations and communicate safety information.
| Overview of TSB Performance Measurement Table |
| Program Activity Architecture Level | Definition | Results | Indicators(*) |
| Strategic Outcome | To advance transportation safety, thereby reducing risks to people, property and the environment | Increased awareness of safety issues and a strengthened safety culture on the part of governments, industry and public | • Implementation of the Outreach Program • Availability of safety information and other transportation safety information on the web • Stakeholder and client awareness of TSB profile and impact of its activities • Cost of Business Plan projects • Safety outputs issued • Assessment of responses to TSB recommendations |
| Name | Expected Results | ||
| Program Activity | Safety Investigations | Timely implementation of safety actions by stakeholders to improve transportation safety for Canadians | • Cost of Business Plan projects • Timely safety actions taken |
| Program Sub-Activities | 1. Air Investigations 2. Marine Investigations 3. Rail/Pipeline Investigations 4. Professional and Communications Services |
Identification and communication to stakeholders and the public of safety deficiencies in the transportation system | • Number of transportation occurrences • Number of investigations started, in process and completed • Duration of completed investigations • Net cost of completed investigations by sector • Average net cost per investigations completed • Number of investigations started and completed by investigator • Number of safety outputs issued • Number of safety actions taken |
| (*) Unless otherwise specified, the data used in this report for these indicators come from the TSB information systems. | |||
2.3 TSB Resources by Sector
In order to optimize the use of resources and to effectively respond to its stakeholders, the TSB has four key sectors of service based on the four transportation modes included in its mandate: marine, pipeline, rail and air. This approach enables alignment with the transportation industry and the way it operates. As of 2008-2009, these sectors will become the four program activities of the organization.
Resources are therefore allocated and managed separately for each of these key service areas. The following table indicates planned and actual spending on financial and human resources for the key service areas in 2007-2008. Sections 2.8 to 2.11 provide detailed information on each key service.
| TSB Resources by Sector |
| Financial Resources (in thousands of dollars) | ||
| Planned Spending | Actual Spending* | |
| Marine | 7,103 | 7,405 |
| Pipeline | 576 | 600 |
| Rail | 6,732 | 7,018 |
| Air | 18,048 | 18,815 |
| Total | 32,458 | 33,839 |
| Human Resources (FTEs) | ||
| Marine | 53 | 49 |
| Pipeline | 4 | 4 |
| Rail | 49 | 45 |
| Air | 128 | 118 |
| Total | 235 | 216 |
| * Actual financial spending indicated in this table includes actual program activity expenditures plus the cost of services received without charge. Due to rounding, numbers may not sum exactly to totals. |
||
2.4 Occurrences Reported to the TSB
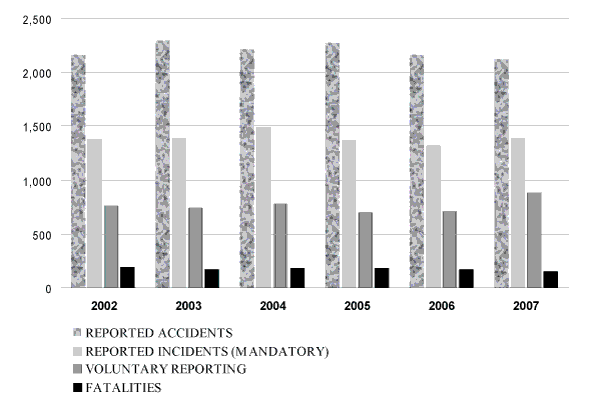
In 2007, a total of 2,119 accidents and 1,390 incidents were reported in accordance with the TSB's regulations for mandatory reporting of occurrences.1 The number of accidents in 2007 decreased by 2 per cent from the 2,161 accidents reported in 2006 and by 5 per cent from the 2002-2006 annual average of 2,223 accidents. The number of reported incidents increased to 1,390 in 2007 from 1,325 in 2006, but decreased from the 2002-2006 average of 1,392. There were also 886 voluntary occurrence reports. Fatalities totalled 155 in 2007, down 13 from the 2006 total and 26 from the 2002-2006 average.
 |
| Figure 1. | Occurrences Reported to the TSB[D]figure_1 |
Reported accidents and incidents provide indicators of the transportation system's safety performance and help focus efforts on those initiatives and activities that have high safety benefits.
2.5 Investigations Started, in Process and Completed
All reported occurrences were examined in accordance with the Board's Occurrence Classification Policy to identify those with the greatest potential for advancing transportation safety. Information was entered into the TSB database for historical record, trend analysis and safety deficiency validation purposes.
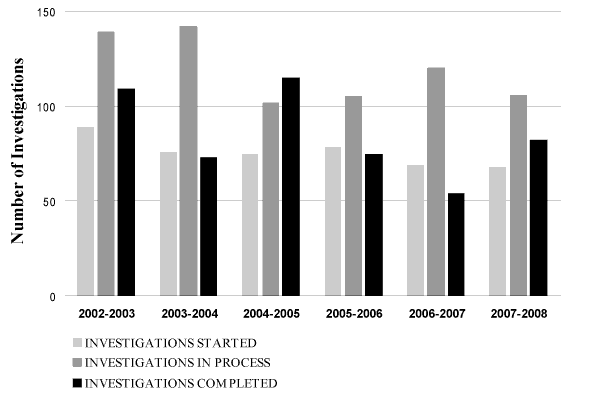
Investigations were undertaken for 68 of the approximately 3,900 occurrences reported to the TSB in fiscal year 2007-2008. In that same period, 82 investigations were completed, compared to 57 in the previous year.2 Out of the 82 investigations completed, 53.7 per cent (44) had started more than two years ago, 43.9 per cent (36) more than a year ago and 2.4 per cent (2) within a year. This backlog was more pronounced in the marine and rail sectors where respectively 94.7 per cent and 64.3 per cent of the investigations completed had started more than two years ago. The number of investigations in process decreased to 106 at the end of the fiscal year from 120 at the start.
 |
| Figure 2. | Investigations Started, in Process, and Completed[D]figure_2 |
While overall we were aiming at reducing the average time to complete each investigation, it has continued to increase, reaching 631 days in 2007-2008. This situation is due to a combination of factors, namely the efforts to close a larger number of old investigation files in the marine and rail sectors, and to release a number of high-profile investigation reports including our investigations of derailments along the Cheakamus River in British Columbia and Lake Wabamun in Alberta, our investigations of the grounding of the BC Ferries Queen of Oak Bay and the sinking of the BC Ferries Queen of the North as well as our investigations into the rudder loss of an Air Transat aircraft and the overrun of an Air France aircraft at the Lester B. Pearson International Airport in Toronto, Ontario.
Overall, the TSB has however been successful in identifying safety deficiencies and in reducing risks in the transportation system. TSB investigations result in reports identifying safety deficiencies and, where appropriate, containing recommendations to reduce risks. Over this past year, in all cases where the TSB undertook an investigation, safety deficiencies or contributing factors were identified and communicated. These results reflect careful application of the TSB's Occurrence Classification Policy in deciding whether to investigate, and a thorough implementation of the investigation methodology. This systematic approach ensures that TSB investigation resources are invested in areas with the greatest potential safety payoffs.
2.6 Safety Communications Issued
In 2007-2008, in addition to investigation reports, the TSB issued a total of 85 safety outputs, 28.2 per cent more than in 2006-2007 (61). These outputs comprise: 18 recommendations, 41 safety advisories and 26 safety information letters (see Appendix A for a definition of these terms). The TSB also identified 14 marine safety concerns, 6 rail safety concerns and 1 air safety concern. Sections 2.8 to 2.11 contain a breakdown by sector.
Safety information is also provided informally to the appropriate person or authority throughout the investigation process, permitting them to take immediate safety actions where appropriate. In such situations, rather than issuing recommendations, the TSB can then report on the corrective actions already taken by these stakeholders.
In accordance with the Canadian Transportation Accident Investigation and Safety Board Act, a federal minister who is notified of a TSB recommendation must, within 90 days, advise the Board in writing of any action taken or proposed to be taken in response, or the reasons for not taking action. The Board considers each response, assessing the extent to which the related safety deficiency was addressed. When a recommendation generates responses from within and outside Canada, the Board's assessment is based primarily on the Canadian response.
2.7 |
Communicating Transportation Safety to Canadians and the Transportation Community |
The 2007-2008 fiscal year was a very active year in terms of the number of communication and outreach activities to ensure the uptake of our recommendations and safety action, as described in Section 2.2 of our Annual Report. While it is difficult to measure the results of our efforts to increase the reach and stretch the envelope in our communications activities, tangible signs continue to point to a certain degree of effectiveness in terms of achieving target results. Stakeholders and media use TSB's safety messages in their activities. TSB techniques and methods raise ongoing interest in Canada and around the world.
|
Tap Test Missed Rudder Flaw
"TSB concluded in a report that a flaw in the composite material of the rudder was to blame for the incident that occurred to the Air Transat Airbus A310 when flying from Varadero, Cuba to Quebec City in March 2005. TSB officials say that pre-flight tests appeared to show nothing amiss with the A310's rudder. The composite is made of polymer resin strengthened by embedded carbon fibres. Under stress, the fibres can separate from the surrounding resin, creating a gap that weakens the material. When TSB investigators exposed damaged composites to air pressure changes similar to those caused by changing altitude during flights, they found that the areas of the damage almost doubled instantly. They concluded that the gap in the A310's rudder was small enough to pass unnoticed in the pre-flight tests but expanded in flight, causing the rudder to break up. Boeing and Airbus, among others, use the tap test. The TSB hopes to inspire the use of more reliable tests." Source: New Scientist, 01 December 2007. |
2.8 Marine Sector
2.8.1 Occurrences and Accident Rates
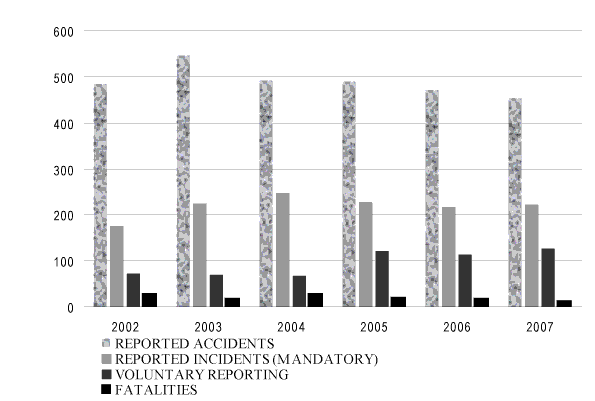
In all, 453 marine accidents were reported to the TSB in 2007, a 4 per cent decrease from the 2006 total of 472 and a 9 per cent decrease from the 2002-2006 average of 497. Marine fatalities totalled 14 in 2007, down from the 2006 total of 18 and the 2002-2006 average of 22.
Shipping accidents, which comprised 87 per cent of marine accidents, reached a 30-year low of 393 in 2007, down from 422 in 2006 and from the five-year average of 447. Nearly half of all vessels involved in shipping accidents were fishing vessels. Accidents to persons aboard ship, which include falls, electrocution, and other types of injuries requiring hospitalization, totalled 60 in 2007, a 20 per cent increase from the 2006 total of 50 and a 22 per cent increase from the five-year average of 49.
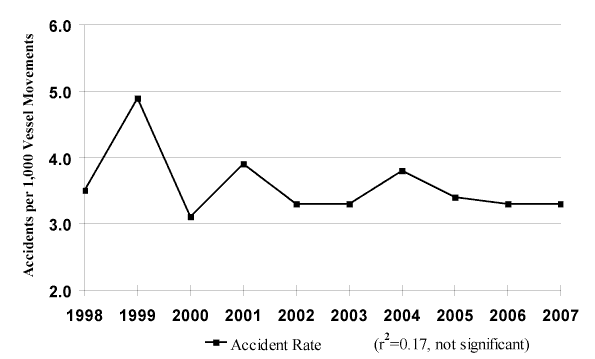
Marine activity for Canadian commercial non-fishing vessels over 15 gross tons (excluding passenger vessels and cruise ships) increased by 2 per cent from the 2002-2006 average, yielding a 3 per cent decrease in the accident rate to 3.3 accidents per 1,000 movements from the five-year average of 3.4. Marine activity for foreign commercial non-fishing vessels increased by 2 per cent from the 2002-2006 average while the accident rate decreased by 6 per cent decrease to 1.5 accidents per 1,000 movements, down from the five-year average of 1.6.
In 2007, shipping accidents resulted in 3 fatalities, down from 12 in 2006 and the five-year average of 15. Accidents aboard ship resulted in 11 fatalities, up 5 from the 2006 total and up 4 from the five-year average.
Twenty-eight vessels were reported lost in 2007, down from the 2006 total of 34 and the five-year average of 30.
In 2007, 222 marine incidents were reported to the TSB in accordance with the mandatory reporting requirements. This represents a 3 per cent increase from the 2006 total of 216 and a 2 per cent increase from the five-year average of 218.
 |
| Figure 3. | Marine Occurrences and Fatalities[D]figure_3 |
One indicator of marine safety in Canada is the Canadian-flag shipping accident rate. The 2007 accident rate has remained the same as 2006 at 3.3 accidents per 1,000 movements. No significant statistical trend was found over a 10-year period.
 |
| Figure 4. | Canadian-Flag Shipping Accident Rates[D]figure_4 |
2.8.2 Investigations and Safety Communications
In 2007-2008, 6 marine investigations were started and 19 investigations were completed. The number of investigations completed more than doubled compared to last year. This is due to a reduction of new investigations started and concentration of the Marine Branch efforts on the significant report backlog. The average duration of completed investigations increased to 936 days compared to 801 days the year before. This increase is attributable to concentrated efforts to complete older investigations and focus on completion of the complex Queen of the North report, which was the largest marine investigation in TSB history.
| Table 1: | Marine Productivity |
| 2003-2004 | 2004-2005 | 2005-2006 | 2006-2007 | 2007-2008 | |
| Investigations Started | 14 | 16 | 17 | 8 | 6 |
| Investigations Completed | 18 | 21 | 12 | 8 | 19 |
| Average Duration of Completed Investigations (Number of Days) |
953 | 881 | 651 | 801 | 936 |
| Recommendations | 7 | 4 | 6 | 0 | 3 |
| Safety Advisories | 6 | 9 | 5 | 8 | 12 |
| Safety Information Letters | 11 | 8 | 8 | 8 | 4 |
2.8.3 Safety Actions Taken
Three marine safety recommendations were issued in 2007-2008. To obtain additional information regarding these recommendations and the other safety actions taken by the change agents, consult Section 2.3.3 of our Annual Report to Parliament 2007-2008. In 2007-2008, there were no assessments or reassessments of responses to recommendations issued in previous years.
2.8.4 Link to Resources Utilized
Table 2 shows the net costs of marine investigations for Canadians. Net costs decreased over the previous fiscal year. The average net cost per completed investigation decreased by 60.6 per cent mainly because of the end of the operations surrounding the sinking of the ferry Queen of the North. The number of investigations completed by investigator has more than doubled over 2006-2007. This is also attributable to the efforts spent on the elimination of the backlog.
| Table 2: | Marine Resources* |
| 2006-2007 | 2007-2008 | |||
| FTEs | In thousands of dollars | FTEs | In thousands of dollars | |
| Actual Costs - Marine | 22.9 | 3,130 | 23.0 | 2,775 |
| Internal Professional and Communication Service Costs |
16.1 | 1,840 | 15.3 | 1,774 |
| Corporate Services Costs | 10.3 | 1,343 | 10.5 | 1,393 |
| Contributions to Employee Benefit Plans | 782 | 719 | ||
| Services Received Without Charge | 808 | 744 | ||
| Net Cost of Investigations | 49.3 | 7,904 | 48.8 | 7,405 |
| Indicators | 2006-2007 | 2007-2008 | ||
| Number of Investigators | 20.6 | 20.1 | ||
| Average Net Cost per Investigation Completed | $987,946 | $389,739 | ||
| Investigations Started by Investigator | 0.39 | 0.30 | ||
| Investigations Completed by Investigator | 0.44 | 0.94 | ||
| * Due to rounding, numbers may not sum exactly to totals. | ||||
2.9 Pipeline Sector
2.9.1 Occurrences and Accident Rates
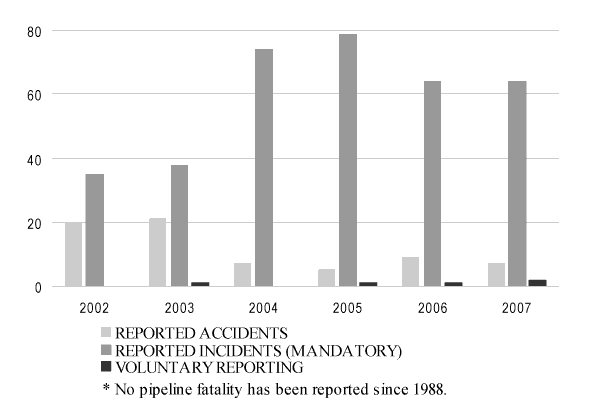
In 2007, 7 pipeline accidents were reported to the TSB, down from the 2006 total of 9 and down from the 2002-2006 average of 12. Estimated pipeline activity was unchanged from the previous year. The last fatal pipeline accident in the portion of the industry under federal jurisdiction occurred in 1988, and the last accident involving serious injury occurred in 2006.
In 2007, 64 pipeline incidents were reported to the TSB in accordance with the mandatory reporting requirements, unchanged from 64 in 2006 and up from the five-year average of 58. In all, 84 per cent of those incidents involved uncontained or uncontrolled release of small quantities of gas, oil and high-vapour-pressure products.
 |
| Figure 5. | Pipeline Occurrences[D]figure_5 |
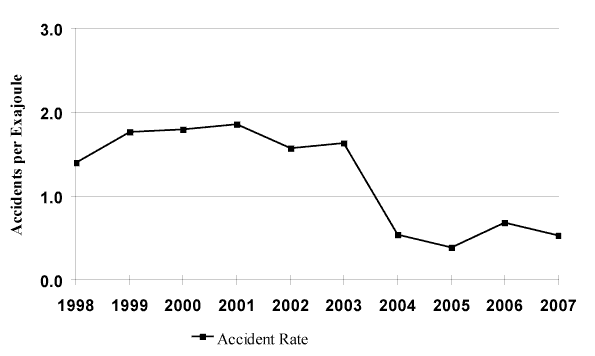
One indicator of pipeline transportation safety in Canada is the pipeline accident rate.3 This rate decreased to 0.5 pipeline accidents per exajoule in 2007, down from 0.7 in 2006 and down from the 2002-2006 average of 1.0.
 |
| Figure 6. | Pipeline Accident Rates[D]figure_6 |
2.9.2 Investigations and Safety Communications
In 2007-2008, two pipeline investigations were started and two investigations were completed. The average duration of completed investigations has increased to 489 days, compared to 407 days in 2006-2007.
| Table 3: | Pipeline Productivity |
| 2003-2004 | 2004-2005 | 2005-2006 | 2006-2007 | 2007-2008 | |
| Investigations Started | 0 | 0 | 2 | 1 | 2 |
| Investigations Completed | 0 | 2 | 1 | 1 | 2 |
| Average Duration of Completed Investigations (Number of Days) |
0 | 1,081 | 922 | 407 | 489 |
| Recommendations | 0 | 0 | 0 | 0 | 0 |
| Safety Advisories | 0 | 0 | 0 | 0 | 0 |
| Safety Information Letters | 0 | 0 | 0 | 1 | 0 |
2.9.3 Safety Actions Taken
No pipeline safety recommendations were issued in 2007-2008.
2.9.4 Link to Resources Utilized
Table 4 provides a picture of the net cost to Canadians of pipeline investigations. The net cost of pipeline investigations increased slightly compared to 2006-2007. Two investigations were started and two were completed during the year.
| Table 4: | Pipeline Resources* |
| 2006-2007 | 2007-2008 | |||
| FTEs | In thousands of dollars | FTEs | In thousands of dollars | |
| Actual Costs - Pipeline | 2.0 | 216 | 2.0 | 225 |
| Internal Professional and Communication Service Costs |
1.4 | 127 | 1.3 | 144 |
| Corporate Services Costs | 0.9 | 93 | 0.9 | 113 |
| Contributions to Employee Benefit Plans | 54 | 58 | ||
| Services Received Without Charge | 56 | 60 | ||
| Net Cost of Investigations | 4.3 | 546 | 4.1 | 600 |
| Indicators | 2006-2007 | 2007-2008 | ||
| Number of Investigators | 2.0 | 1.95 | ||
| Average Net Cost per Investigation Completed | $545,422 | $300,204 | ||
| Investigations Started by Investigator | 0.5 | 1.03 | ||
| Investigations Completed by Investigator | 0.5 | 1.03 | ||
| * Due to rounding, numbers may not sum exactly to totals. | ||||
2.10 Rail Sector
2.10.1 Occurrences and Accident Rates
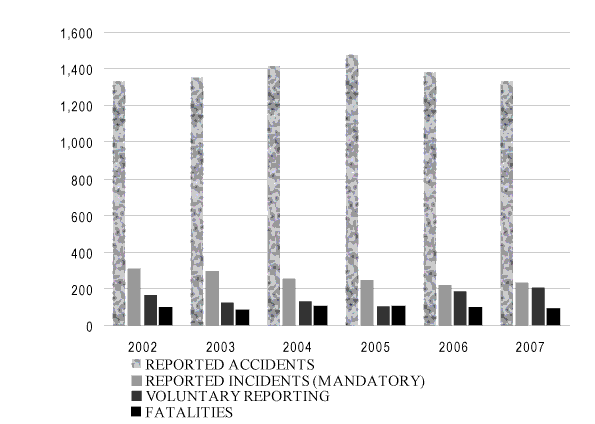
A total of 1,331 rail accidents were reported to the TSB in 2007, a 3 per cent decrease from the 2006 total of 1,378 and a 4 per cent decrease from the 2002-2006 average of 1,391. Estimated rail activity decreased by 3 per cent from 2006, but is comparable to the five-year average. The accident rate decreased to 14.3 accidents per million train-miles in 2007, compared to 14.4 in 2006 and the five-year rate of 15.2. Rail-related fatalities totalled 86 in 2007, compared to the 2006 total and five-year average of 95.
Eight main-track collisions occurred in 2007, compared to three in 2006 and the five-year average of six. In 2007, there were 161 main-track derailments, an increase of 14 per cent from the 2006 total of 141 and of 3 per cent from the five-year average of 156. Non-main-track derailments decreased to 639 in 2007 from 704 in 2006 and from the five-year average of 707.
In 2007, crossing accidents decreased to 218 from the 2006 total of 248 and from the five-year average of 254. Crossing-related fatalities numbered 27, down from 28 in 2006 and from the five-year average of 33. Trespasser accidents increased by 8 per cent to 99 in 2007 from 92 in 2006, and increased by 21 per cent over the five-year average of 82. With a total of 57 fatalities in 2007, trespasser accidents continued to account for the majority of rail fatalities.
In 2007, 192 rail accidents involved dangerous goods (this also includes crossing accidents in which the motor vehicle is carrying a dangerous good), up from 183 in 2006 but down from the five-year average of 210. Five of these accidents resulted in a release of product.
In 2007, rail incidents reported to the TSB in accordance with the mandatory reporting requirements totalled 233, up from 221 in 2006 but down from the five-year average of 265. Movements exceeding limits of authority incidents (113) comprised the largest proportion of the 233 reportable incidents. The second largest proportion was dangerous goods leaker incidents (90).
 |
| Figure 7. | Rail Occurrences and Fatalities[D]figure_7 |
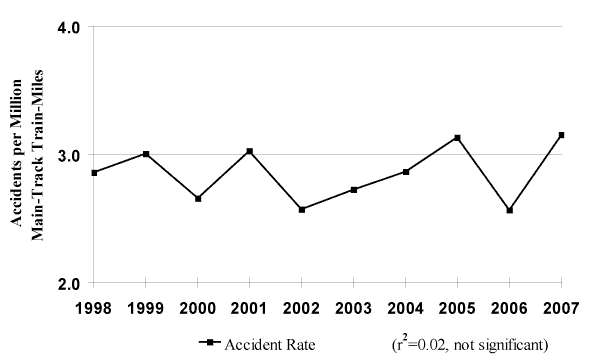
One indicator of rail transportation safety in Canada is the main-track accident rate. This rate increased from 2.6 accidents per million main-track train-miles in 2006 to 3.2 in 2007.4 No significant statistical trend was found over a 10-year period.
 |
| Figure 8. | Main-Track Accident Rates[D]figure_8 |
2.10.2 Investigations and Safety Communications
A total of 11 rail investigations were started in 2007-2008 and 14 investigations were completed. The average duration of completed investigations increased to 697 days compared to 598 days the year before. This increase is attributable to concentrated efforts to complete older investigations.
| Table 5: | Rail Productivity |
| 2003-2004 | 2004-2005 | 2005-2006 | 2006-2007 | 2007-2008 | |
| Investigations Started | 14 | 14 | 9 | 18 | 11 |
| Investigations Completed | 15 | 25 | 9 | 12 | 14 |
| Average Duration of Completed Investigations (Number of Days) |
894 | 618 | 519 | 598 | 697 |
| Recommendations | 4 | 3 | 0 | 2 | 4 |
| Safety Advisories | 7 | 6 | 9 | 8 | 16 |
| Safety Information Letters | 11 | 10 | 8 | 2 | 13 |
2.10.3 Safety Actions Taken
Four rail recommendations were issued in 2007-2008. To obtain additional information regarding these recommendations, the responses received to some of them as well as all the other safety actions taken by the change agents, consult Section 2.5.3 of the TSB Annual Report to Parliament 2007-2008. The Board's assessment of responses to recommendations issued in 2006-2007 in the rail sector can also be found in this section.
The Rail Branch also reassessed responses to 120 recommendations issued since 1991. With Board approval, 4 recommendations went from active to inactive status and 21 recommendations remained active. The Board's reassessments were communicated to the appropriate change agent(s) for information and action.
2.10.4 Link to Resources Utilized
Table 6 provides a picture of the net cost to Canadians of rail investigations. The net cost of rail investigations remained more or less the same compared to the previous year. The average net cost per investigation completed decreased by 15.9 per cent compared to the previous year. The number of investigations started by investigator diminished by 38.9 per cent and the number of investigations completed by investigator increased by 15.6 per cent. These differences can be attributed to the fact that most of the investigations completed were started in previous fiscal years and to the reduced number of new investigations that were started.
| Table 6: | Rail Resources* |
| 2006-2007 | 2007-2008 | |||
| FTEs | In thousands of dollars | FTEs | In thousands of dollars | |
| Actual Costs - Rail | 22.1 | 2,834 | 21.3 | 2,630 |
| Internal Professional and Communication Service Costs |
15.5 | 1,666 | 14.2 | 1,681 |
| Corporate Services Costs | 13.0 | 1,216 | 9.7 | 1,320 |
| Contributions to Employee Benefit Plans | 708 | 682 | ||
| Services Received Without Charge | 732 | 705 | ||
| Net Cost of Investigations | 50.6 | 7,156 | 45.2 | 7,018 |
| Indicators | 2006-2007 | 2007-2008 | ||
| Number of Investigators | 18.95 | 18.92 | ||
| Average Net Cost per Investigation Completed | $596,345 | $501,293 | ||
| Investigations Started by Investigator | 0.95 | 0.58 | ||
| Investigations Completed by Investigator | 0.64 | 0.74 | ||
| * Due to rounding, numbers may not sum exactly to totals. | ||||
2.11 Air Sector
2.11.1 Occurrences and Accident Rates
Canadian-registered aircraft, other than ultralights, were involved in 284 reported accidents in 2007, an 8 per cent increase from the 2006 total of 262 and a 6 per cent increase from the 2002-2006 average of 268. The estimate of flying activity for 2007 is 4,373,000 hours, yielding an accident rate of 6.5 accidents per 100,000 flying hours, up from the 2006 rate of 6.3 but down from the five-year rate of 6.7. Canadian-registered aircraft, other than ultralights, were involved in 33 fatal occurrences with 49 fatalities in 2007, comparable to the 31 fatal occurrences with 52 fatalities in 2006 and the five-year average of 30 fatal occurrences with 50 fatalities. A total of 12 fatal occurrences involved commercial aircraft (7 aeroplanes and 5 helicopters), and 14 of the remaining 21 fatal occurrences involved privately operated aeroplanes.
The number of accidents involving ultralights increased to 30 in 2007 from 28 in 2006, and the number of fatal accidents increased to 5 in 2007 from 1 in 2006.
The number of foreign-registered aircraft accidents in Canada decreased to 10 in 2007 from 14 in 2006. There were no fatal accidents in 2007, down from 2 in 2006.
In 2007, a total of 874 incidents were reported to the TSB in accordance with the mandatory reporting requirements. This represents a 6 per cent increase from the 2006 total of 825 and a 3 per cent increase from the 2002-2006 average of 851.
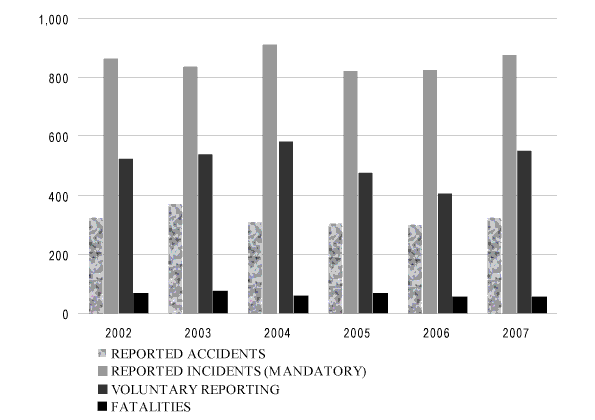 |
| Figure 9. | Air Occurrences and Fatalities[D]figure_9 |
One indicator of air transportation safety in Canada is the accident rate for Canadian-registered aircraft. In 2007, this rate increased to 6.5 accidents per 100,000 hours from the 2006 rate of 6.3, but remained below the five-year average of 6.7. The trend line shows a significant downward trend over the past 10 years.
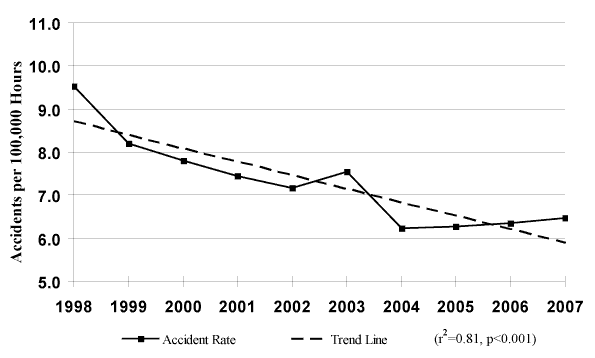 |
| Figure 10. | Canadian-Registered Aircraft Accident Rates[D]figure_10 |
2.11.2 Investigations and Safety Communications
A total of 49 air investigations were started in 2007-2008 and 47 investigations were completed. This represents an increase in the number of investigations completed compared to the previous year (36). The average duration of completed investigations has decreased to 493 days, compared to 516 days the year before.
| Table 7: | Air Productivity |
| 2003-2004 | 2004-2005 | 2005-2006 | 2006-2007 | 2007-2008 | |
| Investigations Started | 47 | 44 | 50 | 41 | 49 |
| Investigations Completed | 40 | 67 | 53 | 36 | 47 |
| Average Duration of Completed Investigations (Number of Days) |
485 | 524 | 404 | 516 | 493 |
| Recommendations | 0 | 4 | 6 | 4 | 11 |
| Safety Advisories | 9 | 9 | 7 | 16 | 13 |
| Safety Information Letters | 8 | 6 | 5 | 12 | 9 |
2.11.3 Safety Actions Taken
To obtain additional information regarding the 11 air safety recommendations issued in 2007-2008 as well as all the other safety actions taken by the change agents, consult Section 2.6.3 of the TSB Annual Report to Parliament 2007-2008. The Board's assessment of responses to recommendations issued in 2006-2007 in the air sector can also be found in this section.
The Air Branch also reassessed responses to 39 recommendations issued in previous years. With Board approval, 5 recommendations went from active to inactive status. At the end of fiscal year 2007-2008, there were 43 active recommendations. The Board's reassessments were communicated to the appropriate change agent(s) for information and action.
2.11.4 Link to Resources Utilized
Table 8 provides a picture of the net cost to Canadians of air investigations. Compared to the previous year, the net cost of investigations increased slightly. However, the average net cost per investigation completed decreased by 23.3 per cent because most of the investigations completed were started in the previous fiscal years. The number of investigations started and completed per investigator increased respectively by 26.3 per cent and 35.8 per cent.
| Table 8: | Air Resources* |
| 2006-2007 | 2007-2008 | |||
| FTEs | In thousands of dollars | FTEs | In thousands of dollars | |
| Actual Costs - Rail | 58.1 | 7,444 | 55.8 | 7,051 |
| Internal Professional and Communication Service Costs |
40.8 | 4,377 | 37.2 | 4,507 |
| Corporate Services Costs | 26.1 | 3,194 | 25.4 | 3,540 |
| Contributions to Employee Benefit Plans | 1,859 | 1,828 | ||
| Services Received Without Charge | 1,922 | 1,890 | ||
| Net Cost of Investigations | 125.1 | 18,797 | 118.3 | 18,815 |
| Indicators | 2006-2007 | 2007-2008 | ||
| Number of Investigators | 54.03 | 51.75 | ||
| Average Net Cost per Investigation Completed | $522,135 | $400,329 | ||
| Investigations Started by Investigator | 0.76 | 0.95 | ||
| Investigations Completed by Investigator | 0.67 | 0.91 | ||
| * Due to rounding, numbers may not sum exactly to totals. | ||||
