Common menu bar links
Breadcrumb Trail
ARCHIVED - National Energy Board
 This page has been archived.
Archived Content
Information identified as archived on the Web is for reference, research or recordkeeping purposes. It has not been altered or updated after the date of archiving. Web pages that are archived on the Web are not subject to the Government of Canada Web Standards. As per the Communications Policy of the Government of Canada, you can request alternate formats on the "Contact Us" page.
Section II: Analysis of Program Activity
2.1 Strategic Outcome
| Safety, security, environmental protection and economic benefits through regulation of pipelines, power lines, trade and energy development within NEB jurisdiction. |
2.2 Program Activity: Energy Regulation and Advice
The NEB’s main business is energy regulation and the provision of energy market information. The companies that are regulated by the Board create wealth for Canadians through the transport of oil, natural gas and natural gas liquids and through the export of hydrocarbons and electricity. As a regulatory agency, the Board’s role is to help create a framework that allows these economic activities to occur when they are in the public interest.
Financial Resources: ($ millions)
| Planned Spending | Total Authorities | Actual Spending |
| 38.1 | 47.3 | 43.8 |
Human Resources (full-time equivalents):
| Planned | Actual | Difference |
| 307.6 | 293.09 | -14.51 |
2.3 Analysis by Program Activity
In support of its strategic outcome, the NEB has developed five strategic goals. In this section, the outcomes and performance results from planned actions, as described in the 2007-2008 Report on Plans and Priorities (RPP), are discussed.
2.3.1 Goal 1
| NEB-regulated facilities and activities are safe and secure, and are perceived to be so. |
The NEB ensures that NEB-regulated facilities are operated and that exploration and production activities under the COGO Act are conducted in a manner that protects employee, contractor, and public safety. Since 2005, the NEB’s mandate has included regulatory oversight of the security of pipelines and international power lines. The NEB’s commitment to safety and security encompasses the full lifecycle of energy projects within its jurisdiction.
The safety and security of facilities and activities regulated by the NEB are managed through competent design, construction, operation and maintenance practices. The NEB plays a significant role in safety and security by ensuring an appropriate regulatory framework is in place which encourages companies to maintain or improve their safety and security performance. This framework provides the NEB and companies with the tools, activities and methodologies necessary for adequate, effective and fully implemented safety and security management programs. The NEB’s role includes:
- developing and maintaining goal oriented regulations and guidelines;
- assessing facility and exploration/production applications from an engineering and safety perspective;
- ensuring that appropriate mitigation measures and approval conditions are in place before granting project approval;
- reviewing construction progress reports, inspecting facilities, conducting compliance meetings, and auditing management systems to confirm regulatory requirements are met and continue to be met;
- assessing safety practices and procedures under the NEB mandate as well as through the Canada Labour Code (CLC) through a Memorandum of Understanding (MOU) between Human Resources and Social Development Canada (HRSDC) and the Board;
- investigating incidents with the intent of preventing future similar occurrences;
- taking the lead response role on emergencies to monitor and contribute to the effectiveness of company and other agency responses;
- issuing safety advisories; and
- conducting inquiries or formal investigations into safety and security issues.
Performance Measures and Results
For Goal 1, the NEB has four key performance measures to ensure that NEB-regulated facilities are safe and secure. They are:
- Number of fatalities per year.
- Number of pipeline ruptures and incidents per year.
- Public perception of pipeline safety.
- Number and significance of security infractions.
In addition, in 2007-2008, the NEB developed and tracked three new measures related to safety, integrity and compliance. The first two are frequency measures for: 1) worker disabling injuries (safety), and 2) pipe body failures (integrity). The third additional measure shows progress on the NEB’s compliance verification plan by tracking the percentage of risk-based planned activities completed.
Number of fatalities per year
In 2007-2008, one fatality occurred on 24 March 2008. An employee of Enbridge Pipelines Inc. was electrocuted while performing electrical isolation work at a pump station in Kerrobert, Saskatchewan. The employee was 54 years old and had been employed by Enbridge for 21 years. This tragic event is currently under investigation under the NEB’s mandate as well as on behalf of HRSDC under our MOU with them for the application and enforcement of the provisions of the Canada Labour Code.
Number of pipeline ruptures and incidents per year
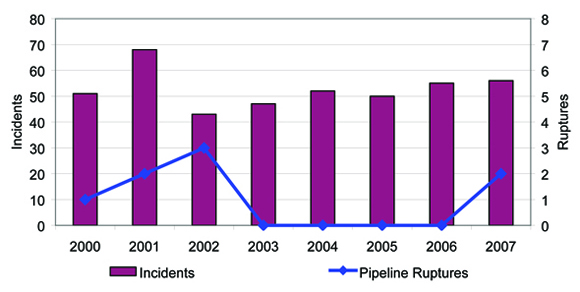
In calendar year 2007, 56 incidents were reported under the NEB Act pursuant to section 52 of the Onshore Pipeline Regulations, 1999 (OPR-99) and section 46 of the Processing Plant Regulations. The number of incidents remained within the same range as the previous years. From 2003 to 2006, there were no NEB-regulated hydrocarbon pipeline ruptures however two occurred in 2007. Figure 1 shows incidents and ruptures by calendar year.
Figure 1: Pipeline Ruptures and Incidents, 2001-2007
In 2007, three incidents resulted in on-site investigation by NEB staff members:
- On 15 April 2007, a pipeline rupture near Glenavon, Saskatchewan resulted in the release of approximately 990 cubic metres (6 230 barrels) of oil. The NEB has since conducted three separate inspections of the incident site and has confirmed that all contaminated soil has been removed. Remediation activities were complete as of the end of October 2007. The Transportation Safety Board (TSB) is the lead investigator of this incident and the NEB continues to collaborate with them on this investigation.
- On 24 July 2007, a pipeline within the City of Burnaby, British Columbia, was struck by a backhoe releasing approximately 232 cubic metres (1 460 barrels) of crude oil in a densely populated area. A significant portion of the released fluids ultimately were recovered from Burrard Inlet. The TSB is leading the incident investigation to determine the cause and contributing factors.
- On 22 October 2007, during a pipeline construction project in Jasper National Park, a contractor employee was struck by a side boom and suffered a compound fracture of his right leg which was eventually amputated above the knee. Alberta Workplace Health and Safety is leading the investigation because the injury was sustained by a contractor employee.
In 2007-2008, with respect to COGOA activities, total hazardous occurrences as defined under section 16.4 of the Oil and Gas Occupational Safety and Health Regulations under the CLC Part II, decreased from 28 in 2006-2007 to 24 in 2007-2008 (Table 2). There was one disabling injury involving the emergency evacuation of an employee from the work site for treatment of chest pains. Although in 2006-2007 there were zero disabling injuries, the one in 2007-2008 represents a decrease from the five year average of three disabling injuries per year. For activities covered under the COGO Act and the CLC, no fatalities occurred during the 2007-2008 fiscal year.
Table 2: Safety Performance Indicators for Companies Regulated under COGO Act
| Indicators | 2006-2007 | 2007-2008 |
|
COGO Act Worker disabling injury rate (Lost Time Injury/106 hours worked) |
0 | 1 |
| COGO Act Hazardous Occurrences | 28 | 24 |
| Fatalities | 0 | 0 |
Public perception of pipeline safety
One of the key findings of the NEB’s March 2007 Focus on Safety and the Environment 2000-2005 report was that the low number of ruptures in recent years is primarily attributed to the introduction of Integrity Management Programs (IMPs) within the pipeline industry. The NEB was the first regulator in North America to mandate that pipeline companies must have IMPs, with the promulgation of the OPR-99. The OPR-99 reflects the Board's goal oriented approach to regulation by directing companies to have IMPs and by allowing them the freedom to tailor the content of the IMPs to their particular circumstances.
Number and significance of security infractions
Regulated companies voluntarily report security related events to the NEB. NEB regulated facilities did not report any major security infractions in 2007-2008.
A number of initiatives have been undertaken to further the NEB security program. We continue to refine and test our suite of assessment tools for conducting security inspections. We also continue to encourage cooperation and partnerships with other agencies across Canada.
The following milestones have been achieved for security activities during 2007-2008:
- Our suite of security assessment tools was tested out in the field.
- We conducted 14 security related inspections and compliance meetings.
- We engaged related agencies in New Brunswick and Quebec.
- Several NEB staff attended the assessments for development and training purposes.
- An internal committee was formed to encourage development and training for inspection officers regarding security inspections.
Additional Measures
In 2007-2008, the NEB started to track three new measures related to safety, integrity and compliance. They are:
- Worker Disabling Injury Frequencies
- Pipe Body Failure Frequencies
- Planned Risk-based Activities Completed
Figure 2 shows the worker disabling injury frequencies and cumulative frequencies for the years 2000 to 2006. As this is a lagging indicator, the most current data available is for the calendar year 2006. Changes in the slope of the plotted cumulative curve indicate the relative direction of industry performance. More specifically, an increase in the slope represents declining performance and a decrease in the slope indicates improved performance. For the year 2006, the worker disabling injury curve indicates a decline in performance with respect to safety.
Figure 3 shows the pipe body failure frequencies and cumulative frequencies for the years 2000 to 2007. Pipe body failures represent a failure of a company’s integrity management program in that mitigative action was not taken prior to the uncontrolled release of product from a failure compromising the wall of the pipeline. An increase in the slope represents declining performance (i.e. an increase in the frequency of pipe body releases normalized over time and system length) and a decrease in the slope indicates improved performance. For the year 2007, the pipe body failure curve indicates a decline in performance with respect to integrity management.
The NEB measures its internal performance by tracking the delivery of compliance verification activities prioritized against a risk model for each fiscal year. In 2007-2008, the NEB completed 85 percent of all planned compliance verification activities. Table 3 shows a breakdown of these activities by discipline. The activities not completed included some that were no longer relevant and others which were postponed to fiscal year 2008-2009 as resource capacity was challenged. In total, 179 activities were completed. This reflects the large number of additional work required that was not anticipated at the start of the fiscal year. Despite an extremely heavy workload, the NEB was able to complete most of the risk-based planned activities this fiscal year. Those which were not completed and which are still valid have been carried forward into the 2008-2009 compliance verification plan.
Figure 2: Worker Disabling Injury, 2000-2006
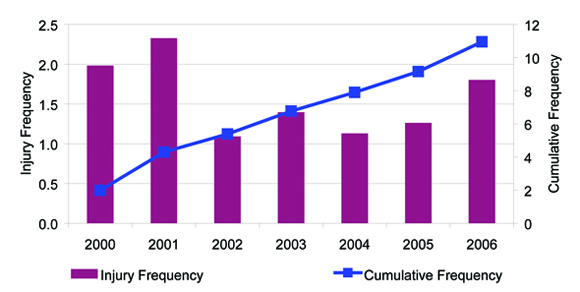
Figure 3: Pipe Body Failure, 2000-2007
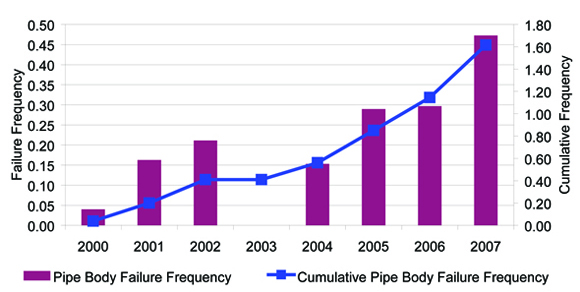
Table 3: Percent of Planned Compliance Activities Completed
| Discipline | Planned | Completed | % Completed |
| Safety | 33 | 26 | 79% |
| Security | 16 | 16 | 100% |
| Environment | 16 | 13 | 81% |
| Integrity | 21 | 17 | 81% |
| Emergency | 33 | 29 | 88% |
| Total | 119 | 101 | 85% |
Program and Results on Objectives of 2007-2008
The NEB identified objectives for Goal 1 and Goal 2 in its 2007-2008 RPP. The objectives for Goal 1, which focus on safety and security, apply to Goal 2, which focuses on the environment. The results achieved for Goals 1 and 2 under these objectives are discussed below.
1. The NEB employs a lifecycle approach to the regulation of energy infrastructure.
The NEB has a mandate to regulate the design, construction, operation and abandonment of hydrocarbon pipelines that cross provincial or international borders. In applying regulatory oversight, the NEB strives to take a “lifecycle approach” by which: 1) no single lifecycle stage of energy infrastructure is considered in isolation from the others, and 2) the NEB addresses project risks using the appropriate regulatory tool at the appropriate stage of the project lifecycle.
The NEB’s risk-based lifecycle approach supports goal oriented regulation and has continued to expand in both scope and diversity across the organization. The risk-based approach is applied to the planning process for the compliance oversight of regulated companies under both the NEB Act and the COGO Act. In 2007-2008, work was completed on holding compliance meetings; developing compliance activity scorecards; and developing compliance verification plan performance reports. In 2007-2008, the program was further developed via various pilot projects, particularly in the NEB’s assessment of section 58 applications and for all public interest areas.
In addition, the NEB developed a draft plan for incorporating socio-economic land and land matters into the risk-based lifecycle approach. A complete roll-out of the draft plan will however depend on availability of required resources. The Land Matters Consultation Initiative (LMCI) is a significant step in the development of the risk-based lifecycle approach and has been incorporated into the program. Further discussion of the success of the LMCI can be found in section 2.3.2.
2. The NEB, in partnership with federal and provincial/territorial agencies, has in place effective environmental assessment processes.
The Board continues to pursue partnerships with key regulatory and government agencies and stakeholders to facilitate efficient application assessments and regulatory oversight during infrastructure lifecycle. In 2007-2008, the NEB documented the NEB’s environmental assessment coordination program and processes used to keep government departments informed about the NEB’s mandate and process requirements and coordinate environmental assessment processes with relevant government departments. The 2007-2008 work plan was scaled back due to a heavy application and hearing workload, but the essentials of the program and process development were completed. The initiative to pursue substitution as a way of business for panel reviews has been postponed pending the outcome of the work the NEB began in 2007-2008 to support the Major Projects Management Office.
3. The NEB promotes sharing of information and best practices from pre-application to abandonment.
Part of the NEB’s regulatory philosophy around goal oriented regulation is to encourage the adoption of best practices for all periods of the facility lifecycle. The NEB’s full lifecycle responsibilities mean that it collects a significant amount of information on the safety and environmental performance of its regulated companies. This lifecycle responsibility also provides the Board with ongoing, practical lessons about safety and environmental best practices which the NEB applies internally.
As part of its core work, the NEB continues to expand its information sharing through public reporting on pipeline integrity, environmental performance indicators, safety and security, and environmental protection and assessment best practices. The NEB also influences the use of new technology by raising awareness through meetings, partnerships, consultation and communication with industry. In 2007-2008, the identification of gaps for sharing best practices regarding security, emergency management, socio-economic and engagement practices of regulated companies was deferred due to workload and staffing requirements. However, the NEB continues to share and promote best practices through the day to day implementation of NEB processes and interaction with companies.
The NEB continues to consult with industry and interested parties to identify opportunities for improvement through participation in bodies such as the Canada Standards Association (CSA). In partnership with the CSA, the NEB has initiated development of a consensus standard on security management for the energy industry. The development of this standard is actively supported by affected stakeholders and work continues to be carried out on an accelerated schedule. Final publication of the standard is expected in 2009.
2.3.2 Goal 2
| NEB-regulated facilities are built and operated in a manner that protects the environment and respects the rights of those affected. |
The NEB is committed to protecting the environment and respecting the rights of those affected. This commitment is fulfilled throughout the lifecycle of the NEB-regulated facilities by:
- sharing information and expectations during pre-application project design and application preparation;
- assessing the environmental and social impacts of proposed projects at the application stage;
- monitoring and inspecting approved projects and verifying condition compliance during construction and operation;
- auditing environmental protection programs;
- investigating spills and releases; and
- ensuring that the abandonment of facilities is carried out appropriately to protect the environment and to address the concerns of affected landowners and residents.
Throughout these phases, the Board ensures that regulated companies engage those people whose interests are potentially affected by their projects and activities.
In addition to accomplishing key objectives for environmental assessment, the NEB made progress in improving on other areas of its risk-based approach to fulfill its Goal 2 responsibilities. The NEB implemented elements of an integrated system for promoting effective, risk-based decision making related to environmental protection and respecting the rights of those affected. The NEB also continued its work on streamlining its approach for dealing with low-risk pipeline applications by developing ways to align application preparation and assessment expectations with the level of risk associated with the proposed facility.
Performance Measures and Results
Similar to previous years, the NEB used the following three measures to gauge its performance in fulfilling its Goal 2 mandate:
- Percent of environmental conditions that achieved their desired end results.
- Number of major releases into the environment per year.
- Indicators that the rights of those affected are respected.
Percent of environmental conditions that achieved their desired end results
Environmental conditions are attached to project approvals to address specific environmental issues associated with a project. Each condition attached to an Order or Certificate issued by the Board has a defined desired end results (DER). Once condition compliance is confirmed, the NEB assesses the effectiveness of the environmental condition by evaluating achievement of the DER. Achievement of the DER is confirmed through NEB inspections and project monitoring. Measuring the DER achievement of environmental conditions aids the Board in determining the need for and opportunities to improve the clarity and effectiveness of the conditions it places on facility approvals.
The environmental conditions are now meeting the DER 100 percent of the time. This trend reflects the investment that the NEB has made to improve the relevance and effectiveness of its regulatory conditions. The results are also indicative of the NEB’s efforts to improve the internal tools and processes that guide the use of conditions in facilities regulation. Since the DER of the conditions is now being achieved consistently, other measures will be developed to replace this one.
Number of major releases into the environment per year
Major releases are defined as unintended or uncontained releases exceeding 100 cubic metres of liquid hydrocarbon. The number of major releases of liquid hydrocarbon to the environment is considered a key indicator of the success of operating facilities regulated by the Board with regard to Goal 2. The desired target is that NEB-regulated facilities operating under approved permits and conditions should have no major releases to air, land or water.
Three major releases by NEB-regulated companies occurred last year. They were:
- Enbridge Glenavon (approximately 990 cubic metres or 6 230 barrels): a result of corrosion;
- Terasen Burnaby (approximately 232 cubic metres or 1 460 barrels): a result of a 3rd party strike; and
- Enbridge Cromer Terminal (approximately 600 to 700 barrels of crude, predominantly contained, on company property): a result of a station valve failure.
The number of major releases is up from those encountered in 2006 and within the range of between zero and three occurring annually over the past several years (Table 4).
Table 4: Major Releases to the Environment During Operation
| Year | No. of Major Releases |
| 2006 | 1 |
| 2005 | 2 |
| 2004 | 0 |
| 2003 | 0 |
| 2002 | 1 |
| 2001 | 1 |
| 2000 | 0 |
| 1999 | 3 |
| 1998 | 0 |
Indicators that the rights of those affected are respected
The NEB continues to advance its Goal 2 mandate to respect the rights of those affected, by monitoring responses to landowner complaints and also by developing the Proposed Damage Prevention Regulations. In 2007 the NEB responded to 18 cases in which landowners brought forward issues regarding the effects of NEB-approved facilities on the use and enjoyment of their properties. Eighty-eight percent of these complaints were resolved within the NEB’s service standard (80 percent in 60 days). During 2007, work on the Proposed Damage Prevention Regulations was advanced.
The NEB recently launched its Land Matters Consultation Initiative (LMCI). The purpose of this initiative is to provide a forum for interested parties, primarily landowners, and the Board to discuss and generate options for the Board's review of lands issues. These discussions are expected to improve understanding of various interests, and will also help to develop stronger working relationships among the different parties. Over 400 people have participated in the LMCI consultations across Canada. The LMCI discussions are looking at the range of existing tools (such as regulations, guidance notes, regulatory filing expectations, inspections and audits) to identify possible improvements in the future. Discussion is separated into four streams:
- Company Interaction with Landowners;
- Improving the Accessability of NEB Processess;
- Pipeline Abandonment – Financial Issues; and
- Pipeline Abandonment – Physical Issues.
Then next major step for the LMCI is to prepare a report with recommendations which will address the issues that have been identified.
Program and Results on Objectives of 2007-2008
The objectives for Goal 1, which focuses on safety and security, apply to Goal 2, which focuses on environment. The results achieved toward Goal 2 under these objectives are discussed under Goal 1.
2.3.3 Goal 3
| Canadians benefit from efficient infrastructure and markets. |
The NEB promotes efficient energy infrastructure and markets through the regulation of pipeline and electrical transmission facilities, pipeline tolls and tariffs, and energy imports and exports. The NEB also provides energy information to Canadians and works to continually improve the efficiency of its regulatory processes.
The NEB is responsible for approving natural gas, natural gas liquids, crude oil, petroleum products, and electricity exports. The basis of the NEB’s approach for the authorization of exports is to ensure that Canadians have access to Canadian-produced commodities on terms and conditions at least as favourable as those available to export buyers. To achieve this outcome, the NEB undertakes extensive monitoring and reporting of market conditions. The NEB promotes functional markets and monitors these markets to verify they are responding to market signals consistent with the fundamentals of supply and demand. Additionally, the NEB monitors transportation markets for the utilization and adequacy of pipeline capacity. The NEB also informs the public about energy market trends on an ongoing basis. Providing and interpreting energy market information contributes to the efficient operation of energy markets.
Finally, in the context of the NEB’s operations, efficient energy infrastructure and markets embodies regulatory efficiency. This includes reducing regulatory barriers, streamlining regulatory processes and effectively coordinating these processes with other agencies, when appropriate, and striving to minimize costs incurred by parties.
Performance Measures and Results
To gauge results under Goal 3, the NEB used three performance measures:
- Evidence that Canadian energy and transportation markets are working well.
- Evidence that the Board’s advice and energy information products benefit Canadians.
- Evidence that the Board’s regulatory processes are efficient and effective.
Evidence that Canadian energy and transportation markets are working well
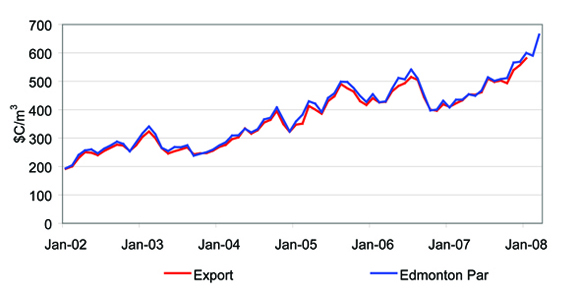
A key indicator that energy and transportation markets are working well is that Canadians can obtain energy commodities on similar terms and conditions that are available to export buyers. In the context of the North American market, this means that the prices paid for oil, gas and electricity in the domestic market should be responsive to demand and supply pressures and, in an integrated market, essentially the same as the prices in the export market. Price trends over the past several years indicate that domestic and export prices have been tracking closely (Figures 5 to 8).
Figure 4 illustrates net export revenues by commodity. For 2007, data reflects revenues have remained consistent or increased year over year.
Figures 5 and 6 illustrate that the natural gas and crude oil markets continue to work.
Figure 5 demonstrates that prices generally reflect overall supply and demand of natural gas in North America. Canadians are paying fair market prices for natural gas. Above-normal temperatures in the winter of 2006-2007 left large volumes of natural gas in North American gas storage facilities at the beginning of April. Gas prices weakened through the spring and summer as increased volumes of liquefied natural gas (LNG) were imported into the United States. By September, LNG imports receded by about half of the summer rate, as European and Asian LNG pre-winter demand increased. Consequently, natural gas prices increased from the late-September low.
Figure 4: Estimated Net Export Revenues by Commodity
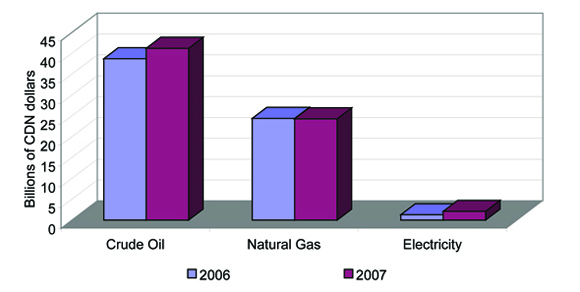
Figure 5: Comparison of Export and Domestic Natural Gas Prices
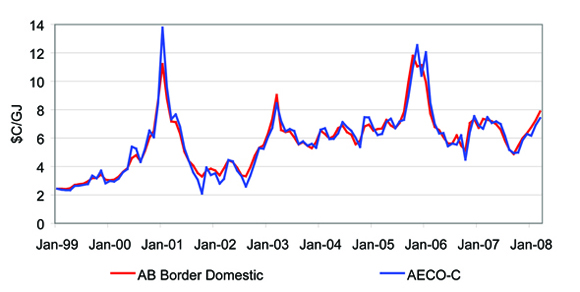
Figure 6 illustrates that the light crude oil market continues to work. Canadians are paying competitive market prices for both light and heavy crude oil. Canadian prices started the fiscal year at CDN$435.84/m3 (CDN$69.20/bbl) and rose dramatically, closing at CDN$664.53/m3 (CDN$105.50/bbl) on 31 March 2008. This represents a year-on-year increase of almost 53 percent. Supporting the price increase was a sharp decline in U.S. crude oil inventories which approached the lower boundary of the five year range as 2007 ended.
Figure 6: Comparison of Export and Domestic Oil Prices
In 2007, Canadian refinery utilization rates rose 1.6 percent as a result of increasing demand for petroleum products. Distillate fuels (heating oil and diesel) had adequate supply during the winter, with the exception of western Canada, where a fire at the Shell Scotford upgrader in November contributed to product supply tightness. Product prices were roughly 4.2 percent higher in 2007 compared to 2006 reflecting the increase in crude oil prices. The full impact of higher crude oil prices was offset by the appreciation of the Canadian dollar versus the U.S. dollar.
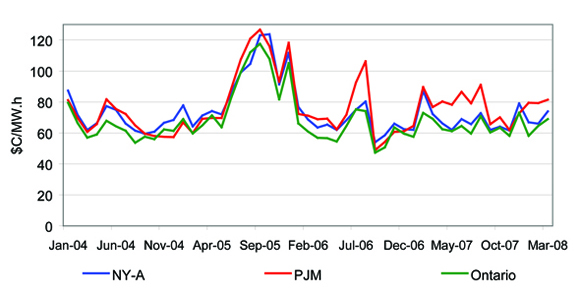
In Canada, only Ontario and Alberta have functioning electricity markets where price is determined by the forces of supply and demand. Figure 7 and Figure 8 illustrate prices in interconnected electricity markets. Where interconnected markets have adequate generation and are connected by efficient and effective transmission systems, price changes in one market should reflect price changes in the other. If transmission constraints exist between the interconnected markets, there will be less of a tendency for prices to be correlated.
For example, Ontario wholesale electricity prices are correlated with adjacent U.S. markets. Figure 7 shows Pennsylvania–Jersey–Maryland (PJM) Interconnections and New York–West (NY-A) pricing points.
Despite typically being a summer peaking province, Ontario’s monthly average peak power prices were highest in February and December in 2007. The summer price peak occurred in August last year, with power prices in PJM averaging $20/MW.h more than in Ontario for that month. The divergence of the prices in PJM over the summer is due to congestion on transmission lines within that region. Domestic load in Ontario was slightly down from summer 2006, due to mild summer weather and languishing industrial demand.
Figure 7: On-Peak Electricity Prices in Ontario and Adjacent American Markets
As shown in Figure 8, the Alberta Electric System Operator (AESO) on-peak power price and the Mid-Columbia (Mid-C) price in Washington State represent western pricing points. Correlation between the two prices is evident but is not as close as in eastern Canada. Transmission constraints continue to limit the volume of energy that can be traded between the regions.
Figure 8: On-Peak Electricity Prices - Alberta and Mid-Columbia
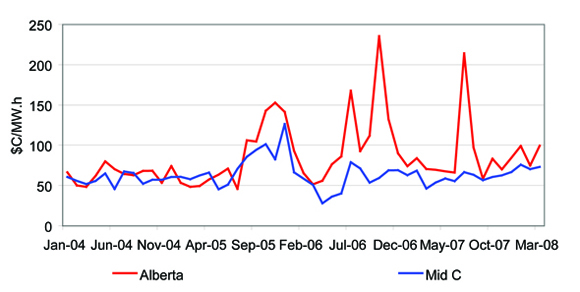
An extended period of warm weather that resulted in five power warnings throughout July 2007 forced prices to reach the $999/MW.h maximum resulting in an average monthly pool price of C$214/MW.h. The large divergences between these regional prices, over the past few summers, have been due to exceptional situations, where Alberta had a combination of low generation and transmission outages. The prices in the two regions have followed a similar path since September 2007.
Figure 9 illustrates that electricity prices paid by consumers vary significantly across the country. The lowest prices are in the hydro provinces, which have the lowest-cost electricity, and are less subject to the rise in fuel costs than those areas which rely on fossil fuels for electricity generation.
For the natural gas and oil pipeline transportation systems to work well, the following three factors must be present: 1) there is adequate pipeline capacity in place to move products to consumers who need them; 2) pipelines are providing services that meet the needs of shippers at reasonable prices; and, 3) pipelines have adequate financial strength to attract capital on terms that allow them to build infrastructure and maintain their systems at a reasonable cost to customers.
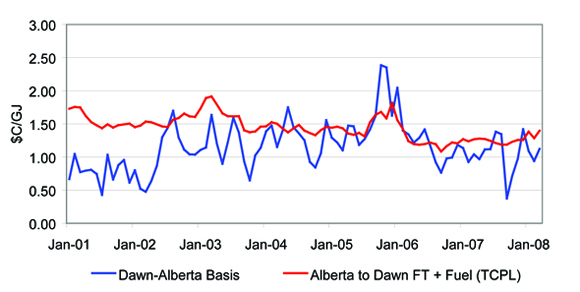
With respect to the adequacy of pipeline capacity, one measurement is based on the principle that if adequate capacity exists, the difference in commodity price between two markets connected by a pipeline should be similar or less than the cost of transportation. Prolonged periods of a higher price differential could indicate the need for additional capacity on a pipeline.
Figure 9: Residential Electricity Prices in Representative Canadian Cities
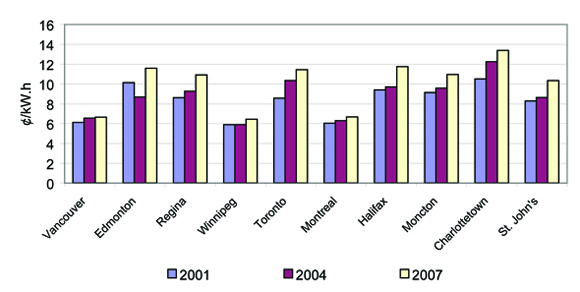
(Source: Hydro-Quebec. Comparison of Electricity Prices in Major North American Cities. 2007)
As Figure 10 shows, the historical gas price difference between Dawn, Ontario and Alberta has generally been less than the cost of transportation (firm transport plus fuel) via the TransCanada pipeline, which connects these two markets. The data provides an indication that in general, there has been sufficient pipeline capacity between Alberta and Ontario. Using similar analysis, the NEB concludes that adequate capacity existed on all major gas pipeline corridors over the last year.
Figure 10: Alberta Basis versus Transportation and Fuel Cost
The NEB also directly monitors pipeline throughput relative to capacity to gauge whether an adequate level of transportation is available. This analysis also indicates that natural gas pipeline capacity was adequate but showed some constraints on oil pipeline capacity in 2007-2008. Oil pipeline capacity utilization is illustrated in Figure 11.
Figure 11: Oil Pipeline Capacity Utilization
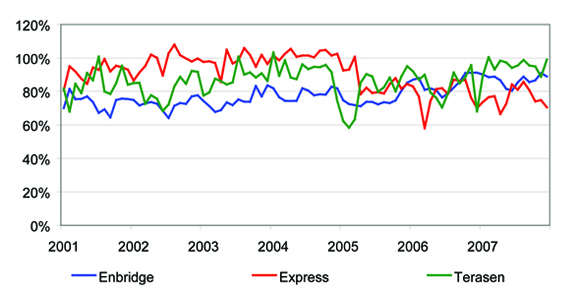
Kinder Morgan’s Trans Mountain Pipeline system was apportioned throughout the year as a result of strong demand from U.S. northwest refineries and increased shipments off the Westridge dock. Heavy crude oil producers sought to ship crude off the west coast to realize higher netbacks as the more accessible U.S. Midwest market became saturated. Capacity was sufficient on Kinder Morgan’s Express pipeline, but, due to downstream capacity tightness on the Platte system, Canadian producers were limited in terms of how much they could ship from Hardisty, Alberta. Certain lines on the Enbridge system operated at or close to full capacity and, at times, were unable to flow all volumes offered.
While oil pipeline capacity utilization in 2007-2008 indicated that there was some spare capacity on the pipelines, downstream bottlenecks on both Express and Enbridge limited the amount of crude that could be shipped. As Canadian oil production increased, driven by oil sands development, capacity on Canadian oil pipelines remained very tight, indicating additional capacity may be required.
In 2007-2008, the NEB approved TransCanada’s Keystone pipeline (69 000 m3), Enbridge’s Alberta Clipper pipeline (71 500 m3), Enbridge’s Westpur ACCE capacity expansion, and Enbridge’s Southern Lights project which involves transporting diluent from the U.S. to the Alberta oil sands.
Evidence that advice and information products benefit Canadians
The NEB provides information products about energy market trends so that the public has information to make decisions about choices for energy sources for the future, and so that policy makers have access to independent, timely and objective energy information to make informed decisions. The energy market information is provided through Energy Market Assessments, statistical reporting and consultation with other organizations. All of this material is available through the NEB website. In 2007-2008, the number of web visits to the NEB Internet site continued to increase. The Energy Pricing for Canadian Consumers section of the website continues to be popular, maintaining the number of web visits as the previous year. The report on Canada’s Energy Future and accompanying background material on the website received the most web visits of our energy products, indicating greater use of NEB-source energy information.
Evidence that the NEB’s regulatory processes are efficient and effective
The NEB continues to monitor the efficiency and effectiveness of its regulatory processes. Service standards have been published and posted on the NEB’s website since 2005. The NEB compiles data on cycle times (the time between receiving an application and rendering an NEB decision) to track the number, type and processing time of applications it receives. This provides evidence that the NEB’s regulatory processes are efficient and effective and helps pinpoint areas requiring attention. The NEB has established service standards for these cycle times. Table 5 shows the service standards for the various types of applications and permits and the performance relative to the service standard for the 2007-2008 year.
Table 5: Cycle Times and Service Standards
| Type and Number | Processing Time | ||
| Non-Hearing Section 58 Applications* | Standard | Result | Average |
| Category A: 12 | 80% in 40 days | 92% | 33.0 |
| Category B: 3 | 80% in 90 days | 100% | 58.0 |
| Category C: 0 | 80% in 120 days | (n/a) | (n/a) |
| Reasons for Decision** | Standard | Result | Average |
| 80% of Reasons for Decision completed within 12 weeks following a public hearing: 5 | 80% in 12 weeks | 80% | (n/a) |
|
Electricity Export Authorizations*** |
Standard | Result | Average |
| Category A : 7 | 80% within 40 calendar days | 100% | 35.0 |
| Category B : 3 | 80% within 90 calendar days | 100% | 72.0 |
|
Export and Import Authorizations**** |
Standard | Result | Average |
| NGL Orders: 6 | 2 working days | 67% | 2.3 |
| Oil Orders: 13 | 2 working days | 62% | 2.2 |
| Natural Gas Orders: 149 | 2 working days | 99% | 2.0 |
| * Section 58 applications are classified into one of three categories (minor, moderate, major) based on: their level of complexity; the estimated number and type of information requests which may be generated; the probability of third-party interest; and the level to which a Federal Authority may become involved in the environmental assessment of the application. | |||
| ** There were two Reasons for Decision involving the issuance of a separate Environmental Assessment Report requiring a Government Response or decision from the Minister of the Environment issued in 2007-2008. A new service standard regarding such Reasons for Decision has been developed for 2008-2009. | |||
| *** Electricity export applications are divided into one of two categories (minor or major) based on their level of complexity. | |||
| **** Service standards for Oil and NGL orders apply to new orders only (not renewals). | |||
In 2007-2008, the NEB processed 351 short-term applications, including 58 propane, 49 butane, 95 crude oil/petroleum product export orders and 149 natural gas import and export orders. All export orders met the NEB’s service standard of two working days with the exception of two new NGL and five new oil and/or petroleum product orders. In these situations, staff turnover and processing delays were contributing factors. Orders that did not meet the two day service standard were processed within three days.
Program and Results on Objectives of 2007-2008
The NEB identified three objectives under Goal 3 in its 2007-2008 RPP. These objectives and the results achieved are discussed below.
1. Regulatory processes fit the scope and risk of applications and other regulated activities.
This year, the NEB improved the application process for small pipelines by developing criteria enabling companies to submit streamlined applications; consequently, these applications can be assessed by the Board more efficiently and improve Board cycle times. Using a simplified assessment process for low-risk facility applications reduces the time required for regulatory decisions on small, routine pipeline facilities, reduces industry’s application costs related to small pipelines, and reduces industry avoidance of federal regulation for small pipelines.
|
Technically uncomplicated, straightforward application + Satisfactory company compliance record + Lifecycle compliance tools available for any required project or company follow-up = Streamlined Application Assessment |
A satisfactory company compliance record is verified using inspection reports, audit reports and condition compliance. Regulated companies will use the Board’s risk criteria to evaluate the risks of their proposed project, confirming the level of risk for each criterion and providing additional information to the Board only in the event that there is more than a low level of risk for that particular criterion. In 2007-2008, the NEB developed an Online Application System (OAS), for regulated companies to submit small pipeline applications.
A similar approach has been initiated in the processing of electricity export applications in order to more appropriately fit the scope and risk of such applications. In 2007-2008, the Board conducted successful stakeholder consultations regarding the streamlining initiative for electricity export applications. Interim outcomes include reduced information requirements in electricity export applications, reduced Board cycle times and improved internal process documentation, approach and practices.
2. The NEB’s energy information program focuses on emerging market issues and regulatory challenges.
Part of the Board’s energy information program, the report on Canada’s Energy Future, is a study of Canada’s long-term energy supply and demand. In the report, released in the fall of 2007, the Board integrated the analysis of energy sector markets into a single “all energy” market analysis and outlook. The report describes plausible energy futures for Canada with a view to inform interested Canadians on how the energy system could evolve over the next 25 years to 2030. The report includes a range of potential scenarios for energy supply and demand. Feedback from cross-Canada consultations indicates that Canadians want to see more frequent reports on the future of energy in Canada, which are firmly grounded in sharing of information and increased dialogue. Post-release, the NEB conducted a national conference to further encourage discussion of the results published in the report. The Canada’s Energy Future link on the NEB website received close to 40,000 visits in 2007-2008. The report and accompanying background material can be found at www.neb-one.gc.ca.
The NEB collects and analyses information about Canadian energy markets through regulatory processes and market monitoring in order to support the Board’s regulatory program and to provide public information to support better decisions by policy makers, industry and the public. In its Energy Information Program, the Board focuses on informing Canadians of energy market developments and issues related to the Board’s regulatory mandate (primarily gas, oil and electricity market developments). The program comprises Energy Market Assessments, which provide detailed analyses into aspects of Canada’s energy system, concise briefing notes, energy pricing information on the NEB website and semi-annual energy market outlooks. In 2007-2008, web visits to these areas of our website increased 28 percent over the previous year.
In 2007-2008, the NEB continued to develop an enhanced suite of products and communication services for its energy market analysis and observations. Included were media briefings on the NEB’s outlook for crude oil, natural gas and electricity markets prior to the summer and winter seasons. These outlooks provide the NEB’s expectations of how the markets will perform over the next few months. In addition, NEB Board Members and staff presented at various conferences and roundtables.
The consumer-focused section within the NEB website, Energy Pricing for Canadian Consumers, continues to provide Canadians with timely information about energy pricing in an easy-to-understand format. The energy pricing section examines oil, natural gas, propane and electricity.
The NEB has a legislative responsibility to compile data for several statistical reports related to its regulatory role in the oil, gas and electricity industries. Subject areas include natural gas exports, imports, volumes and prices; exports of propane and butane; crude oil and petroleum products exports; light and heavy crude oil export prices; crude oil supply and disposition; and imports and exports of electricity. Statistical reports can be found on the NEB’s website.
2.3.4 Goal 4
| The NEB fulfills its mandate with the benefit of effective public engagement. |
Throughout its history, the Board has provided opportunities for the public to participate in the regulatory decision-making process. In recent years, the scope of these opportunities has grown to include broad consultation on new processes, an increased number of meetings and hearings in affected communities, and a wider range of tools for the public to access information about the NEB’s operations.
Effective citizen engagement requires a commitment to open, honest and transparent communication. Parties affected by proposed projects have much at stake and in order to make decisions in the public interest, it is critical that the NEB ensures appropriate public engagement. Simplified processes, information sessions, Internet-accessible regulatory documents and Appropriate Dispute Resolution2 are among the methods being used by the Board to support its goal of effective public engagement.
As part of a review of some key issues related to land matters, the NEB has created the Land Matters Consultation Initiative (LMCI). The purpose of this project is to provide a forum for all interested parties and the Board to engage in dialogue and generate options to support the long-term responsible development of the energy sector, while respecting the rights of those affected.
The LMCI includes a 4-stream approach to address the most common issues, including company interactions with landowners, improving the accessibility of NEB processes, and financial and physical issues surrounding pipeline abandonment. For each stream, desired outcomes have been identified and discussion papers were released to provide context for the issues and to focus discussion on key questions. The full spectrum of the Board’s stakeholders, including landowners, industry, Aboriginal groups, non-government organizations, other regulators and government departments, were invited to participate in the LMCI.
Following the consultation process, the Board will release draft reports on the consultation results and invite additional input from parties on the proposed action plan. The Board has worked closely and transparently with key stakeholder groups to design and implement a consultation process that meets the needs of people who want to participate. As a result, stronger and broader relationships are being developed. By working together with parties who are most directly impacted by pipeline infrastructure, steps will be taken to provide greater clarity on the rights and interests of all parties, to continuously improve the accessibility of NEB processes and to bring more certainty to issues related to pipeline abandonment.
Performance Measures and Results
To measure the effectiveness of Goal 4 work, the Board used the following measure:
Board processes provide for effective participation by parties to Board matters
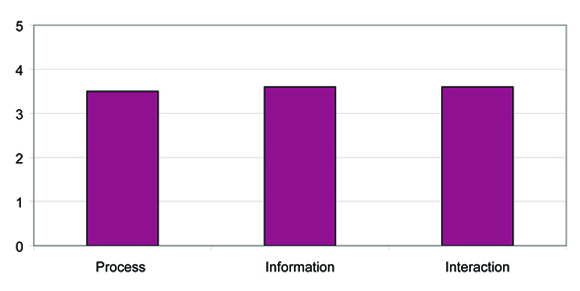
The Board is committed to ensuring that stakeholders are involved effectively in the Board’s public processes. A composite indicator assessing stakeholder satisfaction with NEB processes, information and interaction is used to assess this measure. Based on data from a variety of sources, including surveys administered throughout the year following events such as workshops and hearings, and through comment cards inserted into all publications, stakeholders indicated a rate of 71 percent overall satisfaction. Figure 12 indicates scores on NEB process, information provision and interaction, based on a five-point scale.
Figure 12: Stakeholder Satisfaction with Process, Information and Interaction
A number of events targeting the Canadian public and the media, such as media briefings following the release of publications and process-related information sessions, were organized in 2007-2008 in an effort to share information in a timely and efficient manner. The NEB continues its proactive approach with the media by actively responding to the needs of reporters with respect to the type and extent of information provided, distribution of complementary information pieces and plain language reviews.
Because of the strong focus put on the preparation of the report on Canada’s Energy Future, fewer EMA publications were released during the course of the year. Also, in comparison to the previous year, the Board was not involved in as many hearings of interest to the media. While there was in general good media coverage on NEB processes and information releases, there was a decrease in the number of media hits from the previous year because of the above factors.
Table 6: Media Hits covering NEB Activities
| Media Hits | 2007-2008 | 2006-2007 | Percent Change |
| English | 657 | 1033 | -36.4% |
| French | 52 | 53 | -1.9% |
| Total | 709 | 1086 | -34.7% |
Visits to the NEB website are consistently high. The addition of new search capabilities during the previous year has started to generate positive results even though these search engines are still in the process of indexing the new website.
Program and Results on Objectives of 2007-2008
As noted in the RPP, the NEB identified three objectives. One of these, the objective to employ participant funding for infrastructure applications, was stopped. The NEB received legal advice that legislative amendments would be necessary in order to accomplish participant funding. Further, with the creation of the Major Projects Management Office over the past year, it was understood that there would be a multi-agency approach to this issue; the NEB's requirement for participant funding is subsumed within this approach.
1. Engagement and communication practices for NEB matters meet the needs of stakeholders.
The purpose of the engagement portion of this objective is to ensure that both the Board’s and public stakeholders’ needs are met by effective participation in Board processes. The Board is implementing a public engagement program which proactively assists Canadians to effectively participate in Board matters. As part of its hearing process, the NEB now routinely conducts pre-hearing meetings with interested members of the public to assist them in participating in the hearing.
In 2007-2008, an update of the NEB website was undertaken. The updated website has improved access, enabled stakeholders to better understand what the NEB does, and how to be involved in Board processes. Notable improvements to the website include more straightforward navigation capabilities and a more reliable search function. The renewed website incorporates Treasury Board’s Common Look and Feel (CLF) 2.0 guidelines and further improvements to the website will be made in 2008-2009.
2. The NEB has a range of interest-based approaches to fulfill its regulatory mandate.
For those applications and processes within the NEB’s control, the Board’s direction is to use interest-based processes where possible and, generally, to explore their use prior to relying on adjudicative processes. This should also result in more efficient processes, reduced cycle times and costs. At the same time, there are instances where a hearing is the most effective and appropriate approach. Interest-based approaches and hearings together form a range of process options which the Board can use according to the specifics of the application. The development of a suite of interest-based processes for regulatory processes was stopped as a project in 2007-2008 due to resource issues, but is being implemented on a pilot basis, with a focus on resolving landowner and company issues prior to the time of a regulatory hearing.
2.3.5 Goal 5
| The NEB delivers quality outcomes through innovative leadership and effective processes. |
Goal 5 focuses on the leadership and management accountabilities needed to support a high performance organization that delivers on its commitments. This goal is about sound business management and effective decision-making, to ensure that the organization has the people, technology, facilities, records management procedures, and financial resources available to carry out its mandate.
In 2007-2008, the tight job market across Alberta, as well as skill shortages and corresponding hikes in wages and benefits, continued to affect our ability to be competitive with other employers. In addition, the high cost of housing affected our ability to attract experienced workers to Calgary where the NEB is located. Changing demographics and the need to work within a highly legislated environment have presented further challenges to recruitment efforts.
As well, during 2007-2008, the NEB obtained additional funds from the Treasury Board to hire more skilled staff to deal with the increasing workloads and to invest in succession planning. The Board continues to emphasize interesting work in the national public interest, work/life balance, and flexible work arrangements as part of our attraction and retention incentives.
Performance Measures and Results
In order to evaluate the success of meeting Goal 5 objectives, the NEB used the following performance measures:
- Employee satisfaction
- Effective resource management
Employee Satisfaction
In response to the results of the 2005 government-wide employee opinion survey (EOS), an employee advisory group made 25 key recommendations related to workplace enhancements, relationships and communications. In 2007-2008, the NEB Executive Team acted on many of the recommendations and posted an action log on our intranet. The log records specific activities and initiatives implemented to address priority items such as:
- revitalizing the NEB values;
- expanding Executive Team communications;
- enhancing the performance management program (RESULTS) and training programs;
- developing plans to implement change management training for leaders and employees; and
- launching an employee classification review.
Although a “mini” employee survey was planned for January 2008 to measure the progress of the above noted items as well as other ongoing initiatives, it was postponed due to collective bargaining. The Public Service National EOS is planned for fall 2008. However, as an alternative, an NEB values survey was conducted and the results indicate that 88 to 90 percent of our employees understand and live the values of the organization.
Effective Resource Management
In 2007-2008, business planning included a resource allocation tool and a method of tracking spending for each team and business unit in order to support the NEB in delivering upon its mandate and strategic plan. This year, the business plan became a dynamic document that served as an effective tool for managing resources. This was facilitated by having most activities identified in the business plan linked to our financial accounting system. Utilizing the resource planning tool, the NEB set a target of being within four percent of the annual budget allocation, and was able to exceed this target with a 1.3 percent variance at the end of the fiscal year (Table 7). This variance is predicated on removing the Hearing Reserve allocation and costs, as these are considered uncontrolled. The number and complexity of hearings varies from year to year based on industry demand. In this regard, the Hearing Reserve needs to be dealt with in isolation.
Table 7: NEB Resource Management Resource
| Resource Management ($000,s) | |
| NEB Allocation | $42,452.0 |
| Less: Performance Pay, Market Allowance & Ex Bonus | $2685.8 |
| Less: Recoverable Severance & Maternity Leave | $1,051.3 |
| Revised Allocation | $38,714.9 |
| Less: Expenditures | $37,082.8 |
| Less: Projected Surplus | $766.7 |
| Balance | $865.4 |
| % vs. Revised Allocation | 2.2% |
| Resource Management without Hearing Reserve ($000,s) | |
| Revised Allocation | $38,714.9 |
| Less: Hearing Reserve Allocation | $1,221.6 |
| Revised Allocation | $37,493.3 |
| Less: Expenditures | $36,243.9 |
| Less: Projected Surplus | $766.7 |
| Balance – Without Hearing Reserve | $482.7 |
| % vs. Revised Allocation | 1.3% |
Program and Results on Objectives of 2007-2008
The NEB identified three objectives for Goal 5 in its 2007-2008 RPP. These objectives and the results achieved are discussed below.
1. The NEB has the necessary capacity to fulfill its mandate.
The year 2007-2008 continued to be a time of great change and challenge, both outside and inside the NEB. Staff continues to face increasing demands as a result of globalization, shifts in resource supply and technology changes. Leaders are required to implement a results-based approach emphasizing innovation, accountability and risk taking, while dealing with an increasingly diverse workforce. The NEB will continue to experience intense competition for a smaller pool of knowledgeable, competent employees required to carry out its mandate.
The Board is inspired by the vision of a strategically-managed, high performance organization where the right people are available to do the right things at the right time. Recognizing that organizational performance is directly linked to the technical excellence and flexibility of our workforce, we have continued to develop and refine the annual performance assessment process that links individual performance to the Board’s business priorities. Over the past year, the market allowance and the performance pay pilot project continued in effect so that individual performance could be recognized and rewarded.
Recruitment, Retention, Succession Planning
Given the unique role that the NEB plays on behalf of the Canadian public, the greatest challenge is to attract and retain the people needed to enable the NEB to fulfill its mandate. The NEB’s People Strategy outlines its long-term needs and approach for recruiting and retaining qualified employees. Through this plan, the NEB is updating and improving recruitment and retention strategies and succession planning on a number of fronts.
The NEB provides a flexible work environment for its employees. In an effort to retain staff in the competitive Calgary labour market, several employees telework from different regions of the country. The benefits of a telework policy include retention of experienced employees who thrive on the challenging work of the Board, as well as the ability of those individuals to network with other stakeholders, including provincial governments, associations, pipeline companies and the oil and gas industry, in different parts of Canada.
During 2007-2008, the NEB further defined a framework for supporting the acquisition of knowledge, skills, and experience that will enable employees to advance their individual career objectives while contributing to Board work. The NEB supports career growth through development plans, coaching and other learning opportunities available to all staff. These opportunities may be focused on attaining current job expectations or stretch goals, and are part of a larger succession planning strategy. Last year, NEB employees spent approximately 14 000 hours in learning events, including attending conferences, formal education, courses of study and on-the-job training. In April 2007, the Board launched its Technical Excellence Program, the objective of which is to promote timely and quality knowledge transfer and skills development. To date, nearly 200 NEB staff has received training in a range of technical and legislative competencies as part of the technical excellence project.
The NEB’s leadership development program focused on developing management and leadership skills. By participating in this program, leaders and potential leaders sharpen their skills through hands-on training programs offered in-house and through organizations such as the acclaimed Banff Centre. The in-house program provides the government-specific knowledge required for managing finances, procurement, human resources and government information; the Banff Leadership courses support the growth of strategic, personal, and team leadership skills.
In 2007-2008, the Board launched a new training strategy and offered three customized training courses in project management. Eighty-nine employees participated in the course best suited to their role and level of experience. The Board also provided coaching and support to project managers and drafted a standard for defining the skills and competencies required of project managers.
To enable more effective and efficient recruiting, the NEB developed a Talent Team to lead and facilitate hiring activities. The team, composed of NEB employees, has successfully recruited 19 individuals to the NEB.
Business Continuity Plan
Treasury Board’s Government Security Policy requires departments to establish a business continuity planning program to provide for the continued availability of critical services and assets, and of other services and assets when warranted by a threat and risk assessment. Critical services and associated assets must remain available in order to assure the health, safety, security and economic well-being of Canadians, and the effective functioning of government.
The NEB’s Business Continuity Plan (BCP) was updated this past year using the services of a consulting firm to aid in this endeavour. In addition, a pandemic plan has been written and will be incorporated as a chapter in the BCP. Unfortunately, the high rate of staff turnover, particularly in key BCP positions, and the pressures of other tasks have meant that the updated plans were not delivered until year-end. This has meant that the necessary staff training and awareness was not accomplished in this reporting period but will be addressed in the next fiscal year.
Resource Management
The Canadian energy sector has been very active, placing a high demand on the NEB in its regulatory role. As a consequence, the NEB has experienced a significant increase in its costs. In order to continue effectively meeting its mandate, it was necessary for the NEB to seek additional financial resources. Accordingly, the NEB made a submission to Treasury Board and, on 18 September 2007, received approval for an additional $25.5 million to be provided over the next three years. This funding will enable the NEB to meet the higher cost of its operations. These expenditures will be eligible for recovery under the NEB’s Cost Recovery Regulations.
Information Management Renewal
The Board’s Information Management Renewal project establishes the tools, training, techniques and practices that will respond to the information management needs of the NEB and the Government of Canada. As part of this project, the Government of Canada Information Management standard toolset known as the Record and Document Information Management System (RDIMS), is being implemented. Consultations with key staff members and NEB business units have been completed to ensure business alignment with the work to date. The Board’s file plan has been reviewed and updated to meet Library and Archives Canada guidelines. The Information Management Renewal project will streamline information handling at the Board, and preserve information of enduring value to Canadians. During the first quarter of 2008, all Board staff received Information Management and RDIMS application training, enabling staff to share in and contribute to a managed corporate information repository.
2. The NEB lives a results-based culture of excellence.
Leadership and Development Programs
The NEB continues its commitment to demonstrating excellence in all aspects of its work. The NEB’s focus is on supporting staff career management through development plans, mentoring and challenge opportunities. Throughout 2007-2008, a number of activities related to the Learning and Development Framework were incorporated to continue the promotion of an NEB culture while proactively addressing employee attraction, engagement and transition challenges:
- The NEB OnBoarding Program was developed by initially reviewing and revamping the overall NEB Orientation Program. Key in this revamp was the publication of an employee handbook to be given to each new employee. As well, this program was expanded to introduce new employees to both an information technology and a workplace health and safety component;
- Further emphasis has been placed on individual learning plans with the development and publication of a formal learning plan document. This document now forms part of the RESULTS performance management system and is discussed as part of the RESULTS debriefing process;
- The NEB implemented the Management 101 course for all leaders and supervisors at the NEB. This training was developed in concert with the Canada School of Public Service (CSPS) and is based on the institution’s G110/124 courses. A consultant was hired during this period to review all CSPS management courses with a view to applicability to the NEB; and
- Utilizing the expertise resident in our Professional Leadership Team, a formal coaching and mentoring program has been put in place to assure continued knowledge transfer to new, less experienced staff while at the same time ensuring more experienced staff is afforded the opportunity to develop and expand their horizons.
Recognition and Reward Programs
With the current labour market in Alberta and more particularly, Calgary, the importance of recognition as a means of increasing employee retention has been recognized. The NEB Rewards and Recognition program, which culminates in an annual ceremony, salutes employee efforts and successes throughout the year. This program features a range of formal and informal measures for collectively expressing and reinforcing NEB values and the way that people work effectively together. In 2007-2008, focus groups were consulted to solicit employee input in order to incorporate new means of recognizing our employees and their achievements that support our strategic plan.
Corporate Performance Measures
The purpose of this project was to review the NEB’s current suite of corporate measures and to provide recommendations for improvements. The need for this improvement work was identified through the NEB’s Quality Management System (QMS) implementation, as well as feedback from stakeholders. The project was a timely one for the Board, since it coincided with a number of requirements from different sources to document, review and improve our measures.
The framework used for the measures was the Strategic Plan Goals and the regulatory outcomes leading to those Goals. This framework, as represented through logic models for each Goal, allowed the project team to systematically review the existing measures, identify gaps, and provide recommendations for improved measures and improvements to our performance measurement system.
The project team documented existing measures, conducted a gap analysis, developed improvements for our corporate performance assessment process and provided recommendations for our overall suite of measures by Goal. The project team found that it was not possible to work on improving measures without looking at our whole performance measurement system. Thus, project recommendations address improvements for our Board-wide performance measurement system, as well as for program measures that contribute to the Goals.
3. The NEB has a fully operational quality management system.
The Quality Management System (QMS) is the framework of processes and accountabilities by which we ensure that we meet the needs of our stakeholders, today and in the future. Started in 2005-2006, QMS is now firmly ingrained in the NEB's culture and is accepted as the way we work. All new employees receive QMS orientation so they are equipped to use the 500-plus documents that describe the Board's 70 business processes and sub-processes. In 2007-2008 alone, staff recorded 363 improvement suggestions, many of them implemented, on how to make our products and processes even better.
Throughout 2007-2008, the NEB continued to implement its Quality Management System as a framework for:
- effective, efficient execution of Board processes;
- ensuring stakeholder needs are met;
- enabling process consistency where required, and flexibility where possible; and
- encouraging continuous improvement.
A gap analysis conducted in the last quarter of the fiscal year indicated that the Board had exceeded its target of 60 percent completion on the 'QMS Maturity' index, using the ISO 9001:2000 Quality Management Systems – Requirement as a guide, with a final score of 65 percent. The score exceeded the previous year’s rating and indicates improvement in key NEB processes.
As a sub-set of the QMS, an NEB internal website project working group has been established with a view to aligning the NEB website (known as iWeb) with the current QMS Process Dashboard. This project has finished the design phase with the preparation of some initial mock-ups of the new iWeb design and the completion of a series of client reviews. The suggestions and feedback received have been incorporated into the design and a prototype to test usability is under construction.
