
Treasury Board of Canada Secretariat
www.tbs-sct.gc.ca
Common menu bar links
Breadcrumb Trail
ARCHIVED - Fisheries and Oceans Canada
 This page has been archived.
Archived Content
Information identified as archived on the Web is for reference, research or recordkeeping purposes. It has not been altered or updated after the date of archiving. Web pages that are archived on the Web are not subject to the Government of Canada Web Standards. As per the Communications Policy of the Government of Canada, you can request alternate formats on the "Contact Us" page.
Section 1 — Departmental Overview
Minister's Message

As Minister of Fisheries and Oceans, I am pleased to present our Departmental Performance Report for 2007-2008 to Parliament and the people of Canada.
Fisheries and Oceans Canada (DFO) was established in 1868 and has served Canada with distinction through the careful stewardship of fish and ocean resources. Guided by sound scientific knowledge and effective management, DFO works toward attaining three strategic outcomes:
- Safe and Accessible Waterways;
- Sustainable Fisheries and Aquaculture; and
- Healthy and Productive Aquatic Ecosystems.
To help achieve these outcomes, DFO concentrated on a number of priorities in 2007-2008:
- Strengthening International Fisheries Governance — The Department strengthened high seas governance of global fisheries by working with international partners to promote sustainability and ecosystem-based fisheries management, while ensuring long-term opportunities for harvesters;
- Supporting Aboriginal Participation in Integrated Commercial Fisheries — DFO assisted Aboriginal communities in developing strong and sustainable commercial fisheries enterprises, under one set of rules for everyone;
- Working on "Ocean to Plate" — The Department has been working with the provinces and territories, and with all fisheries stakeholders, to improve efficiency and economic viability of commercial fisheries and aquaculture;
- Improving Fisheries Science — The Department's science renewal initiative helped DFO become more innovative, adaptive and collaborative in meeting the needs of clients and partners;
- Rejuvenating the Coast Guard — The Coast Guard focused on renewing its fleet and participated in the federal maritime security agenda;
- Northern Strategy — DFO was a key player in Canada's Arctic, which strengthened our presence in the North;
- Supporting the Seal Hunt — DFO continued its commitment to a humane, sustainable and economically viable seal hunt through strong support of our sealers at home and abroad;
- Implementing Canada's Oceans Action Plan — The Oceans Action Plan brought together stakeholders to better manage ocean activities;
- Promoting Aquaculture — The federal government has provided $70 million over five years to improve regulation of aquaculture, to enhance regulatory science and to strengthen the industry's competitiveness and productivity; and
- Improving Our Regulatory Processes — DFO's Environmental Process Modernization Plan, along with the Major Project Management Office, improved the effectiveness and efficiency of our protection of fish habitat.
I look forward to working with the employees of DFO, and with our partners across Canada and beyond, to seize further opportunities for success — on behalf of all Canadians from coast to coast to coast.
_______________________________
The Honourable Gail Shea, P.C., M.P.
Minister of Fisheries and Oceans
Raison d'�tre
Fisheries and Oceans Canada (DFO) manages and safeguards Canada's ocean, fish and aquatic resources. Ensuring safe, healthy and productive waters and aquatic ecosystems for the benefit of present and future generations is the essence of the Department's activities.
DFO's VisionExcellence in service to Canadians to ensure the sustainable development and safe use of Canadian waters |
The Canadian Coast Guard (CCG) is a Special Operating Agency within DFO. It delivers maritime services that contribute to the enhancement and maintenance of maritime safety and commerce; protection of the marine and freshwater environment; oceans and fisheries resource management; security; and other government maritime priorities. CCG provides these services via maritime expertise, Canada's civilian fleet, a broadly distributed shore infrastructure and collaboration with various stakeholders.
The work of DFO and CCG is built around three strategic outcomes:
- Safe and Accessible Waterways — providing access to Canadian waterways, and ensuring the overall safety and integrity of Canada's marine infrastructure for the benefit of all Canadians;
- Sustainable Fisheries and Aquaculture — delivering an integrated fisheries and aquaculture program that is credible, science-based, affordable and effective, and contributes to sustainable wealth for Canadians; and
- Healthy and Productive Aquatic Ecosystems — ensuring, through oceans and habitat management, the sustainable development and integrated management of resources in or around Canada's aquatic environment, as well as carrying out critical science and fisheries management activities.
The Department's guiding legislation includes the Oceans Act, which charges the Minister with leading integrated oceans management and providing coast guard and hydrographic services on behalf of the Government of Canada, and the Fisheries Act, which gives the Minister responsibility for the management of fisheries, habitat and aquaculture. The Department also shares, with Environment Canada and Parks Canada, responsibility for the Species at Risk Act, which charges the Minister with the responsibilities associated with the management of aquatic species at risk in Canada.
Program Activity Architecture
The Government of Canada's Management, Resources and Results Structure (MRRS) Policy and Whole of Government Framework are the foundation of a common, government-wide approach to the collection, management and reporting of financial and non-financial information.
DFO's Program Activity Architecture (PAA) is a component of its MRRS. The PAA describes how DFO's programs contribute to the Department's three strategic outcomes and is the basis for reporting to Parliament. The PAA also specifies the corporate functions that support the delivery of DFO's programs to Canadians. These functions are called Program Enablers. Further information about the Program Enablers can be found on DFO's website.
Summary of Performance by Strategic Outcome
The Departmental Performance Report (DPR) summarizes departmental progress on commitments outlined in the corresponding Report on Plans and Priorities (RPP). The two documents are structured according to DFO's PAA.
DFO's PAA is also linked to the Whole of Government Framework, which is in a sense the PAA for the Government of Canada. The Whole of Government Framework has four spending areas: Economic Affairs, Social Affairs, International Affairs and Government Affairs. These four spending area are further broken down into 13 outcome areas. Each outcome area is associated with a number of results the federal government and the Department are working to achieve.
The following table shows the relationship between DFO's program activities and the Whole of Government outcome areas. In all cases, the expected results for 2007-2008 are described in Section 2.
Strategic Outcome: Safe and Accessible Waterways
| Contributed to the departmental priorities Canadian Coast Guard Rejuvenation, Departmental Renewal and Science Renewal and to all management priorities. | ||||
| Program Activity | Planned Spending 2007-2008 |
Total Authorities 2007-2008 |
Actual Spending 2007-2008 |
Alignment to Whole of Government Outcomes |
|---|---|---|---|---|
| Canadian Coast Guard | 718.1 | 744.5 | 692.3 | Safe and secure communities |
| Small Craft Harbours | 109.2 | 112.1 | 112.7 | Strong economic growth |
| Science | 48.0 | 67.3 | 51.2 | An innovative and knowledge-based economy |
Strategic Outcome: Sustainable Fisheries and Aquaculture
| Contributed to the departmental priorities Fisheries Renewal, International Governance, Aquaculture Governance and Science Renewal and to all management priorities. | ||||
| Program Activity | Planned Spending 2007-2008 |
Total Authorities 2007-2008 |
Actual Spending 2007-2008 |
Alignment to Whole of Government Outcomes |
|---|---|---|---|---|
| Fisheries Management | 350.5 | 401.3 | 364.8 | Strong economic growth |
| Aquaculture | 5.0 | 5.4 | 5.4 | Strong economic growth |
| Science | 191.0 | 219.6 | 209.2 | An innovative and knowledge-based economy |
Strategic Outcome: Healthy and Productive Aquatic Ecosystems
| Contributed to the departmental priorities Governance, Oceans Action Plan, Environmental Process Modernization and Science Renewal and to all management priorities. | ||||
| Program Activity | Planned Spending 2007-2008 |
Total Authorities 2007-2008 |
Actual Spending 2007-2008 |
Alignment to Whole of Government Outcomes |
|---|---|---|---|---|
| Oceans Management | 21.2 | 24.7 | 20.2 | A clean and healthy environment |
| Habitat Management | 79.8 | 91.4 | 77.8 | A clean and healthy environment |
| Science | 74.0 | 82.1 | 83.1 | An innovative and knowledge-based economy |
Operating Environment and Risk Analysis
DFO operates in a complex and demanding policy and program environment. Over the past year, for example, protecting ocean habitat, strengthening international fisheries governance, transforming Aboriginal commercial fisheries and positioning Canada to assert its claims to Arctic sovereignty required sustained management attention and interdepartmental collaboration.
Meeting these and other policy and program demands requires that the Department address risks and challenges on an ongoing basis. Environmental scanning identifies key factors that shape and affect DFO's operating environment, as well as the organization's future direction. In recent years, the following have posed significant risks or challenges to both DFO as a whole and individual programs in particular:
- External cost pressures, such as fluctuating energy prices and the rising Canadian dollar;
- Increases in maritime traffic, technological change, climate change and extended shipping seasons;
- Increased demands for services, infrastructure and citizen engagement;
- Pressure from the provinces and the private sector for additional involvement in and collaboration on areas of shared interest;
- Increased need for scientific knowledge related to the interdependence of ecosystems and the impact of climate change;
- International fisheries issues that require Canada to demonstrate leadership in international fisheries reform and oceans governance mechanisms; and
- Accelerated private-sector development in and around water.
From an organization and governance perspective, the review of the DFO Management Model in 2006 largely confirmed the corporate structure and the distribution of accountabilities. DFO senior management implemented some changes in its corporate committees to strengthen senior-level decision-making processes and support the integration of policy and program decision-making across programs. The organization continued to adapt to the implementation of Coast Guard as a Special Operating Agency, as well as to the implementation of the Species at Risk Act.
Human Resources
DFO had approximately 10,350 employees in 2007-2008 distributed across the Department's six regions and headquarters. DFO is an operational department; 33.6% of its employees work on the technical side, 21.6% on the operational side. Nearly 90% of DFO employees work outside headquarters.
To support its workforce, DFO has made a commitment to create a work environment that supports all aspects of human resource management. DFO's strengths in this area include the widespread use of both official languages, effective labour relations and the encouragement of lifelong learning. Having a workforce that is representative of the Canadian population is also a priority at DFO. Over the past several years, DFO has made major progress in improving the representation of designated groups; however, continued efforts to improve this representation are needed, particularly with regard to women and visible minorities.
Expenditure Profile
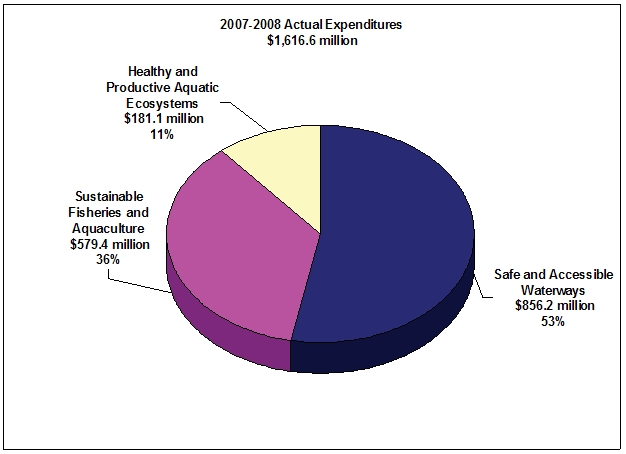
The Department's total Actual Spending for the 2007-2008 fiscal year was $1,616.6 million. This represents a decrease of 2.0% from 2006-2007. This spending was allocated across DFO's strategic outcomes as follows:
- 53% — $856.2 million — was used to ensure safe and accessible waterways.
- 36% — $579.4 million — was used to ensure sustainable fisheries and aquaculture.
- 11% — $181.1 million — was used to ensure healthy and productive aquatic ecosystems.
The table below shows the Department's Main Estimates and Planned Spending at the time of tabling the Report on Plans and Priorities, final Total Authorities and final Actual Spending by program activity.
Comparison of Planned to Actual Spending ($ millions)
| Program Activity | 2005-2006 Actual | 2006-2007 Actual | 2007-2008 | |||
|---|---|---|---|---|---|---|
| Main Estimates | Planned Spending | Total Authorities | Actual Spending | |||
| Safe and Accessible Waterways | ||||||
| Canadian Coast Guard | 611.3 | 652.0 | 689.4 | 718.1 | 744.5 | 692.3 |
| Small Craft Harbours | 118.3 | 117.5 | 89.2 | 109.2 | 112.1 | 112.7 |
| Science | 48.1 | 65.4 | 48.0 | 48.0 | 67.3 | 51.2 |
| Sustainable Fisheries and Aquaculture | ||||||
| Fisheries Management | 364.8 | 424.5 | 345.8 | 350.5 | 401.3 | 364.8 |
| Aquaculture | 5.1 | 5.7 | 5.0 | 5.0 | 5.4 | 5.4 |
| Science | 184.6 | 200.7 | 187.9 | 191.0 | 219.6 | 209.2 |
| Healthy and Productive Aquatic Ecosystems | ||||||
| Oceans Management | 21.7 | 24.4 | 20.5 | 21.2 | 24.7 | 20.2 |
| Habitat Management | 69.2 | 70.5 | 78.9 | 79.8 | 91.4 | 77.8 |
| Science | 71.4 | 88.2 | 74.0 | 74.0 | 82.1 | 83.1 |
| Total | 1,494.5 | 1,648.9 | 1,538.6 | 1,596.7 | 1,748.4 | 1,616.6 |
| Less: Non-respendable Revenue | (66.3) | (60.1) | N/A | (45.8) | N/A | (61.5) |
| Plus: Cost of Services Received without Charge | 99.8 | 101.0 | N/A | 91.9 | N/A | 95.3 |
| Total Departmental Spending | 1,528.0 | 1,689.8 | N/A | 1,642.9 | N/A | 1,650.5 |
Note: Because of rounding, figures may not add to the totals shown.
The $58.1 million difference between the Main Estimates of $1,538.6 million and Planned Spending of $1,596.7 million is due to new initiatives that were expected to be requested through Supplementary Estimates. These items included $22.4 million related to Canadian Coast Guard Capital items, $20.0 million for Small Craft Harbours, $6.8 million for the Species at Risk Act, $5.9 million in capital carryforwards and $3.0 million in several smaller items. The Main Estimates and these additional items account for the overall Planned Spending of $1,596.7 million.
The $151.7 million difference between the Planned Spending of $1,596.7 million and the Total Authorities of $1,748.4 million is attributable mainly to the following spending initiatives and adjustments:
- $94.8 million in additional spending approved in the Supplementary Estimates;
- $47.1 million in funds carried forward from 2006-2007 to 2007-2008;
- $20.6 million for maternity leave and severance pay;
- $6.4 million for increased salary expenditures related to approved collective agreements;
- $1.6 million for statutory and year-end adjustments; and
- ($18.6 million) in Canadian Coast Guard capital items included in Planned Spending that have been delayed.
The $131.8 million difference between the Actual Spending of $1,616.6 million and the Total Authorities of $1,748.4 million is attributable mainly to the following increases and decreases:
- $96.7 million in Operating, Capital and Grants and Contributions authorities that were carried forward to future years;
- $13.0 million in Canadian Coast Guard capital that was carried forward to future years;
- $10.6 million in lapsing appropriations that were due primarily to a shortfall in revenues;
- $7.5 million in Grants and Contributions funding that was not spent during the year; and
- $4.0 million in employee benefit charges for the conversion of the operating budget to salaries.
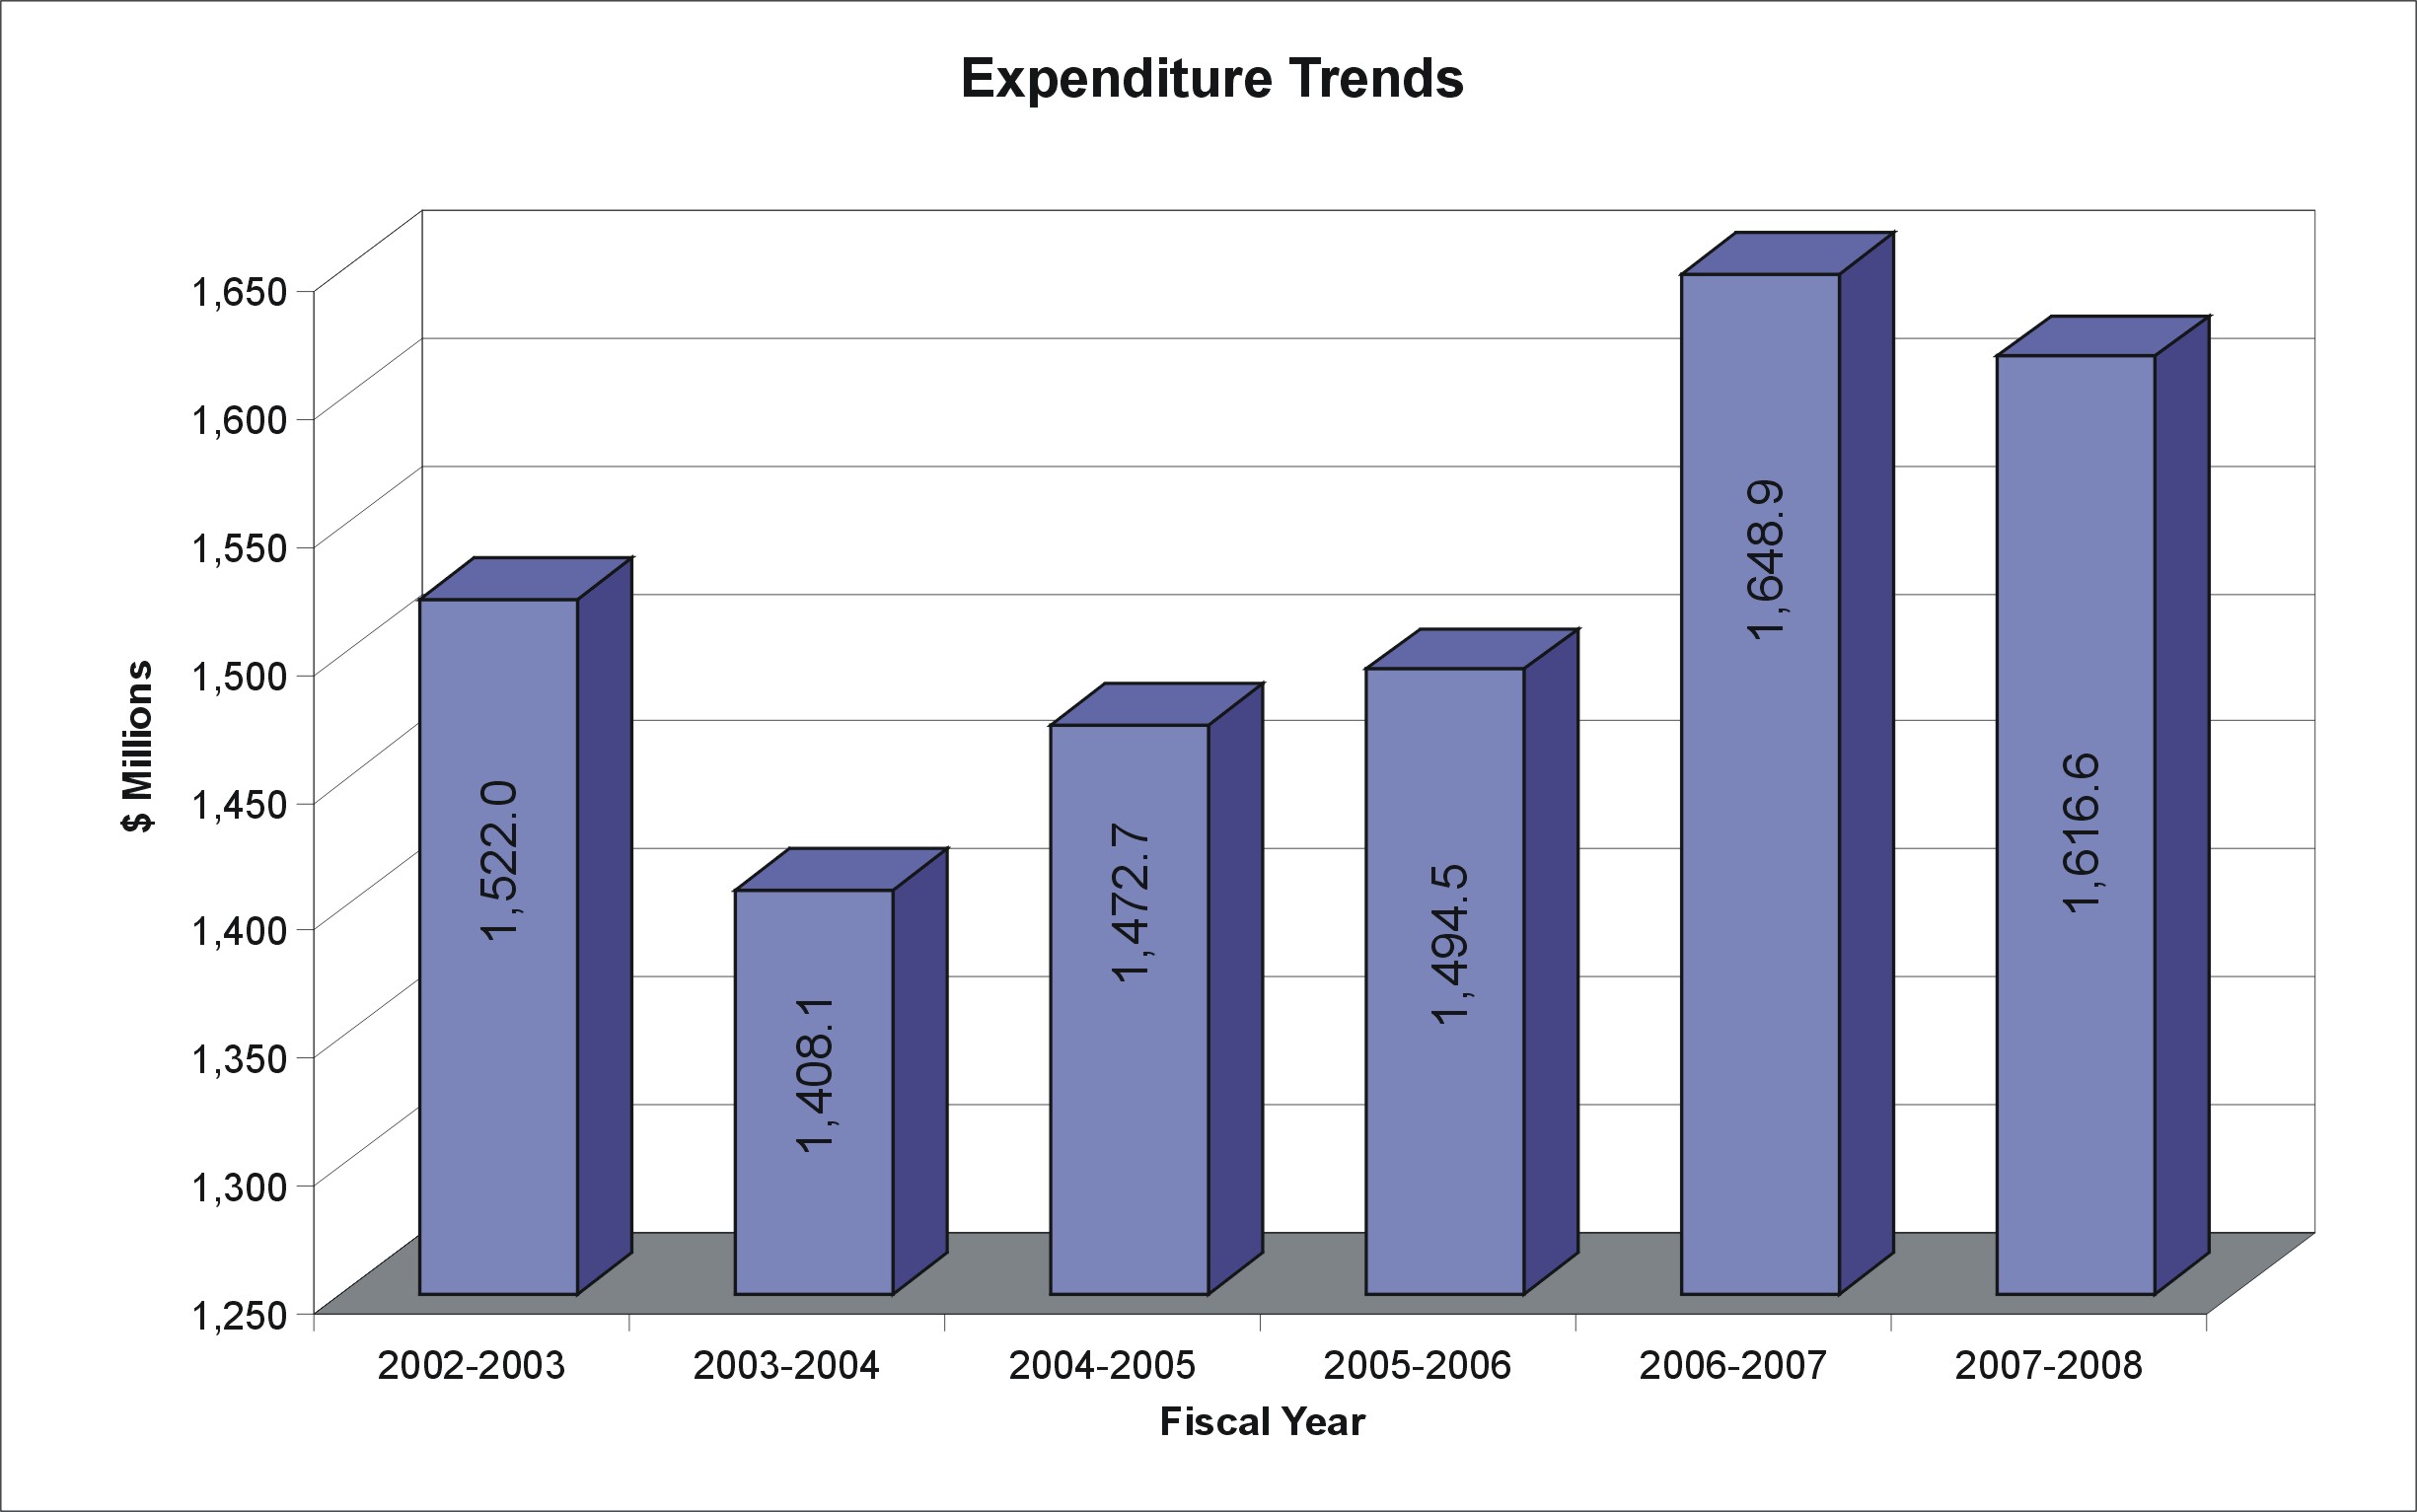
DFO averaged $1,527.1 million in Actual Spending between 2002-2003 and 2007-2008, with a general increase in spending during this time. Actual Spending of $1,648.9 million and $1,616.6 million in 2006-2007 and 2007-2008 respectively is well above the average and is mainly attributable to increased spending authorities.
Voted and Statutory Items
The table below summarizes the resources that Parliament approves for the Department through appropriation acts. A vote specifies the amount devoted to each expenditure category. The items identified with an S are authorities that Parliament has approved through other legislation that sets out both the purpose of the expenditures and the terms and conditions under which they may be made. Statutory spending is included in the Estimates for information only and does not require a separate appropriation act.
Voted and Statutory Items, 2007-2008 ($ millions)
| Vote | Main Estimates | Planned Spending | Total Authorities | Actual | |
|---|---|---|---|---|---|
| 1 | Operating | 1,129.8 | 1,165.6 | 1,279.1 | 1,210.8 |
| 5 | Capital | 232.1 | 254.4 | 263.5 | 211.2 |
| 10 | Grants and Contributions | 55.1 | 55.1 | 82.6 | 73.4 |
| (S) | Minister of Fisheries and Oceans - Salary and motor car allowance | 0.1 | 0.1 | 0.1 | 0.1 |
| (S) | Contributions to employee benefit plans | 121.5 | 121.5 | 118.1 | 118.1 |
| (S) | Spending of proceeds from the disposal of surplus Crown assets | 5.0 | 3.1 | ||
| Total | 1,538.6 | 1,596.7 | 1,748.4 | 1,616.6 | |
Note: Because of rounding, figures may not add to the totals shown.
Human Resources
Comparison of Planned to Actual Full-time Equivalents
| Program Activity | Planned | Actual | Difference |
|---|---|---|---|
| Safe and Accessible Waterways | |||
| Canadian Coast Guard | 4,703 | 4,753.2 | 50.21 |
| Small Craft Harbours | 126 | 118.4 | -7.6 |
| Science for Safe and Accessible Waterways | 274 | 273.6 | -0.4 |
| Sustainable Fisheries and Aquaculture | |||
| Fisheries Management | 1,445 | 1,469 | 242 |
| Aquaculture | 29 | 34.4 | 5.4 |
| Science for Sustainable Fisheries and Aquaculture | 993 | 973.5 | -19.53 |
| Healthy and Productive Aquatic Ecosystems | |||
| Oceans Management | 118 | 109.8 | -8.2 |
| Habitat Management | 496 | 463.8 | -32.24 |
| Science for Healthy and Productive Aquatic Ecosystems | 405 | 372.6 | -32.45 |
| Program Enablers | 1,940 | 1,782.3 | -157.7 |
| Total | 10,529 | 10,350.3 | -178.7 |
1 This difference is due to the usage of full-time equivalents (FTEs) for the United Nations Convention on the Law of the Sea (UNCLOS) and the International Polar Year projects. These usages were not part of the Planned Spending presented in the RPP, but Operations and Maintenance funding was available and was used for the projects.
2 New Fisheries Officers recruits were hired as part of the succession planning for expected retirements, and FTEs for the Salmon Enhancement Program were not included in the estimates in the RPP.
3 The difference is due to turnover and delays in classification and staffing.
4 Funding for the Regulatory Improvement Initiative was received late in the fiscal year, which resulted in FTEs not being fully used.
5 There was a carryforward of eight FTEs from 2007-2008 to 2008-2009 for the International Polar Year program. Turnover and delays in classification and staffing were also a factor.