Common menu bar links
Breadcrumb Trail
ARCHIVED - Canada Revenue Agency
 This page has been archived.
Archived Content
Information identified as archived on the Web is for reference, research or recordkeeping purposes. It has not been altered or updated after the date of archiving. Web pages that are archived on the Web are not subject to the Government of Canada Web Standards. As per the Communications Policy of the Government of Canada, you can request alternate formats on the "Contact Us" page.
Section III:Supplementary Information
Financial Highlights
The future-oriented financial highlights presented within this Report on Plans and Priorities (RPP) are intended to serve as a general overview of the Canada Revenue Agency (CRA) financial position and operations. These future-oriented financial highlights are prepared on an accrual basis to strengthen accountability and improve transparency and financial management.
Future-oriented financial statements can be found on CRA's Web site at: www.cra.gc.ca/rppe
Capital assets totalling $537.1M comprise most of the Agency's Assets for 2010-2011, with software ($490.0M) being the largest asset class, as the CRA looks to take advantage of the newest technology in delivering its programs and services to Canadians. Net Liabilities represent liabilities incurred by the Agency which are expected to be funded by appropriations in future years, as they are paid.
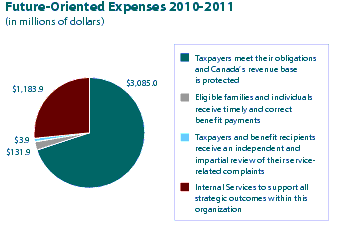
The chart below outlines the Agency's future-oriented total expenses for 2010-2011. It is projected that total expenses will be $4,404.7M for the coming fiscal year. Most of these expenses ($3,085.0M) will be directed at enhancing CRA's capability to achieve its first strategic outcome: Taxpayers meet their obligations and Canada's revenue base is protected. CRA will focus on Tax Integrity and Strengthening Services. Tax Integrity will be achieved by making it harder to be non-compliant by actively and consistently addressing the promotion of non-compliance and improving communication and information-sharing with federal and international stakeholders to permit rapid response to emerging compliance threats. Strengthening Service will be achieved by making it easier for taxpayers to comply by carrying out CRA's Service Strategy to expand self-service options, optimize telephone service, and fine-tune the outreach and communication efforts. $131.9M in expenses will be used to meet CRA's second strategic outcome: Eligible families and individuals receive timely and correct benefit payments. To maintain a strong performance in benefit programs delivery, CRA's focus will mostly be on Strengthening Service and Benefits Validation. Strengthening Service will be achieved by improving communications and enhancing electronic service offering. Benefits validation will be achieved by creating a credible enforcement presence and by educating benefit recipients about their rights and obligations. $3.9M in expenses will be used to support CRA's third strategic outcome: Taxpayers and benefit recipients receive an independent and impartial review of their service-related complaints with the Taxpayers' Ombudsman activity. Finally, $1,183.9M in expenses will be used in support of internal services. Internal Services activities are those that apply across the organization and not to a specific program. These include activities such as Management and Oversight Services; Communications Services; Legal Services; Human Resources Management Services; Financial Management Services; Information Management Services; Information Technology Services; Real Property Services; Materiel Services; Acquisition Services; and Travel and Other Administrative Services.

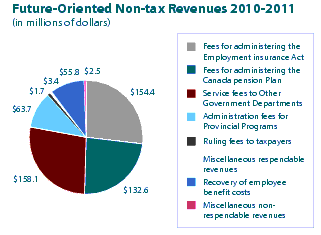
The chart below outlines the CRA's future-oriented total non-tax revenues for 2010-2011. It is projected that total non-tax revenues will be $572.2M for the coming fiscal year. The majority of these non-tax revenues ($287.0M) are revenues credited to Vote 1 and are expected to come from the administration of the Employment Insurance Act ($154.4M) and the Canada Pension Plan ($132.6M). While 40% ($226.9M) are non-tax revenues available for spending and are expected to come from service fees to Other Government Departments ($158.1M), Administration fees for Provincial Programs ($63.7M), Ruling Fees to taxpayers ($1.7M), and other miscellaneous Respendable fees and changes ($3.4M). The remaining 10% ($58.3M) are non-tax revenues not available for spending and will come from the recovery of employee benefit costs relating to non-tax revenues credited to Vote 1 and revenues available for spending ($55.8M) as well as other miscellaneous non-respendable non-tax revenues ($2.5M).

List of Tables
The following tables are available electronically on the Treasury Board of Canada Secretariat's Web site:
Table 2: Details on Transfer Payment Programs
Table 4: Sources of Respendable and Non-Respendable Non-Tax Revenue
The following tables are available electronically on the CRA Web site: www.cra.gc.ca/rppe
Table 1: Agency Planned Spending and Full-Time Equivalents
Table 3: Services Received Without Charge
Canada Revenue Agency Future-oriented Financial Statements
Green Procurement
For more information on the CRA's green procurement program, please visit the Treasury Board of Canada Secretariat's Web site: http://www.tbs-sct.gc.ca/rpp/2010-2011/inst/nar/st-tstb-eng.asp
Service Standards at the CRA
Our service standards regime is a vital and integral part of our planning, reporting, and performance management processes. Meeting our service standards targets demonstrates that we are responsive to the needs of taxpayers and benefit recipients. This helps establish credibility in our operations and contributes to increasing the level of confidence that Canadians can place in government. For more information on our Service Standards, please visit the CRA Web site at: www.cra.gc.ca/gncy/stndrds/menu-eng.html
Internal Audits and Evaluations
For more information on the Agency's Internal Audits and Evaluations, please visit the Treasury Board of Canada Secretariat's Web site: http://www.tbs-sct.gc.ca/rpp/2010-2011/inst/nar/st-tstb-eng.asp
