Common menu bar links
Breadcrumb Trail
ARCHIVED - Appendices to the Expenditure Review of Federal Public Sector Compensation Policy and Comparability
 This page has been archived.
Archived Content
Information identified as archived on the Web is for reference, research or recordkeeping purposes. It has not been altered or updated after the date of archiving. Web pages that are archived on the Web are not subject to the Government of Canada Web Standards. As per the Communications Policy of the Government of Canada, you can request alternate formats on the "Contact Us" page.
Appendix G
Analysis for selected classification groups of the distribution of employees by classification level, 1991–2003
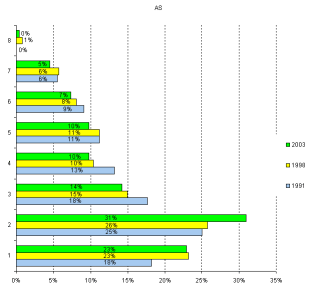
AS
|
|
1991 |
1994 |
1998 |
2001 |
2003 |
91/03 |
|
AS0 |
14 |
5 |
4 |
4 |
7 |
-50% |
|
AS1 |
2638 |
3158 |
3371 |
4279 |
5467 |
107% |
|
AS2 |
3638 |
4086 |
3742 |
6059 |
7379 |
103% |
|
AS3 |
2564 |
2549 |
2166 |
2865 |
3384 |
32% |
|
AS4 |
1919 |
1989 |
1510 |
1878 |
2328 |
21% |
|
AS5 |
1626 |
1711 |
1621 |
1822 |
2329 |
43% |
|
AS6 |
1323 |
1321 |
1173 |
1476 |
1750 |
32% |
|
AS7 |
804 |
943 |
827 |
929 |
1080 |
34% |
|
AS8 |
3 |
103 |
116 |
99 |
92 |
2967% |
|
AS20 |
0 |
0 |
0 |
11 |
1 |
- |
|
Total |
14529 |
15865 |
14530 |
19422 |
23817 |
64% |
AS0 and AS20 levels are not shown in the pyramids
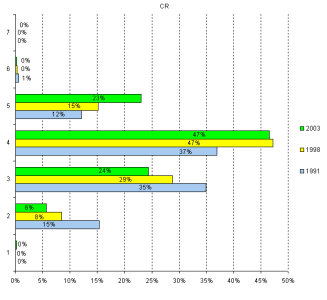
CR
|
1991 |
1994 |
1998 |
2001 |
2003 |
91/03 |
|
|
CR1 |
70 |
48 |
35 |
53 |
93 |
33% |
|
CR2 |
9248 |
5908 |
3597 |
2939 |
2472 |
-73% |
|
CR3 |
21009 |
17013 |
12225 |
11673 |
10546 |
-50% |
|
CR4 |
22228 |
23391 |
20022 |
20644 |
20150 |
-9% |
|
CR5 |
7275 |
7362 |
6418 |
8813 |
9974 |
37% |
|
CR6 |
339 |
253 |
126 |
87 |
92 |
-73% |
|
CR7 |
3 |
3 |
2 |
2 |
1 |
-67% |
|
Total |
60172 |
53978 |
42425 |
44211 |
43328 |
-28% |
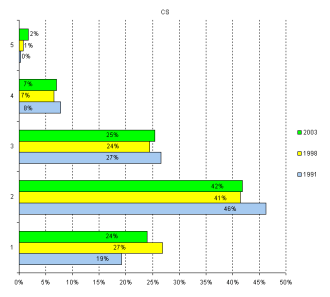
CS
|
|
1991 |
1994 |
1998 |
2001 |
2003 |
91/03 |
|
CS1 |
1059 |
1435 |
2533 |
3216 |
3622 |
242% |
|
CS2 |
2549 |
3394 |
3902 |
5065 |
6323 |
148% |
|
CS3 |
1465 |
1787 |
2303 |
2967 |
3833 |
162% |
|
CS4 |
427 |
510 |
615 |
982 |
1057 |
148% |
|
CS5 |
16 |
44 |
69 |
212 |
262 |
1538% |
|
Total |
5516 |
7170 |
9422 |
12442 |
15097 |
174% |
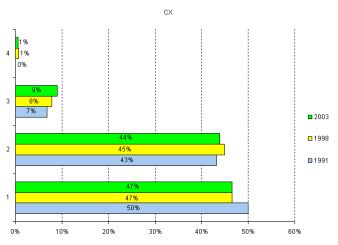
CX
|
|
1991 |
1994 |
1998 |
2001 |
2003 |
91/03 |
|
CX1 |
2275 |
2083 |
2295 |
2572 |
2872 |
26% |
|
CX2 |
1968 |
2070 |
2219 |
2694 |
2709 |
38% |
|
CX3 |
307 |
293 |
388 |
489 |
555 |
81% |
|
CX4 |
6 |
2 |
33 |
34 |
35 |
483% |
|
Total |
4556 |
4448 |
4935 |
5789 |
6171 |
|
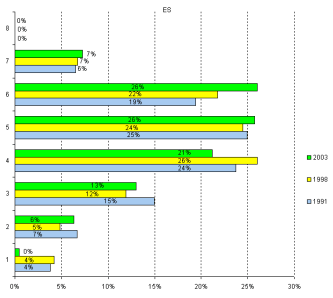
ES
|
|
1991 |
1994 |
1998 |
2001 |
2003 |
91/03 |
|
ES1 |
99 |
60 |
133 |
103 |
25 |
-75% |
|
ES2 |
175 |
169 |
152 |
257 |
357 |
104% |
|
ES3 |
392 |
466 |
375 |
474 |
737 |
88% |
|
ES4 |
622 |
665 |
820 |
1012 |
1199 |
93% |
|
ES5 |
653 |
728 |
771 |
1128 |
1454 |
123% |
|
ES6 |
509 |
597 |
685 |
1058 |
1470 |
189% |
|
ES7 |
170 |
215 |
213 |
285 |
410 |
141% |
|
ES8 |
1 |
0 |
1 |
0 |
1 |
0% |
|
Total |
2621 |
2900 |
3150 |
4317 |
5653 |
116% |
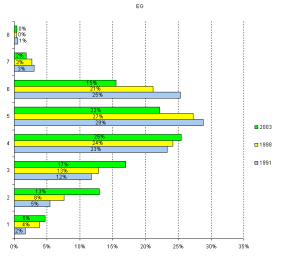
EG
|
|
1991 |
1994 |
1998 |
2001 |
2003 |
91/03 |
|
EG1 |
126 |
114 |
234 |
424 |
427 |
239% |
|
EG2 |
408 |
369 |
460 |
1182 |
1185 |
190% |
|
EG3 |
883 |
983 |
781 |
1306 |
1550 |
76% |
|
EG4 |
1749 |
1736 |
1468 |
2047 |
2323 |
33% |
|
EG5 |
2159 |
2225 |
1656 |
1934 |
2019 |
-6% |
|
EG6 |
1896 |
1810 |
1286 |
1328 |
1412 |
-26% |
|
EG7 |
228 |
253 |
165 |
168 |
164 |
-28% |
|
EG8 |
41 |
33 |
22 |
30 |
38 |
-7% |
|
EG9 |
0 |
0 |
0 |
0 |
0 |
|
|
EG10 |
4 |
3 |
1 |
0 |
0 |
-100% |
|
EG11 |
0 |
1 |
0 |
0 |
0 |
|
|
Total |
7494 |
7527 |
6073 |
8419 |
9118 |
22% |
Note: EG9, EG10 and EG11 are not shown in the following pictures. They are salary protected levels resulting from the EG conversion in December 1987
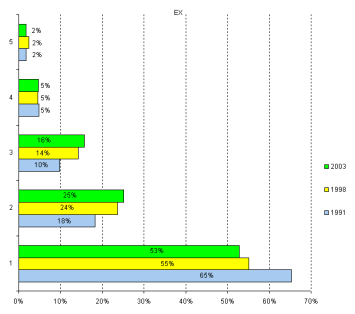
EX
|
|
1991 |
1994 |
1998 |
2001 |
2003 |
91/03 |
|
EX1 |
3193 |
2330 |
1811 |
2138 |
2581 |
-19% |
|
EX2 |
894 |
862 |
775 |
974 |
1226 |
37% |
|
EX3 |
480 |
460 |
468 |
620 |
768 |
60% |
|
EX4 |
234 |
206 |
150 |
202 |
228 |
-3% |
|
EX5 |
84 |
88 |
81 |
77 |
83 |
-1% |
|
Total |
4885 |
3946 |
3285 |
4011 |
4886 |
|
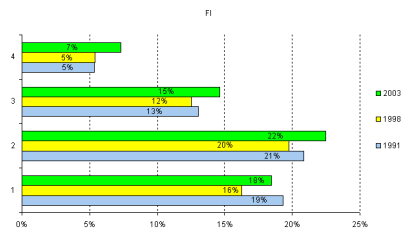
FI
|
|
1991 |
1994 |
1998 |
2001 |
2003 |
91/03 |
|
FI1 |
928 |
930 |
706 |
911 |
996 |
7% |
|
FI2 |
1002 |
961 |
856 |
1037 |
1213 |
21% |
|
FI3 |
626 |
650 |
541 |
661 |
788 |
26% |
|
FI4 |
257 |
292 |
233 |
319 |
394 |
54% |
|
|
4804 |
4827 |
4334 |
4929 |
5394 |
109% |
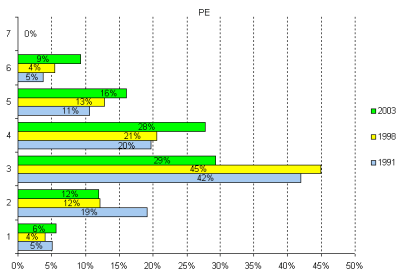
PE
|
|
1991 |
1994 |
1998 |
2001 |
2003 |
91/03 |
|
PE1 |
163 |
126 |
117 |
231 |
238 |
46% |
|
PE2 |
617 |
567 |
352 |
449 |
503 |
-18% |
|
PE3 |
1356 |
1424 |
1301 |
1210 |
1233 |
-9% |
|
PE4 |
635 |
692 |
596 |
883 |
1166 |
84% |
|
PE5 |
342 |
394 |
371 |
536 |
677 |
98% |
|
PE6 |
119 |
142 |
159 |
311 |
391 |
229% |
|
PE7 |
0 |
2 |
1 |
2 |
2 |
|
|
|
3232 |
3347 |
2897 |
3622 |
4210 |
30% |
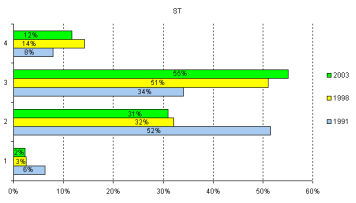
ST
|
|
1991 |
1994 |
1998 |
2001 |
2003 |
91/03 |
|
ST1 |
824 |
448 |
145 |
88 |
52 |
-94% |
|
ST2 |
6761 |
4589 |
1812 |
1102 |
709 |
-90% |
|
ST3 |
4466 |
4004 |
2884 |
2261 |
1262 |
-72% |
|
ST4 |
1043 |
957 |
803 |
537 |
268 |
-74% |
|
ST5 |
21 |
0 |
0 |
0 |
0 |
-100% |
|
ST6 |
1 |
0 |
0 |
0 |
0 |
-100% |
|
Total |
13116 |
9998 |
5644 |
3988 |
2291 |
-83% |
ST5 and ST 6 levels are not shown in the following charts
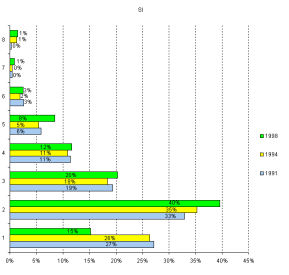
SI
|
|
1991 |
1994 |
1998 |
2001 |
2003 |
91/03 |
|
SI1 |
692 |
705 |
736 |
689 |
566 |
-18% |
|
SI2 |
839 |
816 |
984 |
1212 |
1475 |
76% |
|
SI3 |
494 |
490 |
514 |
689 |
756 |
53% |
|
SI4 |
291 |
317 |
305 |
425 |
435 |
49% |
|
SI5 |
150 |
121 |
153 |
250 |
316 |
111% |
|
SI6 |
65 |
73 |
54 |
87 |
95 |
46% |
|
SI7 |
10 |
14 |
13 |
10 |
32 |
220% |
|
SI8 |
7 |
29 |
36 |
45 |
55 |
686% |
|
Total |
2548 |
2565 |
2795 |
3407 |
3730 |
46% |
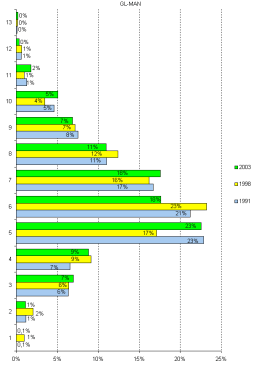
GL-MAN
|
|
1991 |
1994 |
1998 |
2001 |
2003 |
91/03 |
|
GLMAN1 |
1 |
9 |
13 |
0 |
1 |
0% |
|
GLMAN2 |
22 |
25 |
27 |
15 |
15 |
-32% |
|
GLMAN3 |
118 |
77 |
84 |
120 |
93 |
-21% |
|
GLMAN4 |
121 |
94 |
120 |
121 |
118 |
-2% |
|
GLMAN5 |
423 |
315 |
225 |
281 |
302 |
-29% |
|
GLMAN6 |
393 |
371 |
305 |
250 |
236 |
-40% |
|
GLMAN7 |
309 |
304 |
213 |
232 |
235 |
-24% |
|
GLMAN8 |
204 |
205 |
163 |
155 |
147 |
-28% |
|
GLMAN9 |
139 |
131 |
94 |
82 |
92 |
-34% |
|
GLMAN10 |
85 |
58 |
46 |
60 |
68 |
-20% |
|
GLMAN11 |
24 |
22 |
13 |
26 |
24 |
0% |
|
GLMAN12 |
11 |
9 |
9 |
7 |
5 |
-55% |
|
GLMAN13 |
2 |
2 |
2 |
2 |
3 |
50% |
|
Total |
1852 |
1622 |
1314 |
1351 |
1339 |
-28% |
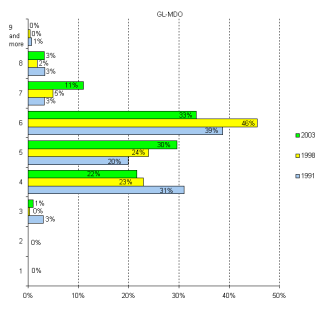
GL-MDO
|
|
1991 |
1994 |
1998 |
2001 |
2003 |
91/03 |
|
GLMDO1 |
0 |
0 |
1 |
0 |
0 |
|
|
GLMDO2 |
1 |
0 |
0 |
0 |
0 |
-100% |
|
GLMDO3 |
82 |
48 |
3 |
3 |
7 |
-91% |
|
GLMDO4 |
841 |
655 |
258 |
160 |
152 |
-82% |
|
GLMDO5 |
539 |
460 |
269 |
184 |
208 |
-61% |
|
GLMDO6 |
1047 |
849 |
513 |
234 |
235 |
-78% |
|
GLMDO7 |
88 |
66 |
56 |
84 |
77 |
-13% |
|
GLMDO8 |
90 |
84 |
21 |
26 |
23 |
-74% |
|
GLMDO9 |
7 |
5 |
2 |
0 |
0 |
-100% |
|
GLMDO10 |
7 |
4 |
3 |
2 |
0 |
-100% |
|
GLMDO11 |
6 |
2 |
0 |
0 |
0 |
-100% |
|
Total |
2708 |
2173 |
1126 |
693 |
702 |
-74% |
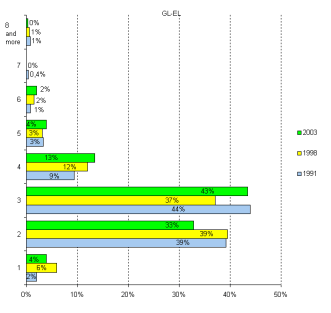
GL-EL
|
|
1991 |
1994 |
1998 |
2001 |
2003 |
91/03 |
|
GLEL1 |
47 |
32 |
66 |
48 |
29 |
-38% |
|
GLEL2 |
918 |
742 |
435 |
273 |
240 |
-74% |
|
GLEL3 |
1029 |
713 |
409 |
306 |
317 |
-69% |
|
GLEL4 |
221 |
226 |
133 |
131 |
98 |
-56% |
|
GLEL5 |
77 |
41 |
35 |
27 |
29 |
-62% |
|
GLEL6 |
20 |
26 |
17 |
21 |
15 |
-25% |
|
GLEL7 |
10 |
3 |
0 |
0 |
0 |
-100% |
|
GLEL8 |
9 |
11 |
1 |
3 |
2 |
-78% |
|
GLEL9 |
8 |
3 |
2 |
0 |
0 |
-100% |
|
GLEL10 |
1 |
5 |
2 |
0 |
0 |
-100% |
|
GLEL11 |
0 |
1 |
1 |
0 |
0 |
|
|
GLEL12 |
1 |
5 |
1 |
0 |
0 |
-100% |
| Total |
2341 |
1808 |
1102 |
809 |
730 |
-69% |
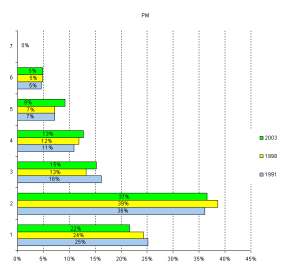
PM
|
|
1991 |
1994 |
1998 |
2001 |
2003 |
91/03 |
|
PM1 |
7 982 |
9 608 |
8 425 |
7 882 |
8 271 |
4% |
|
PM2 |
11 475 |
11 911 |
13 400 |
14 496 |
13 984 |
22% |
|
PM3 |
5 140 |
5 063 |
4 580 |
4 505 |
5 814 |
13% |
|
PM4 |
3 459 |
4 029 |
4 103 |
5 331 |
4 870 |
41% |
|
PM5 |
2 279 |
2 586 |
2 498 |
3 253 |
3 492 |
53% |
|
PM6 |
1 451 |
1 647 |
1 684 |
1 948 |
1 853 |
28% |
|
PM7 |
11 |
2 |
4 |
4 |
3 |
-73% |
|
Total |
31 797 |
34 846 |
34 694 |
37 419 |
38 287 |
20% |
