ARCHIVED - Appendices to the Expenditure Review of Federal Public Sector Compensation Policy and Comparability
 This page has been archived.
Archived Content
Information identified as archived on the Web is for reference, research or recordkeeping purposes. It has not been altered or updated after the date of archiving. Web pages that are archived on the Web are not subject to the Government of Canada Web Standards. As per the Communications Policy of the Government of Canada, you can request alternate formats on the "Contact Us" page.
Appendices to the
Expenditure Review of Federal Public Sector
Compensation Policy and Comparability
Table of Contents - Appendices
Appendices for Volume One |
|
| A | Terms of reference |
| B | Draft compensation policy |
| Salient extracts on public service compensation and comparability from the section on "Personnel Management" in the Report of the Royal Commission on Government Organization - Chapters 7 and 8 of the Glassco Commission Report | |
| D | Organizations by domain |
| E | Lexicon of names and symbols for the current and former occupational group structure in the core public service domain |
| F | List of monetary benefits (other than economic increases) negotiated between 1997 and 2003 |
| G | Analysis for selected classification groups of the distribution of employees by classification level, 1991-2003 |
| H | Summary of resolved pay equity complaints relating to the core public service domain up to 2003 |
| I | Estimated cost of pay equity settlements, 1980-2003 |
| J | Data in support of figures illustrating trends in key economic indicators |
| K | Distribution of employees by gender in the federal public service for selected years, 1981 to 2005 |
Appendices for Volume Two |
|
| Summary of population changes since 1991 in classification groups with at least 2,000 members in March 2003 | |
| M | Overview of reclassification movements within and from the Clerical and Regulatory (CR) and Economist (ES) groups, 2002-03 |
| N | Summary of leave usage in the core public service domain from 1991-92 to 2002-03, and chart summarizing changes in annual leave entitlement applying to the Clerical and Regulatory (CR) classification group |
| O | Details of sick leave and family-related leave usage for the ten classification groups with the highest usage, and the three groups with the lowest usage, 1990-91 to 2002-03 |
| P | History of employer and employee contributions to the Public Service Pension Plan, 1924-25 to 2002-03 |
| Q | History of employer and member contributions to the Canadian Forces Pension Plan, 1946-47 to 2002-03 |
| R | History of employer and member contributions to the Royal Canadian Mounted Police Pension Plan, 1949-50 to 2002-03 |
Appendix A - Terms of reference
Note Regarding the Terms of Reference
Expenditure Review of Federal Public Sector Compensation Policy and Comparability
The mandate of the Expenditure Review of Federal Public Sector Compensation Policy and Comparability is outlined in the Treasury Board Secretariat publication, The Expenditure Review Committee: A Catalyst for Modernizing Management Practices, dated March 24, 2004. The Review was undertaken with the objective of:
examining compensation within Government, as well as identifying any trends and options for managing these costs into the future. It includes comparisons with other levels of Government, the public sector in other countries, as well as comparably large private sector organizations in Canada.
***
Compensation costs the federal government well over $25 billion per year. The existing structure and levels of compensation are the result of an accumulation of collective bargaining agreements and policy decisions over many years. Although a draft compensation policy framework was prepared recently, there has been no comprehensive review in this area for decades. Accordingly, it was considered timely to include compensation as one of the new Government's horizontal management expenditure reviews.
The Review covers the six "domains" of federal compensation:
- the core public service, that part of the public service for which the Treasury Board is the employer,
- separate employers;
- the armed forces;
- the uniformed RCMP and civilian employees covered by the RCMP Act;
- federal business enterprises; and
- other groups such as judges.
The main emphasis is on the first four domains, especially the core public service and separate employers.
The components of total compensation to be considered include: salaries and wages; overtime and allowances; recruitment and retention (known as terminable) allowances; insurance and other benefits; pensions; pay equity; and various forms of leave.
Topics to be examined include:
- What are our current expenditures on compensation?
- What have been the trends since 1990?
- How do these trends, and the actual levels of public service compensation, compare with the external labour market? How can comparability be assessed?
- What compensation approaches would best encourage the public service we want for the next generation?
- What are the main issues regarding federal public sector compensation, and how could they be addressed? Examples of such issues include: regional vs. national pay rates; classification reform; equal pay for work of equal value (known as pay equity); the future of terminable allowances; the potential for rewarding skills and performance; the impact of large separate employers.
- How do other large employers (i.e. key provinces, major private companies, similar foreign governments) manage and control compensation, and what has their experience been?
- How could we introduce change into the compensation system?
Appendix B - Draft compensation policy
Table of Contents
1. The policy statement adopted by the Canada Customs and Revenue Agency (CCRA), March 2001
1. Message from the Secretary
2. Why a Compensation Policy Framework?
3. What Do We Mean by Compensation?
4. Objectives and Assessment of Results
5. The Principles of Effective Compensation
6. The Policy Making Environment: The Intersection of Employer Policy and General Public Policy
7. Approach to a Public Service Compensation Policy Framework: Balancing for the Public Interest
8. Approach to Managing the Policy Framework
9. Next Steps: Moving Consultations Forward
Appendix A – Description of Performance Indicators
Table of Figures
Figure 1: Balancing for the Public Interest: An Example 12
1. The policy statement adopted by the Canada Customs and Revenue Agency (CCRA), March 2001
Compensation in the CCRA
We are pleased to announce that the Board of Management has approved the following Compensation Policy for employees of the Canada Customs and Revenue Agency (CCRA). We are proud of this policy because it is unique and a first in the Public Service of Canada. This policy demonstrates our leadership in the public sector because it commits us to providing compensation to our employees in line with what is being provided elsewhere in the employment market.
The principles of the Compensation Policy guide our approach to collective bargaining. For example, they influenced the Board of Management decision on the AV contract that provided a special adjustment for auditors in Toronto. Studies of the Toronto market identified a gap between the CCRA level of compensation and what was being provided elsewhere in that region.
These principles also guided decisions on implementing the recommendations of the Strong Report on compensation for the executive and senior management groups at CCRA. The Strong Report provided extensive market research to support its recommendations.
The CCRA is committed to working with all its unions to look at what compensation is being provided in the outside market, and addressing those realities.
We are committed to using this policy to support fair and reasonable compensation for all employee groups.
|
Rob Wright |
Alain Jolicoeur |
CCRA Compensation Policy
As an organization, the Canada Customs and Revenue Agency provides an exemplary level of service both domestically and internationally. This high level of service is built on the foundation of a good working environment and a skilled, productive workforce that is committed to service improvement.
The CCRA must make sure it has a workforce that continues to strive for better service. Compensating our employees at a fair and reasonable level makes the CCRA an attractive employer. It is also a critical step to building a better working environment. Providing our employees with a better place to work will help us build on our already high level of service.
To ensure a better working environment and to sustain our high standards of service, the CCRA will respond to labour market realities. The ability to attract and retain qualified employees in a competitive labour market is as much a challenge for the CCRA as it is for all businesses.
The CCRA's Board of Management and management team are committed to a compensation policy that recognizes and addresses the realities of competitive labour market forces. If studies demonstrate that a significant gap exists between the CCRA's compensation and that of a competitive labour market and it can be demonstrated that this gap affects our ability to attract and retain employees, the CCRA is committed to addressing the gap.
This compensation policy will help the CCRA retain, motivate and attract the right people with the right skills to deliver the high levels of service that are expected of the CCRA.
DRAFT – July 14, 2003
2. Draft TBS Policy — Towards a Compensation Policy Framework for the Federal Public Service: Discussion Paper, July 2003
|
Discussion Paper |
1. Message from the Secretary
The Public Service of Canada is a critical national institution that has served Canadians well for generations. On a daily basis, and in communities across this country, public service employees enforce laws and regulations, ensure proper stewardship of resources, advise Ministers and provide the programs and services that Canadians want and need. In fulfilling these and other critical duties, public service employees play an essential role in preserving and promoting the high standard of living that we share in this country.
The effectiveness of the public service depends fundamentally on the quality of its people. It is critical that we continue to attract and retain talented, skilled and dedicated employees; men and women of diverse backgrounds and abilities who are united by their shared commitment to serving Canadians. With this in mind, we are moving forward with an ambitious agenda to improve the way that we manage our employees. The Public Service Modernization Act tabled in February 2003 proposes the first major amendments to the legislative framework governing human resources in over 35 years. We have also moved forward with a wide variety of non-legislative reforms designed to build a more supportive and productive workplace. Developing a framework for managing compensation is an important part of these efforts.
Compensation is a multi-faceted and complex issue, particularly within the public sector. It requires reconciling many different and competing interests in a desire to adequately recognize and reward good work, while at the same time ensuring that the public interest is being served. This is often a challenging balancing act.
This discussion paper proposes a policy framework for managing compensation more effectively. It outlines our key objectives and the general approach that the government intends to follow in negotiating or setting compensation. I hope that it will act as a catalyst for productive and ongoing dialogue on the subject.
2. Why a Compensation Policy Framework?
The government is currently undertaking a variety of measures designed to modernize the way that it manages its human resources. These legislative and non-legislative reforms are ultimately designed to ensure that the public service can continue to be a vital and productive institution, with the capacity to meet Canadians' evolving needs and expectations.
|
While no compensation policy framework will be able to tell us what our decisions should be in a particular case, a good compensation policy framework can help us to make better decisions. |
Compensation is a central component of effective management. The ability of the federal public service to attract, retain and motivate the talent we need to advise Ministers and serve Canadians depends importantly on how we compensate employees. There are many diverse and complex factors that must be taken into consideration when addressing compensation issues. Private and public sector labour market trends, internal relativity, social policy, the state of government finances, public opinion, economic conditions and union roles are among the most important elements that must be reconciled in order to achieve an appropriate approach to compensation. Over the last few decades, the government's approach to achieving this reconciliation has evolved, driven largely by the shifting needs of the day while striving to comply with legal obligations such as equal pay for work of equal value. Throughout this time, there has not been an explicit and comprehensive policy framework to guide decision making.
The government intends to adopt such a framework. This would assist in determining and implementing negotiation mandates. It would also help clarify the government's position on compensation for employees, ministers, union partners, and the public in general.
While no compensation policy framework will be able to tell us what our decisions should be in a particular case, a good compensation policy framework can help us to make better decisions. It will define the elements that must be taken into consideration; describe the risks that have to be identified, assessed and managed; and set out some guidelines for balancing the multitude of forces that are always in play. The relative weight of each factor will shift over time, leading to varying outcomes, but the consistent application of the policy framework will bring coherence, strategic focus and greater effectiveness to public service compensation decisions.
3. What Do We Mean by Compensation?
For the purpose of this discussion paper, the term “compensation” in this paper implies total compensation and covers cash and non-cash remuneration provided to an employee for services rendered, including:
- wages and salaries and other cash compensation such as bonuses;
- pensions and insurances;
- paid time off;
- allowances, such as the penalogical factor allowance; and
- programs that compensate employees for the costs of serving in difficult environments—the Isolated Posts Directives and the Foreign Service Directives, for example.
A compensation policy framework would cover the departments and other portions of the Public Service of Canada for the core public service (PSSRA 1-1), as well as the Canadian Armed Forces and the Royal Canadian Mounted Police. Separate employers such as Parks Canada Agency (PSSRA 1-2) may also find this policy framework useful.
4. Objectives and Assessment of Results
Compensation in the federal Public Service serves, within an overall HR framework, to attract, retain, motivate and renew the workforce required to deliver business results to Canadians.
The development of a compensation policy framework must take place hand-in-hand with the development of clear performance indicators. On-going evaluation following implementation will be critical to assessing the effectiveness of the policy framework and targeting areas for improvement and continued innovation.
To measure progress, however, it is not enough to focus simply on the things we do—we also need performance indicators that assess the impacts we want to achieve with the policy framework. Particular attention must be paid to assessing the degree to which the policy framework is achieving its planned results of attracting, retaining, motivating, and renewing the workforce. These performance indicators will be benchmarked against external groups in order to set a desired position and associated comfort zone.
By way of example, below are a few proposed performance indicators that could potentially relate to each of the identified objectives.
|
Potential Performance Indicators As the policy framework is developed, it will be critical to identify key performance indicators relating to each of the identified objectives that would act as flags indicating areas warranting further analysis. Baselines and benchmarks would be required for the performance indicators. Where required, breakdowns of the indicator may be analysed i.e. occupational groups, tenure, department/units, length of employment. Potential performance indicators that could relate to the respective objectives include the following and are explained further in Appendix A: Attraction
Retention
Motivation
Renewal
|
5. The Principles of Effective Compensation
As the government develops a new compensation policy framework, it will be guided by four overarching principles. Public service compensation should:
- be competitive with, but not lead, that provided for similar work in relevant labour markets;
- reflect the relative value to the employer of the work performed;
- reward performance, where appropriate and practicable, based on individual or group contributions to business results; and
- be affordable within the context of the government's commitments to provide services to Canadians, its fiscal circumstances and the state of the Canadian economy.
There are several forces influencing compensation design that are common to business, whatever the day and age, and regardless of the economic sector or geography of the employer. These can be described by the set of four principles described above. Whatever shape the public service compensation policy framework has taken over the last century, some variation of these four principles has always been recognized. A recent Conference Board survey of large private sector and public sector employers in Canada and abroad discovered that these same four principles are widely recognized by other employers in their compensation policies. Each of the principles is described below.
5.1 External Comparability
|
Public Service compensation should be competitive with, but not lead, that provided for similar work in relevant labour markets. |
The government wants compensation in the public service to be fair in relation to the outside world. This is critical, as potential recruits will look for such comparable compensation when they judge the attractiveness of a potential job. Furthermore, existing employees, and their bargaining agents, will track external markets to assure themselves that they are being paid comparably in relation to their private sector and other public sector counterparts. Finally, taxpayers will look, in the absence of a bottom line or market tests for government services, for public service compensation to be related to that of the private sector where such a market test is available.
Compensation and other economic decisions made by private sector organizations directly affect their continuity as viable enterprises. These decisions are constantly tested against the economic realities of the marketplace in which they operate. The composite of their compensation decisions most closely reflects the economic status of the Canadian economy. This marketplace reality is often remote from the public sector, but can be transmitted through the medium of private sector comparisons. This is the most appropriate way of assuring fair value to the taxpayers who support public service expenditures.
When data suggests that a group is significantly above or below market, the rate of increase in the public sector may have to exceed or lag that in the private sector until comparability is established. In such circumstances, adjustments could be misinterpreted unless every effort is made to ensure that the public is fully informed of the particular circumstances surrounding settlements.
Public service compensation must be competitive, but not lead, in the various external labour markets in which the public service competes for its employees. Depending on the occupation, these comparator markets could encompass the private sector, other public sector employers and the volunteer sector. It is often easier said than done to identify “relevant labour markets.” The federal government has structured its workforce into 29 occupational groups with the majority of whom it collectively bargains most forms of compensation.[1] Some of these groups, such as the Foreign Service (FS) group, have no counterpart in the private sector. Some groups blend together specialized streams that are distinct in the external labour market. For example, there are several kinds of engineers combined into a single occupational group in the federal public service each of which has its own labour market in the outside world. Some of the new cluster groups, such as the Health Services (HS) group, combine quite different professions in a single entity for which there is no single counterpart outside. As a result, exercising judgment over which groups have external labour markets, which organizations could serve as proxies for those markets, and which jobs in those organizations are the best comparators for public service work is a complex and often difficult process. In many cases, external comparisons are more art than science.
Once we have identified our relevant labour markets, we will select the organizations who can best serve as reasonable comparators. We will look to the private sector first as it is constantly tested against the economic realities of the marketplaceand then to other public sector employers where no private sector counterpart exists. Our external comparisons will be anchored in surveys of comparable jobs situated within these organizations—the rates they pay for their labour will be our proxy for the value set by the outside markets. Where a group has no relevant external labour market, compensation can be based on internal comparisons (see next principle) or methods of indirect comparison with jobs in the private sector (the creation of composite profiles, for example).
Smaller geographic markets can be used for comparisons where external pay data indicate significant variation from the national average, recruitment and mobility of local labour is limited, and where such a policy framework would contribute to the achievement of competitive rates of pay in the regional labour market in which it competes. However bargaining agents have pressed hard in the past to reduce existing regional rates, as they believe that jobs of the same value should be paid the same across the country.
5.1.2 Competitive Compensation
The government seeks to offer competitive compensation. “Competitive” has traditionally meant mid-market, with the federal public service neither leading nor following the private sector. As with all such targets, this is a crude goal. Compensation experts generally advise that a market difference of 10% is inconsequential—if you are within 10% of your benchmark, you are “on market.”
|
Potential Indicators As the policy framework is developed, it will be critical to identify key indicators relating to each of the identified principles. Potential indicators relating specifically to external comparability include (Appendix A):
|
Fluctuating economic and business circumstances in external markets can be quite volatile (e.g., airlines and high-tech industries). Since the public service cannot easily reduce rates of compensation when the external market falls, it makes sense to proceed cautiously in the case of “hot markets,” perhaps using temporary supplements to partially address compensation comparability concerns until it is clear whether the external increases are transient or lasting.
All external comparisons depend on data. At the moment, there are several sources of published data and sometimes custom-designed surveys are conducted. None of these sources is sufficient to the federal government's needs. Data sources must be further developed, along with the necessary analytical capability. The relevant labour markets must be further defined and tested, appropriate survey samples determined and approaches to comparing compensation levels developed.
The Public Service Modernization Act now before Parliament proposes the establishment of new compensation analysis and research services as a function of the Public Service Labour Relations Board. Assuming the legislation passes, it will be several years before the PSLRB can become a reliable source of data. In the interim, the Compensation Planning Division of Human Resources Management Office (HRMO) will internally generate data on the public service and evaluate available external data sources. This division will continue to collaborate with the Joint Compensation Advisory Committee of the National Joint Council to investigate ways to develop mutually agreed upon data sources.
5.2 Internal Relativity
|
Public service compensation should reflect the relative value to the employer of the work performed. |
Where external comparability looks for fairness in relation to the outside world, the principle of internal relativity looks for fairness among groups and levels within the public service. The objective of internal equity or relativity is to distinguish appropriate differences in the value of work measured:
- vertically between levels within an occupational group and
- horizontally among occupational groups who work together.
|
Potential Indicators Potential indicators relating specifically to internal relativity include (Appendix A):
|
Once these differences and similarities have been ascertained, they can be used as a gauge to ensure appropriate relative compensation.
The internal relative value of jobs within each occupational group and level is established through the application of group-specific, gender-neutral job evaluation plans that support departmental business needs, are capable of measuring the work performed today, treat men and women equitably, and, where appropriate, mirror the work structuring practices of comparable employers for ease of comparison of jobs with outside labour markets.
Job evaluation plans are linked through level structure to the compensation structure (or pay line) that is designed to support the business of the public service. Once a compensation structure has been fitted properly to managers' business needs through reform, its integrity must be maintained by the employer even through successive rounds of collective bargaining. However, it should be recognized that the relationship of the structure's levels to each other and to the business may change over the years. Maintaining the integrity of the system helps to preserve both the business usefulness and the internal fairness originally achieved by compensation and classification redesign.
To measure value differences and similarities horizontally among occupational groups from the employer's perspective, relationships among groups can be identified based on criteria such as accepted historical pairings, linkage through natural career paths, and other business-based elements.
For occupational groups with no clear external counterpart, this process provides links to related groups who do have one, allowing the discipline of the free marketplace to be applied across the whole of the public service.
This is also useful for understanding, in advance, the implications of a compensation increase for any group with strong relationships to other groups who will look for internal parity.
5.3 Individual and Group Performance
|
Public service compensation should reward performance, where appropriate and practicable, based on individual or group contributions to business results. |
The Government of Canada is committed to effective performance management of every one of its employees. This requires setting clear, agreed upon objectives and establishing simple indicators to measure progress towards reaching those goals. Ideally, compensation can help to promote a more results-focused workforce.
It should be noted that administration of performance measurement, management and rewards is often onerous—it requires dedicated leadership, enabling human resource systems, strong communication programs and significant investment of management time. In consequence, most employers tend to restrict such practices to those segments of their workforce where it makes strong business sense—generally executives and senior professionals. Furthermore, unions, including public service bargaining agents, have traditionally opposed this approach to compensation, as they believe that it does not correspond to their values of equality and fairness in the workplace.
In certain circumstances, better performance management should translate into performance rewards, for either individual contributions to business results or for the contributions of a collection of individuals—a work team. In such cases, performance rewards should:
|
Potential Indicators Potential indicators relating specifically to individual and group performance include (Appendix A):
|
- be designed to encourage employees to accomplish defined business results linked to corporate priorities;
- reflect the degree to which the individual or group contributes to the achievement of the defined business results; and
- reflect the degree to which the desired business results are achieved in a manner consistent with public service core values.
Of course, performance rewards are not always appropriate and practicable and must necessarily have restricted applications. They should not be introduced where the additional cost of performance measurement and management exceed the potential value created in terms of improved business results and values coherence.
5.4 Affordability
|
The cost of public service compensation must be affordable within the context of the Government's commitments to provide services to Canadians, its fiscal circumstances, and the state of the Canadian economy. |
|
Potential Indicators Potential indicators relating specifically to affordability include (Appendix A):
|
A private sector employer's ability to pay compensation is dictated by solvency requirements—if it spends too much on its workforce it may become unprofitable and ultimately may go out of business. While the government must also ensure that compensation is affordable,[2] it does not always have as clear a bottom line as its private sector counterparts do. Instead, affordability tends to be measured against the government's perception of the right level of taxation for the good of the economy (how much it can responsibly claim through taxation and other forms of revenue) and the needs of Canadians that it must serve for the economic and social health of the nation (how much of what it obtains needs to be returned to Canadians through services). The government's responsibility to Canadians is to maximize the results it delivers by prioritizing all expenditures, including public service compensation, within the limits of its ability to pay.
As noted at the outset, decisions on what constitutes the “public interest” will necessarily be influenced by elusive and evolving factors such as public opinion. This is a particular challenge faced by public sector institutions.
6. The Policy Making Environment: The Intersection of Employer Policy and General Public Policy
Government rests on public acceptance—the consent of the governed. Diverse public attitudes, wants and expectations must be reckoned with and reconciled, to produce what has been described as “equality of dissatisfaction.” The test of public acceptance lacks the comparative rationality of the market forces by which, in the main, business operations are tested.
|
External Factors Influencing Policy Making Economic Policy Objectives: policies must be consistent with economic trends and support the achievement of Government fiscal policy Legislative Framework: policies must respect existing legislative requirements Social Policy Objectives: policies must be congruent with the Government's national social policy agenda objectives Public Expectations and Pressures: Government must take into account the public will |
Since Treasury Board is both the employer of the core public service and part of the elected governing body of Canada, compensation decisions are always made at the intersection of employer policy and general public policy. This duality must be balanced in the development of our compensation policy framework.
There is a variety of pressures that impact on the government's ability to set the compensation policy framework. These pressures can occasionally limit the parameters within which decision making takes place. It is important to identify and recognize the significance of these economic, legislative and social considerations.
Macroeconomic Policy Objectives
Compensation can be used to advance macroeconomic policy objectives. Sometimes in its effort to manage the national economy, the government will set compensation levels that serve as an example to the private and other public sectors to support its economic policy objectives. At all times, the government wants its compensation settlements to be consistent with economic trends and to support the achievement of the Bank of Canada's inflation targets.
Relevant Laws
Federal legislation often binds the Treasury Board and other federal employers to certain practices. This in turn circumscribes the options open to policy makers. Provisions within the Canadian Human Right Act, for example, require equal pay for work of equal value (section 11) and gender-neutral job evaluation (section 10). The federal government has an obligation to comply with these requirements and to compensate employees fairly without discriminating according to gender.
Social Policy Objectives
Sometimes, compensation design is influenced by the government's desire either to comply with or to advance its national social policy agenda objectives. In these instances, public service compensation policy becomes an instrument of national social policy (e.g. Supplementary Unemployment Benefits plans complementing extended parental benefits under the Employment Insurance program).
Public Expectations and Pressures
The government must take into account public sentiment when it designs its policies and programs. While this does not mean that the government should “govern by polling,” it does mean that decision makers must be aware of public expectations and sensitivities and take these into account when formulating policy.
Public expectations and pressures can have a profound impact on decisions relating to compensation. On one hand, there is a tendency to not want to be seen as over-compensating public servants lest there be some sort of public backlash. For more than 50 years, for example, executive compensation has been benchmarked with the private sector only at the entry level. External comparability for more senior levels of executives has not been pursued because it has been felt that the public would not accept the levels of compensation for public service employees that are common in the private sector.
On the other hand, the public often demands that essential services, or those perceived to be essential, be maintained without interruption. This legitimate demand for continuity in the provision of public services, coupled with the absence of a bottom line or market test of appropriate compensation, can sometimes make it difficult for governments to resist settlements that might otherwise be unwarranted from the employer's perspective.
7. Approach to a Public Service Compensation Policy Framework: Balancing for the Public Interest
The government recognizes that there will always be competing pressures where compensation expenditures are concerned. There will always be, for example, a clear imperative to keep expenditures down to a prudent and affordable level. At the same time, we need to promote and safeguard the health of the public service and its ability to deliver results to Canadians through a motivated, qualified, efficient and effective workforce. A compensation policy framework needs to navigate effectively between these competing priorities.
As we move forward with the development of a compensation policy framework, we are driven by a commitment to ensure that compensation decisions are fair, and seen to be fair, to both employees and taxpayers alike. All the aforementioned principles and political pressures are important and will be considered in a systematic manner. Our approach involves a balance between the four principles. It would not allow one principle to dominate. This makes it easier for government to be flexible and to respond to unexpected eventualities such as temporary inflationary situations. It also lessens the probability that the government would need to unilaterally break a commitment to its employees. Ultimately, compensation decisions will always seek to respect and further the public interest—both what the public requires and what the public will accept.
The balancing process pivots on the employer's capacity to identify, assess and mitigate risk to the institution both in the near and the longer term. It requires careful study of the implications of compromise and using reliable data whenever possible. There are five steps in exercising judgment in these matters:
- The analysis begins with a determination of the requirements for external comparability—the bottom line discipline this principle imports from the private sector is critical to ensuring a fair deal for taxpayers and employees.
- The optimal balance of the four principles is determined before the influence of governmental and legislative pressures is taken into account. In this way, the Federal government's interest as an employer will be clear and distinct.
- No one principle is automatically preeminent; each must be weighed against the other principles and pressures.
- No matter what the balance, each principle continues to have some influence, no matter how small.
- Good governance must be respected throughout the decision-making process. Compensation matters must be debated among senior officials of the Secretariat, other central agencies and line departments, before recommendations are crafted for the consideration of Treasury Board Ministers.
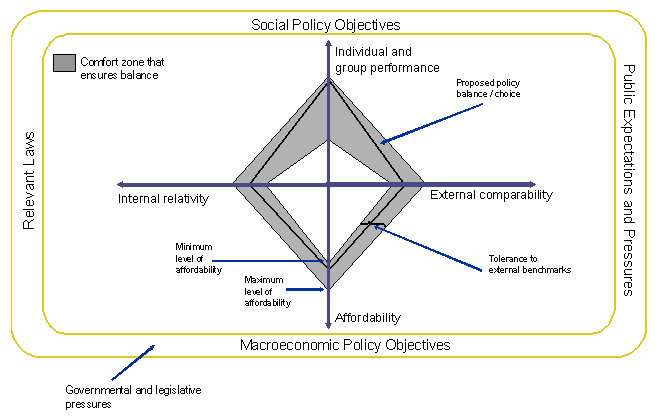
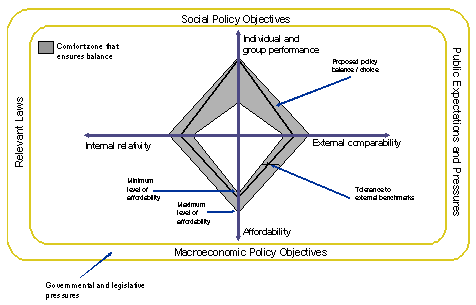
Figure 1 illustrates conceptually how each of the four principles, namely external comparability, internal relativity, affordability as well as individual and group performance, will be considered in setting compensation. It should be noted that the degree of influence may change over time. Indicators for these principles will be utilized in setting where on the continuum of influence each of the principles registers as well as their tolerance limits. This balancing process will, as noted, be subject to the influences of governmental and legislative pressure. Figure 1 illustrates this approach by showing each of the principles on the axes with examples of proposed choice and associated tolerance limits within the context of social policy objectives, public opinion and pressures, macroeconomic policy objectives and relevant laws.
Figure 1: Balancing for the Public Interest: An Example
8. Approach to Managing the Policy Framework
Once it comes into effect, the new policy will provide a general framework within which compensation decisions are made and plans are formulated. These parameters are designed to be flexible enough to encourage innovation in planning while at the same time establishing certain touchstones against which policy decisions can be weighed.
Managing the implementation of the compensation policy framework must, out of necessity, be a collaborative process and the Treasury Board Secretariat is committed to working with a range of key stakeholders. It is critical that clearly defined management structures and appropriate processes be in place before the policy framework comes into effect. This will ensure the framework's timely and effective operation.
9. Next Steps: Moving Consultations Forward
Clearly, developing the type of comprehensive policy framework proposed in this document will benefit from input from a wide variety of stakeholders over the next few months.
Several key questions arise from this document, which could act as a point of departure for discussions.
First, have we got the objectives and outcomes right?
- Will our objectives support clearer, more transparent and effective decision making?
- Can we establish measurable targets for our overall efforts? If so, what should these targets be? How will we know that we have succeeded?
Second, can the approach proposed in the policy framework (i.e. balancing the four principles at the intersection of government's role as the employer and agent of the public interest) work in practice?
- Have we adequately identified the various elements that will need to be taken into consideration during the decision making process? Are there others that will need to be “added to the mix?”
- We speak of “comfort zones.” How will these be defined? Given that people will have different interpretations of what constitutes comfort, how do we reconcile competing views?
- Have we established appropriate indicators?
Finally, do you have any views on how the policy framework can be appropriately managed?
As we move forward with the development of the policy framework, it will be critical that we can answer these and other questions effectively.
Appendix A – Description of Performance Indicators
|
Indicator |
Performance Measurement |
Strength/Weakness |
Source/Availability |
|
|
Attraction |
||||
|
Number of qualified applicants per job posting |
Number of qualified applicants per job posting |
Weakness
|
Not available |
|
|
Percentage of offers made to potential new employees that are refused |
Percentage of offers made to potential new employees that are refused |
Weakness
|
Not available |
|
|
Use of contracted labour |
Percentage of total workforce that is contracted labour |
Weakness
|
Not available |
|
|
Efficacy of recruitment process: number of days that a position is open; recruitment costs |
Number of days that a position is open; and recruitment costs |
Weakness
|
Not available |
|
|
Retention |
||||
|
Turnover rates |
Separation rates |
Strength
Weakness
|
Mobility system |
|
|
Reasons for separations from exit interviews |
Qualitative responses |
Weakness
|
Not available |
|
|
Motivation |
||||
|
Days lost to labour action |
Days lost to labour action |
Weakness
|
TBS and HRDC |
|
|
Absenteeism rates |
Days of sick leave, personal leave, family related leave and other paid leave |
|
Annually from Leave Reporting System |
|
|
Attitudinal indicators |
PS survey questions regarding job satisfaction, work motivation, compensation attitudes; results for selected questions from PS survey |
Weakness
|
Ad hoc basis only. |
|
|
Renewal |
||||
|
Voluntary non-retirement rate |
Total and percentage of retirement eligible employees who separate within first year and after 5 or more years of becoming eligible for retirement |
Strength
Weakness
|
Available from Mobility System about a month after end of fiscal year |
|
|
Retirement with penalty |
Percentage of employees 50-59 who can't retire without penalty that voluntarily separate |
Strength
Weakness
|
Available from Mobility System about a month after end of fiscal year |
|
|
Separation by tenure and length of employment |
Separation rates |
Strength
Weakness
|
Available from Mobility System about a month after end of fiscal year |
|
|
External Labour Market Comparisons |
||||
|
Occupational pay level comparisons based on rates of pay |
Comparison of job rate and average salary with external mean, median and Q3 |
Strength
Weakness
|
Annual survey from Watson Wyatt, Morneau Sobeco, Mercer, Towers Perrin and Economic Research Institute Usually available in the fall after a spring survey. The job match data from Statistics Canada will only be available in two or three years. |
|
|
Aggregate wage and salary indicators, i.e. Labour Force Survey Wage Data |
Comparison of PS average salary with that of other sectors Human Capital Model comparisons with that of other sectors |
Strength
Weakness
|
Monthly data from Statistics Canada |
|
|
Aggregate wage and salary indicators, i.e. Census Wage And Salary Data |
Comparison of PS average salary with that of other sectors Human Capital Model comparisons with that of other sectors |
Strength
Weakness
|
Data from Statistics Canada collected every 5 years and available about two years later |
|
|
Cash compensation and total compensation comparisons |
Comparison of PS average salary with the Hay Pay and Compensation Line |
Strength
Weakness
|
Annual survey from Hay available in the fall |
|
|
Compensation level comparisons |
Comparison of the increase in average salary in federal government administration to that in other sectors |
Strength
Weakness
|
Annually from Conference Board, Mercer and Watson Wyatt |
|
|
Internal Relativity |
||||
|
Compensation comparison for classification levels across occupation groups |
Comparison of pay lines or job rates for public service occupational groups or classifications |
Strength
Weakness
|
Internally once Hay has completed the evaluation; updated as required |
|
|
Compensation comparison for classification levels across occupation groups |
Comparison of pay lines or job rates for public service occupational groups or classifications |
Strength
Weakness
|
UCS |
|
|
Measures of compression and inversion to indicate potential staffing problems for executive and management positions |
Ratio of maximum pay rates within an occupational group |
Strength
Weakness
|
Internal pay files |
|
|
Performance Related Compensation |
||||
|
Performance pay and variable pay as a percentage of salary and compensation expenditure |
Performance and other merit based pay as a percentage of straight time payroll and compensation expenditure |
Strength
Weakness
|
Available from Entitlements and Deductions Information System about one month after end of fiscal year |
|
|
Percentage of employees covered under performance, merit and other variable pay measures |
Number of employees receiving performance bonus, merit pay and other performance based allowances and premiums as a percentage of PS employment |
Strength
Weakness
|
Available from Entitlements and Deductions Information System about one month after end of fiscal year |
|
|
Distribution of awards between high and low performance |
Frequency distribution of performance-related compensation by employee amount |
Weakness
|
Not currently available |
|
|
Percentage of employees of adversely affected by poor performance |
Number of employees denied an increment or rejected on probation for a promotion |
Weakness
|
Not currently available |
|
|
Affordability |
||||
|
Government debt and deficit as percentage of GDP |
Debt and deficit as a percentage of GDP |
Strength
Weakness
|
Finance Canada |
|
|
Compensation expenditure as a percentage of GDP, labour income and government program expenditure |
Compensation expenditure as a percentage of GDP, Labour Income and government program expenditure |
Strength
Weakness
|
Public Accounts and Statistics Canada |
|
Footnotes
[1] With the exception of minor changes of mutual benefit to the Employer and bargaining agents, the current occupational group structure will most likely endure.
[2] The Public Service Modernization Act under consideration before Parliament contains a section (148(e)), which instructs any Arbitration Board, when making an arbitral award, to consider "the state of the Canadian economy and the Government of Canada's fiscal circumstances."
Appendix C
Salient extracts on public service compensation and comparability from the section on "Personnel Management" in the Report of the Royal Commission on Government Organization – Chapters 7 and 8 of the Glassco Commission Report, 1963
7
COMPENSATION IN THE PUBLIC SERVICE -
COMPARISONS WITH OUTSIDE EMPLOYMENT
WAGE AND SALARY LEVEL COMPARISONS POLICY, PRACTICE AND STANDARDS
1 Wage comparisons were made between civil service and outside employment by a detailed analysis of: pay levels and the structure of pay in the public service; outside employment data contained in surveys of the Pay Research Bureau, Department of Labour and published reports of the Dominion Bureau of Statistics; private wage surveys; unpublished records and files; the Royal Commission's surveys and interview material. Most comparisons were founded on data reflecting the pay situation at September, 1960 and the comparisons now reported are almost entirely with respect to rates for jobs classified under the Civil Service Act. Some summary observations about the levels of wages and salaries for prevailing rate jobs, Crown corporation positions, and other exempt categories are made later in this chapter.
2 The task of making appropriate comparisons was difficult because of the complex classification system for the civil service, with its 887 classes and 1,827 grades. In some areas, precise statistical data available for compari�sons were scanty, an example being rates of pay for administrative and executive personnel.
Office Occupations (Clerical, Secretarial, and Related)
3 Rates for almost all office occupations at the recruiting level are at least comparable to outside market rates.
4 Comparisons for senior level office jobs are less reliable, mainly due to the greater difficulties encountered in assessing the duties performed. However, available information indicates that civil service rates lag behind the industrial sector for more senior office positions.
5 A large proportion of the civil servants in office classifications is employed in Ottawa and in fifteen other metropolitan areas. Because civil service rates compare favourably, in the main, with industry rates in these cities, civil servants in smaller centres are paid rates in excess of those prevailing in such generally lower wage areas. This premium is partly offset by the higher quality of person the civil service is able to recruit in many smaller areas.
Service and Maintenance Occupations
6 Civil service wage rates for craftsmen, trades, and for service and related jobs are less favourable than those in private industry. The nation-wide rate scale for these employees in the civil service is below average community rates in large centres, but is equal to or better than those prevailing in small communities. (Note-more than sixty per cent of employees classified in these categories work in centres with populations of less than 100,000 as against only about one-quarter of the office employees.)
7 Although the civil service rates for some service occupations (e.g., cleaning services) are well below private industry rates, they are in line with rates paid by service organizations and public institutions, normally the important employers for these and similar occupations.
Postal, Customs, and Immigration Occupations
8 Many of the postal, customs, and immigration occupations (a single group, constituting better than 20% of all employees under the Civil Service Act) have no direct counterparts in industry.
9 Indirect comparisons by the Pay Research Bureau (e.g., letter carrier vs. delivery truck driver and meter reader; customs excise officer vs. police constable) suggest that civil service rates for junior occupations approximate outside employment pay levels.
10 Although indirect comparisons such as these suggest that for senior positions in this group (e.g. higher grades of customs officers) rates of pay in the civil service are lower than outside rates, several factors favour the civil service jobs. For example, policemen in some communities work in excess of the forty hours per week which is standard for the civil servant; and customs officers and immigration officers are often recruited and employed in small population centres where average incomes are relatively low.
11 Over forty per cent of all employees in occupations peculiar to the postal, customs and immigration services are located in centres with populations of less than 100,000. As a consequence, although rates for these occupations cause some difficulty in recruiting and retaining staff in the larger, higher wage areas, most of the wage rates for these occupations are in line with or better than rates for similar occupations in smaller communities.
Technical (Sub-Professional) Occupations
12 Because of the "catch-all" character of the classes and grades in which many of the technical employees in the civil service are classified, information for making wage comparisons is very sketchy. As an example, the Technical Officer class, originally set up to deal with sub-professional occupations of a technical nature, now encompasses a wide variety of occupations, including some of a professional and some of a clerical nature. Many of these appear to be improperly classified. These groups should be appropriately reclassified and the technical classes properly reorganized because a strong future demand for employees in the technical classes is assured.
Professional Occupations
13 There is far less regional variation in professional salaries than in wage and salary levels for office and for non-office service and maintenance jobs. The market and the salary level tend to be country-wide.
14 For professionals such as engineers and, to a lesser extent, geologists, scientists, economists and statisticians, active competition from industry for personnel tends to set salary levels. The federal government has extensive needs in these areas and has had to ensure that civil service rates are competitive in order to recruit and retain suitable employees.
15 Demand in the outside market for a large group of professionals comes mainly from institutions which traditionally offer somewhat depressed salaries. Included are occupations such as librarians, social workers and dieticians. Here the tendency is for the government to be a wage leader, partly to assure itsclf of an adequate supply of such personnel and also to maintain proper relativity between their pay rates and those for other professions employed in the civil service.
16 For a third group of professionals, the outside market is either non-existent or so small as to be dominated by federal government employment. Certain agricultural science occupations fall into this group. There is some tendency for civil service rates for these professional occupations to lag relative to other occupations. This is reflected less in starting rates than in the relative speed of salary advancement on the job.
I7 PROFESSIONS IN STRONG MARKET DEMAND. For these, civil service rates at recruiting levels are as good as or slightly better than private industry rates. This ensures an adequate number of recruits but fails to provide, as industry does, the pay flexibility required to obtain recruits of exceptional talent. The majority of professionals in the civil service advance to the "working level" jobs (usually grade 3) but many may remain there for the balance of their careers. IT is at this level that government wage rates compare least favourably with the industrial average, being usually below those in the private sector by three to six per cent for most occupations. Advancement to the supervisory and senior levels in the professional classes is limited to a few, with rates approximating industry averages. The system lacks elasticity to assure retention of the better-than-average professional. At the most senior levels, government rates fall below the competitive average, (e.g., engineers and economists), thus making it more difficult for the civil service to retain outstanding professionals.
18 Competition from universities and from private industry tends to limit the number of better employees available to the federal government. Increasingly, the competition from other levels of government will also be felt. In a few cases, municipal governments already offer higher pay for some professional posts than does the federal government. Moreover senior professionals in the public service may seek administrative posts to get better salaries, thus further draining top talent from the professional groups in the civil service. An additional point of interest is that a smaller proportion of civil service engineers reach the most senior level (Engineer 7) than is the case in outside industry. Only twenty-one or 1.8% of the total civil service engineers grades 1 to 7 inclusive are in the grade 7 level, compared to 2.4% in industry as indicated by the Pay Research Bureau survey, or 3.7% as reported by the Professional Engineers Association.
19 In summary, while civil servants in these professions are paid at rates equal to or slightly better than the average in industry at the beginning or recruiting levels, they tend to fall behind their counterparts in industry as they advance up the professional work ladder.
20 PROFESSIONS IN WEAK MARKET DEMAND. In these, civil service rates at recruiting level are sometimes well above the outside market rate for many professional occupations (e.g., social workers). However, pay rates for professionals at the supervisory or the "working" level are considerably below those paid outside, although required formal academic training and qualifications may be similar. The government has taken some lead in establishing higher rates for these classes, but there is a limit beyond which it cannot go without upsetting market rates important to some public institutions which must compete with the federal government for staff. On the other hand, the long-run supply of competent personnel in these occupations will become limited if pay rates are not attractive and career earnings, prospects do not reasonably compare with those for professions in more active demand.
21 PROFESSIONS WITH LITTLE MARKET DEMAND. Civil service pay ranges for these professions, from the recruiting level through to working levels, are the same as those for civil service jobs in professions which are in strong market demand.
22 Although pay ranges compare favourably, the average civil servant in these occupations does not reach his career earnings, potential as rapidly as those in the professions which are in strong market demand. For example, maturity curves (showing mean rates by year of bachelor graduation) indicate that forestry officers and research officers (Agriculture) in the civil service earn less money than their counterparts in engineering classes.
23 It is of importance that career earnings in these professions should compare favourably with others in strong market demand in order that the government may have an adequate long-run supply of such personnel, many of whom are vital to the nation's productivity.
Administrative Occupations
24 Wage comparisons for these occupations must be established with some reservation because the present classification system makes difficult the selection of key jobs for comparative purposes and because outside survey data are limited. Up to the level of $12,500 annually, civil service rates of pay for administrative jobs appear to be roughly in line with industry rates. The marked compression between salary ranges above $12,500 in the public service leaves no doubt that most senior administrative occupations are paid at rates well below those in industry.
25 Income tax statistics for the 1958 tax year point up the disparities between senior civil servants' salaries as compared to their counterparts in private industry:
|
|
Per cent of Total Employees |
|
|
Income Group |
Taxable
Federal |
Taxable |
|
($000) |
% |
% |
|
10-14.9 |
0.7 |
1.2 |
|
15-19.9 |
0.1 |
0.4 |
|
20-24.9 |
0.03 |
0.1 |
|
25+ |
0.02 |
0.2 |
|
|
|
|
|
Total – Over $10,000 |
0.85% |
1.9% |
General Observations
26 Wage and salary rates for the lower grade positions in the civil service are in general equal to, or better than, those for comparable jobs in private industry. Some disparities appear in salary rates for jobs above these levels, most markedly in senior administrative and professional posts, where the government is at a marked monetary disadvantage in competition with private industry.
- Rates for each civil service occupational class are in general competitive with the private sector at the recruiting level and usually continue to be up to the "working" level. In a number of areas, however, civil service rates above the "working" level tend to lag behind the industrial sector.
- Over the past decade wage increases for civil servants have paralleled those in the private sector, although adjustments have lagged about two years behind those in industry.
- Between 1939 and 1951, on the other hand, wage increases in the civil service were smaller than those in the private sector. Two factors had an important bearing on this picture: (a) with the increase during this period in the social and economic status of the non-office wage earner, it was inevitable that the civil service, as a predominately white-collar group, should undergo a decline in relative economic position; (b) civil servants entered the war period in a relatively well-paid position because their wage and salary levels were not reduced during the depression to the same extent as those in the private sector. It is only in the last decade that increases comparable to those in the private sector have been necessary to retain parity with the outside market.
- Flexibility in their compensation policies and better methods of salary administration place outside employers in a better position than the civil service to attract and retain the better-than-average employee.
- The civil service follows a policy of uniform, country-wide rates for each job but sizeable geographic rate differentials are found in private industry, particularly in clerical and non-office wage jobs. Because of the use of a standard or national pay policy, a substantial number of civil servants (the proportion varies from one classification to another) are paid in excess of their counterparts in the same community. The reverse applies for employees in a few classifications in high wage localities. Lacking flexibility to adjust to local pay levels, the civil service has in many cases pay rates which are above community rates in some centres, below community rates in others.
- As a result, on one hand, of a fairly rigid ceiling at the top (perhaps, influenced by the level of ministers' salaries) and, on the other, upward adjustments in pay levels at the bottom forced by recruiting competition, there has been a serious narrowing of the salary differential between senior civil servants and those in the middle and lower ranks. Differentials in the private sector have been increasing, thereby accentuating this compression problem.
- Government salaries tend to be more stable than those in private industry, although stability has been growing in the private sector in recent years, thus gradually eliminating an attraction the public service once had.
- Although in Crown corporations senior executive salaries tend to be somewhat higher, there are few serious pay disparities between civil servants and their counterparts in the corporations. Greater flexibility in rate setting and salary administration does provide the exempt agencies with certain advantages in securing and retaining above-average personnel.
- Because "prevailing rate" employees are paid on the basis of going rates in the communities in which they work, while civil servants are paid at uniform, countrywide rates, there are often pay discrepancies between public servants doing comparable work in the same areas.
EMPLOYEE BENEFITS: COMPARISONS WITH OUTSIDE EMPLOYMENT
27 Benefit plans for the public service are, in general, more favourable to government employees than those found in most private industries. Two facts, however, have to be kept in mind. First, the private sector of the economy has generally been narrowing the gap during the last two decades. Second, some large employers now offer a benefit package almost as good as that offered in the public service, and a few provide some benefits that are more attractive.
28 The biggest attraction of the public service plans is the provision for pensions. In fact, the superannuation plan of the civil service is so generous as to be an obstacle in the way of desirable changes in the total benefits package. The emphasis upon pensions is so disproportionate as to raise questions about the suitability of the total benefits package to the needs of some employee groups - younger employees with dependents for instance.
29 Public service employee benefits are more attractive than those of private industry in two other important respects. Security of tenure is generally better in government service than elsewhere. However, particularly for technical, professional and other types of manpower in strong market demand, this advantage has been greatly reduced as in�dustry has come to offer comparable security to such personnel. Leave entitlement of various kinds in the public service is also generally more generous than that usually found in private employment. In other bene�fits and in working conditions, the public service and private industry tend to balance out.
30 Apart from some differences between the civil service and various exempt groups, employee benefits in the public service are generally identical for all levels of personnel. In the private sector of the economy, it is fairly common to find considerable differentiation between the benefits offered to senior level personnel and all other employees. The result is that the over-all benefits for non-office wage earners and clerical personnel in the public service tend to be more generous than those for similar groups in industry. On the other hand, benefits provided for senior level professional and administrative public servants do not match those available to senior personnel in industry.
31 The extent to which important employee benefits programmes for the public service go beyond those in outside employment seems to be due to the lack of any over-all concept of total remuneration (wages plus employees benefits) as a guide to the development of an employee benefit policy for the public service. It owes something too, no doubt, to the absence of proper costing of public service benefits plans and to the neglect of such costing as an element in benefits policy decisions.
32 Employee benefits plans in the public service are so complicated that many public servants, as well as potential recruits, fail to recognize their value. No adequately effective means exist for informing public service employees of the nature and value of these benefits.
Civil Service and Industry*
33 LEAVE PROVISIONS:
- Statutory Holidays. The ten statutory holidays granted to civil servants represent an advantage over industry where the great majority of employees are granted eight or nine statutory holidays.
- Annual Leave (Vacations). The civil service entitlement of three weeks (fifteen working days) from the
start of employment differs from the general industrial practice of granting leave graduated with length of service
(one or two weeks after one year of service, rising to three weeks' vacation after from five to fifteen years of
service and, in a few cases, to four weeks' vacation after twenty or twenty-five years of service). The civil
servant receives more vacation during the first years of employment but the total leave granted over the entire career
is now in line with industrial practice.
The recent provision of an additional week of annual vacation after twenty or twenty-five years of service replaces furlough leave which allowed twenty-five (working) days off in one continuous period after twenty years' service. - Sick Leave. Sick leave in the civil service accumulates at the same rate as annual leave, that
is, one and one-quarter days for each month (fifteen working days per year) but leave commences with the first month
of employment rather than the seventh month. Sick leave credits may be carried over from year to year with no
limit to the amount which may be accumulated.
In industry, protection against the loss of earnings due to illness is in the form of paid sick leave, sickness indemnity plans or, in the case of some office workers, a combination of sickness indemnity and paid sick leave. Civil servants are more favoorably treated than most office employees in industry. Civil servants are much more favourably treated than most non-office employees outside the public service who are covered by sickness indemnity plans.
*Material for this section is based on an employee benefit survey of the Pay Research Bureau and other published and unpublished data. The description of the provisions for the public service incorporates the changes made by the new regulations issued in conjunction with the revised Civil Service Act of 1961.
While a majority of outside office employees are covered by sick leave plans, the civil servant plan has several features which make it distinctly more generous than the normal pattern. The formal spelling out of rights, the absence of a waiting period, and the unlimited accumulation of unused sick leave make the plan decidedly more liberal. This advantage is less apparent over brief periods of service, since informal provisions for granting short periods of sick leave are fairly common in industry. The provision that sick leave is with full pay goes beyond what is available to large numbers of office employees in industry, who are granted part of their sick leave at less than full pay.
Industry plans for non-office employees commonly provide fifty to seventy-five per cent of earnings after a waiting period, with maximum periods for coverage considerably less than the maximum sick leave credits available to civil servants when accumulations are added. Here again civil servants are much more favourably treated. - Retiring Leave. When civil servants leave the service for any reason other than dismissal,
resignation or abandonment of position they may be granted retiring leave provided they have been employed for not
less than four years. The period of retiring leave is equal to one week for each year of service, to a maximum of 26
weeks. Employees who retire on pension may request a gratuity in lieu of retiring leave. The gratuity is equal
to the difference between the weekly rate of pay on retirement and the amount of the pension for the number of weeks
of retiring leave to which they are entitled. Employees who resign after four years of service may receive a
gratuity equal to one-half week's pay for each year of service, to a maximum of thirteen weeks' pay. This
gratuity could be regarded as a form of severance pay to the extent that it is granted on separation for reasons other
than retirement.
These retirement leave provisions give civil servants a benefit which goes well beyond normal practice in the private sector. Formal severance pay or retirement leave plans providing up to six months' pay are rare in industry, although they are increasing. Non-office employees in industry, where they receive severance pay, usually receive cash in amounts smaller than the value of civil service retiring leave. Retiring leave in the civil service, for employees who retire because of age or ill health, has almost no counterpart in industrial severance pay plans. - Furlough or Long Service Leave. For some, who had earned the privilege prior to the coming into
force of the new regulations, twenty-five days of furlough leave can still be granted, but this privilege will
disappear as older employees take up their options or retire.
Furlough leave, as such, is rarely encountered in industry. Graduated vacations providing for a fourth week of vacation after a specified period of service, usually twenty or twenty-five years, are now becoming more common in industry. If furlough leave is regarded as a component of the vacation plan, the effect in total is to give some advantage to civil servants over long periods of service. If furlough leave is regarded as a form of recognition for long service, rather than as a component of the vacation plan, it represents a decided advantage for civil servants. The small number of employees in industry who are granted comparable long service leave, according to a formal plan, usually become eligible only after twenty-five years' service. - Special (i.e. Personal)Leave. As the term implies, this form of leave is for special purposes, such as
death or illness in the immediate family, quarantine, marriage, and the like. Civil servants accumulate a half
day special leave credit for each month of continuous employment. Unused special leave credits may be carried over
from year to year, up to a maximum accumulation of twenty-five days. Although an employee may have acquired the
maximum credits, special leave as a rule is granted only for short periods. Court leave (jury duty and witness)
is granted with pay but is not a charge to special leave.
It is difficult to assess the relative position of civil servants and office employees in industry in terms of paid leave granted for personal reasons. The provision of special leave in accordance with a formal plan and the accumulation of special leave credits are not common in industry. Office employees in industry are often granted leave for personal reasons on either a formal or an informal basis, but this practice is much less common for non-office employees in industry.
Leave is commonly granted in the event of death in the family and for jury duty for both office and non-office employees in the private sector. Such leave is granted with pay, on a. formal or informal basis, to a majority of office employees but not commonly for non-office employees. Paid leave in the event of marriage is granted to a majority of office employees in industry, often on an informal basis, but rarely to non-office employees. - Educational Leave. The provisions for educational leave which were a part of the old regulations have
not been carried forward into the newly revised regulations. Under the old arrangements educational leave was
granted, provided that satisfactory arrangements could be made for the continuance of an employee's work during his
absence. Frequently, leave for educational purposes was granted on the basis of leave without pay, but, in
certain cases, leave with pay was granted to take a short course which would definitely increase the employee's
usefulness to his department. Leave with half pay was granted to assist an employee to do post-graduate work of
special interest to his department. All requests for educational leave had to be recommended by the deputy
minister of the department concerned and reviewed by the Civil Service Commission.*
Outside practice on educational leave is usually not formally spelled out but it would appear that the public service is on balance more liberal. - Accident or "Duty" Leave. Civil servants injured in the performance of their duties through
no fault or negligence of their own may be granted leave of absence with pay without deduction from sick leave
credits, provided that satisfactory medical evidence is furnished. Injury or duty leave has the effect of
ensuring that classified civil servants receive full salary rather than the percentage of earnings up to specified
limits provided by Provincial Workmen's Compensation Acts. These provisions are more generous than normal
industrial practice.
The compensation for medical treatment received by an employee and the pension or other payment provided to his dependant in the event of his death is determined by the provision of the Workmen's Compensation Act of the province in which he is usually employed.
(*The new regulations provide only for educational leave without pay, granted at the discretion of the deputy minister.) - Maternity Leave. Maternity leave rules in industry and the employee's eligibility for re-employment are comparable to existing civil service practice. Maternity leave without pay is granted by about one-half of industrial employers, often on an informal basis.
34 INSURANCE PROVISIONS:
- Supplementary Death Benefit (Group Life Insurance). The Public Service Superannuation Act provides a
supplementary death benefit which can best be compared with the group life insurance plans which are common in
industry. The Act provides for death benefits based on salary up to a maximum of $5,000. Employees pay 10
cents a month for every $250 of coverage. After employees reach the age of sixty, benefits decline by ten per
cent each year and at age seventy (unless still employed in the public service) employees are no longer insured under
the plan (except for a basic benefit of $500 under certain circumstances).
This equivalent of group life insurance for civil servants is in keeping with industrial practice, but the amount of the employer contribution in industry is normally at least fifty per cent whereas the government's share of the cost is considerably smaller. Formulae for establishing maximum individual coverage vary widely in industry but many office employees participate in plans providing coverage at least equal to their annual earnings. Post-retirement coverage and total and permanent disability are provided for in many industrial group life insurance plans. On balance, the supplementary death benefit for civil servants is less favourable than equivalent group life insurance plans commonly available in industry.
The supplementary death benefits in the public service should, however, be viewed together with the survivorship provision in the Public Service Superannuation Act. If an employee covered by this Act dies, either before or after retirement, his widow receives fifty per cent of the employee's pension entitlement at the time of death. The survivorship benefit is further increased for each dependent child to a maximum of ninety per cent of the employee's pension entitlement at the time of death. Survivorship benefits are also paid to orphaned children. These provisions go far beyond anything normally available to employees outside the public service. - Hospital Insurance. Civil servants are in the same position as a great majority of employees in industry who are required to pay premiums for provincial basic hospital insurance plans. The position of civil servants is less favourable than about one-half of employees in industry who are covered by supplementary hospital insurance plans under which the employer contributes at least one-half of the cost of premiums.
- Group Surgical-Medical lnsurance. The position of civil servants is comparable to a great majority of employees in industry who are eligible to participate in group surgical-medical insurance plans covering themselves and their dependants. Under these plans the employer contributes at least one-half of the cost of premiums. The major medical expense provision in the public service plan is comparable to those commonly found in industry.
35 PENSION PLAN. The pension plan for the public service represents a substantial advantage in relation to the plans available to employees in industry. While most employees in medium and large firms are covered by pension plans, the Public Service Superannuation Act provides a number of advantages:
- Participation-is automatic, whereas eligibility provisions in many industrial plans specify age or length of service.
- After an employee has made contributions for thirty-five years he ceases to make payments into the plan, whereas almost all industrial plans require contributions up to the date of retirement.
- The pension formula provides two per cent of earnings for each year of service whereas a majority of industrial unit benefit plans have a less generous benefit formula. The earnings' base under the public service plan is the employee's earnings averaged over the best six years of service, thus yielding much higher pensions than would the same percentage of average career earnings. Few employees in industry have pensions calculated against the best years of average earnings. The earnings' base period under the Superannuation Act was changed recently from the "best 10 years" to the "best 6 years," a distinct sweetening of the pension plan, with an accompanying increase in its cost to the government.
- Survivors' benefits under the public service plan are significantly more generous than the great majority of industrial plans. On the death of the husband, the wife receives 50% of the husband's pension plus 10% for each child up to a maximum of 90% of the pension. The pension ceases if she remarries, but is restored should she again become a widow.
- The provision under the public service plan for immediate annuities, without discount for age, in the event of disability, is significantly more generous than those found in most industrial plans.
- There is full vesting of pension rights after five years' service, accrued rights being granted in the form of deferred annuities.
36 The rate of employee contribution (6 1/2% of earnings for men and 5% for women) under the public service plan is significantly higher than the most common rate, 5% of earnings, found in industrial plans. This is offset, however, by the provision for cessation of contributions after thirty-five years of contributory service. From the standpoint of the employer, the government, this is an extremely costly pension plan. Its costs and actuarial aspects are reviewed in another report of your Commissioners.
37 WORKING CONDITIONS AND OTHER BENEFITS:
- Hours of Work. The standard work week in the civil service for administrative, professional, technical
and clerical employees is a five-day, 37 1/2 hour week. Clerical staff in departments employing service and
maintenance personnel also work a five-day, 37 1/2 hour week. Service and maintenance employees, hospital staff and
operating employees in the postal, customs and immigration services, work a five-day, 40-hour week. A limited
number of employees - fire fighters and lightkeepers - work more than 40 hours per week. Some employees in
customs, immigration and other services may be required to work hours which do not conform to the five-day, 40-hour
week.
Civil service hours of work are in line with majority practice in commerce and industry. For example, in Canadian manufacturing, 70% of office employees are on a 37 1/2 hour week while 70% of plant workers are on a 40-hour week. - Overtime Compensation.The civil service practice of compensating office employees for overtime work by
time off (on a straight-time basis) does not parallel industry practice for the majority of office employees, for whom
overtime compensation is in cash at rates equal to one or one and one-half times the normal rate. On the other
hand, overtime compensation for operating employees in the civil service is in line with industrial practice.
Meal allowances are not paid in the public service. No time or other travel allowances are paid to public servants required to work overtime. Such allowances are frequently provided for in the private sector. - Paid Rest Periods ("Coffee Breaks"). The civil service position on this matter is difficult
to assess since there is no formal policy and practices consequently vary between departments and units within
departments. Nevertheless, the informal method of granting paid rest periods (coffee breaks) to civil servants
appears to be roughly comparable to the practices affecting about one-half of office employees in industry.
Non-office employees in industry are granted paid rest periods on a more formal basis.
The practice in some parts of the civil service is for employees to go to cafeterias for coffee breaks. Such arrangements are as open to abuse and as difficult to control in industry as in the public service. With many large outside employers an increasingly common practice is to bring coffee to the desks of employees by means of carts. If introduced in government offices, the practice should bring substantial reduction in time lost. - Unemployment Insurance. Classified civil servants who earn more than $5,460 per annum do not contribute to the Unemployment Insurance Fund. After two years of service, contributions cease for any employee if the department certifies that he is expected to be employed for an indefinite period.
- Workmen's Compensation. Provincial laws governing payment of compensation to persons who are killed or injured or who contract an industrial disease in the course of their duties do not apply to employees of the Government of Canada. However, the Government Employees' Compensation Act provides similar compensation, and on the scale provided for by the Workmen's Compensation Act of the province in which the employee is usually employed.
- Pay Supplements: Shift Differentials. As a general rule, shift differentials are not paid in the civil
service. There are, however, two exceptions to this rule. Employees of the Post Office Department who are
required to work on either the evening or night shifts are paid a shift differential at the rate of 15 cents per hour
for each night hour worked. A number of employees of the Department of Public Printing and Stationery, who work
in conjunction with prevailing rate staff in the printing trades, also receive a shift differential if they work on
the regular night shift. The shift differential is 32 cents per hour, equal to the shift differential
established for the prevailing rate printers.
Incentive Pay. The class of Senior Transcriber in the civil service represents a form of incentive pay in the stenographic-typing field. Stenographers, typists and machine transcribers (mainly in pools) are paid a single premium rate on reaching and maintaining, for a designated period, productivity standards established for the three grades of senior transcriber. These standards are based on a line-count system. - Allowances. In a number of circumstances, allowances related to the duties of their positions are paid
to classified civil servants as compensation for work done beyond their normal duties. As such, they are part of the
pay structure and not properly considered as employee benefits.
Isolated post allowances of different kinds are paid to employees to compensate for the undesirable social and economic aspects of living in isolated centres. Foreign service officers on overseas assignment are eligible for a variety of special allowances, of which the most important are the basic foreign service allowances and the representation allowance. These vary with rank, marital status, and the post. Administration officers posted abroad have not received representation allowances and there has been some dissatisfaction about the disparity between the two groups. - Miscellaneous Benefits and Working Conditions. There are a number of miscellaneous benefits and
working conditions in the civil service which have less general application than most of those outlined above:
- Flying accidents compensation.
- Leave for external training (seminars, workshops, etc.), reserve forces training, civil defence training, and attendance at scientific or professional conventions.
- Allowances in special circumstances to cover excessive transportation costs involved in getting to work.
- Comprehensive Civil Service Health Service provided to civil servants in Ottawa. A number of private companies provide more comprehensive periodic medical examinations than are available through this Health Service.
- Provision of uniforms to employees if identification by this means is necessary or desirable from the point of view of work to be performed, (e.g. Post Office, Customs and Immigration Departments).
- Memberships in associations where necessary to carry out the employee's duties or if to the department's advantage to be represented in an association.
- Some subsidization of food services in cafeterias in government buildings and in other eating facilities-although not to the same extent as in some large financial and commercial institutions.
- Travel expenses. These are more restricted and much more detailed and costly in terms of "red tape" than in the private sector.
- Comparative Disadvantage for Certain Senior Officials Regarding Special Benefits. No differentiation
is made between the benefits offered senior-level professional and administrative officials and those for all other
civil servants. By contrast, many private companies do provide additional and more generous benefits for their
senior officials. Consequently, benefit programmes for senior level civil servants compare unfavourably in
several important respects with those available to top management in many companies.
In the private sector, senior personnel are frequently entitled to life insurance coverage equivalent to two or three times their salaries; expense allowances and expense reimbursements are less restricted. There are also certain benefits widely available to industrial executives which are completely unavailable to government officials. These include:- Periodic health examinations.
- Bonuses, stock ownership and savings plans.
- After-tax compensation-e.g. deferred profit-sharing or retirement plans.
- Wide variety of special insurance benefits which have been developed as supplements to executive compensation.
- Perquisites not considered income in the tax sense.
- Opportunities for deriving income from other activities.
CIVIL SERVICE AND EXEMPT AGENCIES - BENEFITS COMPARISONS
38 A number of civil service benefit plans, but not all, apply also to most Crown corporations and other exempt agencies. The Public Service Superannuation Act (including the death benefit plan), the surgical-medical insurance plan, and the Government Employees' Compensation Act are formal benefit plans applying to a number of public agencies, boards and corporations as well as to the civil service. The usual practice is to exclude from coverage under these plans employees of the publicly-owned industrial corporations such as Polymer Corporation Limited, Canadian National Railways, and Trans-Canada Air Lines. Some of the more important exclusions from coverage in the plans mentioned above are the following:
Major Exclusions from Public Superannuation Act
Central Mortgage and Housing Corporation
Eldorado Mining and Refining Limited
Bank of Canada
Canadian Broadcasting Corporation
Polymer Corporation Limited
Canadian National Railways
Trans-Canada Air Lines
Major Exclusions from Death Benefit Plan
Canadian Arsenals Limited
Canadian Broadcasting Corporation
Canadian Overseas Telecommunication Corporation
Cornwall International Bridge Co., Ltd.
Crown Assets Disposal Corporation
Defence Construction (1951) Limited
Eldorado Mining and Refining Limited Eldorado Aviation Limited
Northern Transportation Company Limited
Polymer Corporation Limited
St. Lawrence Seaway Authority
Major Exclusions from Group Surgical-Medical Insurance Plan
Central Mortgage and Housing Corporation
Eldorado Mining and Refining Limited
St. Lawrence Seaway Authority
Atomic Energy of Canada Limited
Bank of Canada
Canadian Arsenals Limited
Canadian Broadcasting Corporation
Polymer Corporation Limited
Canadian National Railways
Trans-Canada Air Lines
Major Exclusions from Government Employees' Compensation Act
Bank of Canada
Trans-Canada Air Lines
Canadian National Railways
(None: Polymer is covered by this Act)
39 A number of the groups mentioned above as excluded from the plans in question do, however, follow voluntarily the main provisions of these benefit plans. In other benefit areas, many of the public agencies, boards and corporations closely follow civil service practice. As in the wage area, the main advantage which the exempt agencies have is a freedom to adjust benefits and conditions to meet market pressures or other special conditions and needs.
Benefits for Prevailing Rate Employees
40 Employee benefits for prevailing rate employees are somewhat less generous than those for civil servants. However, they are as good as or better than those provided for non-office employees in private industry.
41 The main differences between benefits for civil servants and those for prevailing rate employees are listed b�low:
Leave Provisions. Prevailing rate employees are granted annual leave on a graduated scale that provides five days per year up to two years' service, ten days per year for two to fourteen years' service, and fifteen days per year for fifteen years' service and over. Civil servants receive three weeks (15 working days) leave from the first full year of employment.
Nine public holidays with pay are authorized for prevailing rate employees as compared to ten for civil servants.
The rate of accumulation of sick leave credits is 7 1/2 days per year for prevailing rate employees as against 15 days per year for civil servants. Prevailing Rate Employees General Regulations also prohibit pay for the first day of absence due to illness, whereas there is no waiting period under the civil service plan.
While special leave with pay may be granted at the discretion of the deputy minister for a number of designated personal reasons, prevailing rate employees do not accumulate special leave credits as do civil servants.
Furlough leave, retiring leave, and gratuities in lieu of retiring leave are not provided for prevailing rate employees. Nor is there general provision for granting leave with pay to prevailing rate employees injured on duty. Compensation for loss of earnings is limited to the provisions of the applicable Workmen's Compensation Act. The government does not make up any part of the difference between the Workmen's Compensation Act and the employee's normal wages. Sick leave may not be granted to a prevailing rate employee eligible for indemnity under Workmen's Compensation.
Insurance Provisions. Prevailing rate employees are required to participate in the supplementary death benefit plan if, after two years of service, they have been designated as contributors to the Superannuation Plan.
When a prevailing rate employee who is not a contributor to the supplementary death benefit plan dies, after two or more years' service, his widow may be paid a gratuity equal to two months' wages.
The group surgical-medical insurance plan for the public service is available to prevailing rate employees and their dependants on terms identical to those for civil servants.
Pension Plan. Prevailing rate employees become eligible for pension coverage and other benefits under the Public Service Superannuation Act once they have been designated as contributors. Whereas civil servants become contributors and are covered automatically on appointment or after not more than a year of service, prevailing rate employees have no guarantee of being designated, regardless of service. They may be designated as contributors after two years of service (or a total period of 24 months in successive calendar years) if the employing department recommends it to the Governor in Council following review of attendance records, performance, and other factors. An estimated fifty-five percent of prevailing rate employees have been designated as contributors.
Working Conditions and Other Benefits. The hours of work for the majority of full-time prevailing rate employees are 40 hours for a 5-day week, with Saturdays and Sundays as the usual days of rest (without pay).
Prevailing rate employees may be compensated for overtime by compensatory leave or cash payment. The usual practice is to pay for overtime work. For each completed 15 minute period of time worked in excess of normal daily working hours, payment is made at one and one-half times the normal rate. If compensatory leave is granted, it is also at the rate of one and one-half times the amount of overtime worked. There are also special provisions for work done on statutory holidays and on an employee's normal day of rest.
There is no formal policy governing the granting of paid rest periods or "coffee breaks." The practice varies from one department to another and with the nature of the work. Prevailing rate employees tend to be granted rest periods to a lesser extent than are civil servants, partly because many prevailing rate employees work outside shops or offices.
Prevailing rate employees are required to contribute to the Unemployment Insurance Fund, unless they have two years' service and the employing department certifies that they are expected to be employed for an indefinite period. Prevailing rate employees earning more than $5,460 per annum are required to contribute if they do not meet the above requirements. In general, proportionately more prevailing rate employees are required to contribute than are civil servants.
The Government Employees' Compensation Act applies to prevailing rate employees as well as to civil servants. However, the regulations contain no general provision for the granting of leave for injury on duty to prevailing rate employees. The wages paid are, therefore, limited to the percentages of normal wages and the ceilings provided by the applicable Workmen's Compensation Act. Sick leave with pay may be granted to employees only for periods for which no indemnity for loss of wages is paid under the Government Employees' Compensation Act. No wages may be paid to supplement Workmen's Compensation payments where the rate of compensation is less than the employee's normal wages or where a waiting period is required by the relevant provincial Workmen's Compensation Act. Where there is no entitlement to indemnity benefits, sick leave with pay may be granted to prevailing rate employees.
Shift differentials, stand-by duty pay, and supervisory differentials are available to prevailing rate employees but not to civil servants. Prevailing rate employees are not generally engaged on shift work, however. A few employees in dry docks and in the printing trades receive extra pay for shift work. Shift workers in the printing trades receive a fifteen per cent differential over their normal rate, to a maximum of 32 cents per hour.
Employees in certain classifications, who are required to be on stand-by duty, may be compensated at the rate of 21 cents per hour of duty on any day that is a holiday with pay, at the rate of 15 cents per hour on any other day. For an emergency call-out during a period of stand-by duty, an employee is granted a minimum of three hours' pay at normal hourly rates, regardless of the numbers of hours worked.
Prevailing rate employees who perform supervisory duties may be paid a supervisory differential in multiples of 5 cents, up to 30 cents per hour, in addition to the authorized hourly rate for their trade. All proposals to pay supervisory differentials in excess of 15 cents per hour must be reviewed by the Civil Service Commission and approved by the Treasury Board.
GENERAL OBSERVATIONS
42 Benefits plans for the public service, taken as a whole, are so complex, there is such widespread lack of understanding of them, and they depart so far in many important ways from practice outside the public service that the whole situation would clearly benefit from:
- a temporary moratorium on the introduction of new benefits or significant modifications in existing plans to permit a proper over-all assessment of the existing public service benefits package;
- a detailed study of employee benefits both in and out of the public service, with particular attention to types and scales of benefits provided, their coverage, their costs, and the ways in which costs are shared between employees and employers. The purpose would be to develop an over-all benefit package for the public service appropriate both to employee needs and the patterns in the outside market;
- decision that, as a long-run goal of public service compensation policy, salaries and employee benefits should conform more closely to those prevailing in the appropri�ate labour markets of the country.
43 Employee benefit policy for the public service might be advantageously based upon the following principles:
- Acceptance of the concept of benefits as an integral part of total remuneration from the standpoint of the government's employment costs and of their attractiveness to both employees and those to be attracted to the service.
- Central policy control and co-ordination for all employee benefits. Different authorities are now
responsible for different benefit plans: the Department of Finance for superannuation and death benefits, the Civil
Service Commission for leave entitlements, the Treasury Board and the Commission for overtime regulations, and so
on. For some conditions of employment (e.g., rest periods) there is no central authority and practice often
varies from department to department.
Central policy control and co-ordination would make it clear that employee benefits and working conditions are instruments of personnel policy having the same broad objective as selection, training, classification, and direct compensation practices. It would permit central thinking by the government as employer about total remuneration and would permit some balanced thinking about the various parts of the programme, perhaps even providing some scope for informal trading and bargaining. - Reasonable balance between benefits provided and the government's contribution to their costs. Excessive expenditure on any one benefit creates difficulties in adjusting other benefits which may be more advantageous to both the employer and the employees. The public service superannuation plan is an excellent example of a benefit programme which costs the employer so much as to create difficulties in taking on added benefit costs in other areas, even though they may be desirable. For example, death benefits provided by the Superannuation Act might be achieved at less cost and more usefully (particularly for shorter service employees with important responsibilities to dependants) through greater group life insurance coverage.
- Maintenance of a pre-determined relationship with the level of employee benefits in private industry. Where public service benefits now greatly exceed normal levels outside there are formidable obstacles to reducing them, to correct the disparities. As a practical matter, it may be wiser to wait for benefits in industry to reach present public service levels, taking good care in the interval not to perpetuate the present relationships.
- Development of a benefit programme having the greatest appeal to the largest number of employees. This requires conscious avoidance by policy-making officials-generally long-service employees - of any tendency to assess the desirability of benefits programmes in terms of the interests of their own age and earnings group.
- Recognition that different benefit programmes may be appropriate to different occupational groups. Just as industrial practice suggests different wage patterns for different occupational groups, so it also suggests differences in the pattern of benefits. If it should be decided to provide uniform benefits for all classes in the public service, presumably some offsetting modification in rates relative to outside rates becomes desirable for particular occupational groups.
- Recognition of the value of simplicity in employee benefit plans. Unless the benefit programme in total and the characteristics of each benefit it provides can be understood by the employee, it may be of less employee-relations value than a simpler programme costing less. It is therefore noted that it is traditional in the public service to use complicated regulations and directives. Attempts to meet every possible contingency have led to such complexity that many employees do not understand what benefits they have. Some measure of administrative discretion would meet needs more simply and just as equitably.
- Recognition of the value of an effective programme to inform employees about benefits and their value. Employee benefit programmes are designed to meet competition in the market and to contribute to morale and productivity. Many private employers have found that informing employees of the nature and value of the benefit programmes they have is an insignificant cost item and that it contributes to satisfactory employee relations.
8
COMPENSATION: POLICY AND
AMINISTRATION
1 It is by no means easy to develop an adequate wage and salary policy for any institution, private or public. Pay determination is not amenable to any scientific or mechanistic approach. The factors involved are complex and their significance is continually changing with circumstances and market pressures. While market prices set the limits of wage policy, changing political, administrative and social influences affect the determination of a particular wage rate.
HISTORY OF PUBLIC SERVICE PAY POLICY
2 The history of modern compensation policy in the Canadian civil service dates from the report of Arthur Young and Company in 1919. Although the emphasis in this report was on classification and salary structure, the Report of Transmission declared the following principles on general pay policy:
- Rates of compensation should be uniform for the same rank.
- Rates of compensation should be relatively right for different classes. Within the same vocation, trade or profession, this relativity was to be measured by differences in duties, responsibilities, experience, knowledge and skill. in the case of classes of positions in "different fields," this means that they should bear the same relation to classes of positions in other fields that have been established in the "business world" as between the respective vocations, trades, professions and lines of work.
- The pay for each class should be equitable, that is, fair to the employee and fair to the taxpaying public.
- Fairness to the employee was defined to require that the compensation should permit him to maintain a standard of living that will make for the good of society and posterity. In the case of the lowest ranks, the compensation should be adequate to attract into the service young men and women without family responsibilities, but of a training and capacity that will enable them to become of future value to the service and to themselves.
- Fairness to the taxpaying public was defined to require:
- Compensation should not materially exceed that paid for similar services by enlightened employers in the general industrial and commercial world. Any excess over such a prevailing average is in the nature of a special subsidy with which no group should be favoured.
- Furthermore, in comparing the compensation paid in government and in business for similar services, the
relative advantages and disadvantages of employment in the two sectors should be taken into account:
- permanence and continuity of tenure
- hours of work
- holiday and sick leave
3 The next statement of salary policy dealt with the technical and professional classes. The Royal Commission on Technical and Scientific Personnel (1930) found that, although junior salaries compared favourably with the outside market, salaries for most scientific classes in the public service were substantially depressed.
4 During the depression, a number of restrictive pay policies were introduced in the civil service as well as in the private sector of the economy. In the civil service, salaries were reduced by ten per cent (Salary Deduc�tion Act, 1932), promotions were limited, statutory increases discontinued, and permanent positions which became vacant were abolished (P.C. 44/1367-June 14, 1932). With wage cuts of substantially greater magnitude in the private economy and with a restoration in the mid nineteen-thirties of one-half of the ten per cent civil service pay reduction (and the restoration of all before the decade ended), salaries in the service at the outbreak of war were in a highly favourable position relative to those in the private sector.
5 Broadly speaking, compensation policy during World War II was one of over-all restriction on increases, tempered by a variety of expedients designed to prevent gross injustice and to place the government in a reasonably competitive position for hiring the enlarged staff it required during the emergency. A cost-of-living bonus, promotions in war units, war duties supplements, and the watering-down of the classification structure, all provided some flexibility for civil service wages and salaries during the war.
6 In the immediate post-war years, the first question of pay policy involved the scale of remuneration for the higher levels of the civil service. Acting on the recommendation of the Royal Commission on Administrative Classifications in the Public Service (1946), selective increases were made in the salaries of various deputy ministers and other senior officials. During this period, too, the cost-of-living bonus, introduced during the war, was incorporated into the salary structure of the service.
7 The then Prime Minister, the Right Honourable Louis St. Laurent, in introducing certain salary revisions in 1948, re-stated the principles upon which the compensation policy of the government was based. This was the first comprehensive statement of pay principles since 1919 but did not differ greatly from those of 1919. In summary, the three most important were:
- Equal pay for equal work-defined to include regional and locality pay differentials.
- Fair relationship between classes.
- Fair relationship with private employment - defined to require consideration of the average paid by "enlightened employers" or the so-called "good employers."
8 At the founding convention of the Civil Service Association of Canada in 1958, the Prime Minister, The Right Honourable John Diefenbaker, made the following statement on wage policy in the public service:
For many years it has been generally accepted that two main principles should guide the determination of salaries in the service. First, the salaries must be enough to do the job, that is, to attract enough of the right kind of men and women into the service and keep them in it; second, they must be fair as between civil servants and people outside the service, the taxpayers if you will, which means that the salaries we pay for any class of work should be comparable with those paid by private employers for similar classes of work, taking into account the other terms of employment that are necessary to make a fair comparison. I think these principles should continue to guide us.
9 The most recent expression of pay principles is to be found in Section 10 of the new Civil Service Act, which is worded as follows:
The Commission in making recommendations on remuneration shall consider the requirements of the civil service, and shall also take into account the rates of pay and other terms and conditions of employment prevailing in Canada for similar work outside the civil service, the relationship of the duties of the various classes within the civil service and any other considerations that the Commission considers to be in the public interest.
10 These most recently enunciated principles of compensation, although somewhat similar to those of 1919 and 1948, are much less specific and are consequently open to varied interpretations.
11 There is still no comprehensive statement of compensation principles for the public service. Past statements have been so generalized as to be of little practical value as policy guideposts. Government enunciation of concrete remuneration principles for the public service would meet a number of urgent needs. It would:
- provide a meaningful framework within which more specific pay policies may be developed.
- serve as guideposts to the Pay Research Bureau for making appropriate market comparisons.
- assist departmental managements in administering pay.
- facilitate a better understanding by employees and staff associations of government pay policy and practices.
- provide Parliament and the broader public with the necessary background and rationale for appraisal of government compensation policy.
12 A second major observation is that only in recent years has there been much attention to market forces in government pay determination. Although market factors were mentioned as one of the criteria for wage determination in the Young Report of 1919, the main emphasis during the nineteen-twenties and nineteen-thirties was on maintaining internal relativities and on vague standards of equity. Pay practice reflected an assumption that rates were adequate as long as they enabled the service to secure and retain the staff required. During World War II and the immediate post-war years, the basic criterion for most salary and wage adjustments was changes in the cost of living. It was not until the late nineteen-forties that any real attention was given to outside market pressures and rates. Mr. St. Laurent's restatement of compensation principles in 1948 placed greater emphasis upon the market than had been the case in the past. Increasingly since then there has been more concern about market rates, although it was not until the formation of the Pay Research Bureau in 1957 that this was translated into reasonably specific policy and practice related to outside occupational market comparisons.
13 This greater emphasis on market rates as a guide to pay determination in recent years reflects two factors: (1) relatively full employment since World War II inevitably has made the market a more dominant factor in pay determination; and (2) the growing need of the government for scarce technical, professional and higher-level manpower has forced it into more active competition with outside employers.
EXTERNAL CRITERIA FOR PUBLIC SERVICE WAGE POLICY
14 Clearly, the general aim of wage policy in the public service should be to create and maintain an efficient and properly remunerated service. Specifically, pay policy should, first, facilitate the staffing of the service with competent personnel by attracting suitable recruits and retaining effective employees; second, compensate employees in the public service fairly; and, third, achieve these two aims at a cost which is as reasonable as possible to the taxpayer.
15 The government competes with employers in the labour market. If the general level of wages in public employment is substantially lower than that for similar work and conditions in private industry, the government will find it increasingly difficult to recruit qualified persons. On the other hand, if the public scale is substantially higher, the public service will drain a disproportionate share of the more efficient workers from industry, thus affecting productivity in the national economy.
16 It is evident also that without consideration of "going" rates the government has little guide to the major economic aspects of wage determination. In the public service there is, as a rule, no direct relationship between wages and demands for the product because most governmental services are not supplied in a free, let alone a competitive, market. The government's only economic guide is, therefore, supplied by prevailing conditions in the labour market.
17 To establish outside market rates as the primary guide to public service wage and salary levels is, however, only to pick a starting point. Many practical difficulties are involved. The first is that there are usually a whole range of market rates with which the rate for any one public service position might be compared. Then there is the fact that many public servants lack counterparts in private industry. For their positions it is difficult, perhaps impossible, to find a useful market rate for comparison.
18 The first difficulty mentioned stems from the fact that the term "market" or "going" rate refers to an abstraction. There is no such thing as a single market rate. There are many going rates, and the problem of wage determination is not solved by identifying the rates paid for various types of work in private circles. It is still necessary to choose an appropriate sample of firms and rates to use as a guide in wage determination.
19 As a general rule, for most clerical and non-office wage earner jobs-after due account is taken of the geographical distribution of civil servants in the classification concerned-averages of rates paid in all establishments (except the very small) may properly be used for purposes of comparison. For technical, professional and higher-level jobs, however, the government must compete with a select group of employers. Here, the government, as a large employer, competes directly with the large private employers, and must keep in step with their practices if it is to recruit and maintain an efficient work force.
20 The Pay Research Bureau bases its wage comparisons on a "select group of employers." The phrase is not intended to mean the best employers, but rather a representative sample of those employers with whom the public service is in competition for recruits. The sample of firms used by the Pay Research Bureau in its surveys, although still evolving, seems to be a reasonably appropriate one for professional and technical manpower, but it might consider a somewhat less select sample for a number of the lower level occupations.
21 As a result of dramatic shifts in the labour market, many types of highly specialized manpower which previously found their outlet almost exclusively in the federal public service are now in strong demand by private industry, provincial and local governments, and educational institutions. Candidates who formerly would have considered the civil service their first choice now have a wide range of interesting and remunerative alternatives from which to choose. Increasingly, for this and other reasons, the public service has to be competitive in its wage and salary rates. As a corollary, it must maintain high standards of selection and work performance. It must give more attention to maintaining efficiency, standards of performance, and levels of productivity appropriate to such compensation levels. Compensation costs only begin with wage and salary levels. The final measure is the output the salaries buy.
22 Reference has already been made to the number of occupations in the public service for which it is difficult to find comparisons in the private sector of the economy. How, for example, can competitive market rates be used to fix the remuneration of astronomers, meteorologists, air traffic controllers, and others for whom the government is the chief employer? Here, bench-mark jobs with counterparts in the private sector may be used in association with job evaluation and other similar techniques to slot the jobs in question into the public service wage structure.
23 The government has some responsibility to ensure that the incumbents of such non market jobs receive equitable treatment compared to those whose rates are market-determined. It has already been observed that career earnings of those in jobs without counterpart in the private sector of the economy have tended to lag somewhat behind those for comparable jobs where the government is in competition for personnel. The government also has another objective. It must ensure an adequate long-term supply of personnel required to man jobs which are peculiar to the public service. This need reinforces the case for comparable and equitable pay treatment.
24 Should the government's general wage policy for the public service be modified to allow for the relative attractions of employee benefits and "other conditions of employment" in the public service? The government's present substantial advantage over private industry on fringe benefits for clerical and non-office wage occupations provides some leeway for shading recruiting rates slightly below the market for these classes. However, because of the competitive labour market such modification is inappropriate when recruiting managerial, professional and technical personnel. New graduates in these groups are more likely to be influenced by direct remuneration and opportunity than by the long-run value of fringe benefits. In the tight labour market for high-level manpower they can easily find both the wages they desire and employee benefits relatively similar to those offered by the public service. In the long run, government compensation policy should be designed to meet market conditions both in pay rates and individual fringe benefits.
INTERNAL CRITERIA FOR PUBLIC SERVICE WAGE POLICY
The Classification System
25 External comparisons provide proper bench-marks for establishing general levels of remuneration for particular types of work within the public service. They suggest the range within which wages and salaries for particular categories of personnel should fall but they do not provide all of the ingredients for administration of a well-conceived remuneration system. Such a system must make it possible for the wage or salary of the individual to be fitted into the salary structure suggested by external comparisons and to be fitted into it in such a way as to provide rewards and incentives for proper performance. Classification of positions, especially for an organization as large and complex as the public service, is essential for achieving these objectives.
26 Classification is not only important in administering a compensation system; it also serves other purposes. Classification depends on defining the function which the incumbent of a position is to perform. Such definition is clearly essential to proper placement, promotion and transfer, to training decisions, and to evaluation of performance. Classification and the job descriptions upon which it is based facilitate recruiting to meet present and future manpower requirements and to provide the foundation for decisions about qualifications required by the incumbent of any position.
27 The civil service classification system had its origin in the study by Arthur Young and Company, reported to Parliament in 1919. It was a time when there was a strong public sentiment in favour of bridling patronage. The "merit system," which was intended to relate appointments and promotions to qualifications for the work to be performed rather than to political favour, required a system of classification which would accurately define each position.
28 The present classification system was legally founded on the Civil Service Act of 1918, as amended in 1919. In the newly revised Civil Service Act, 1961, the legal basis for classification has been continued. Section 9 reads as follows:
9. (1) The Commission shall divide the civil service into classes of employment and shall classify each position therein.
(2) The Commission may subdivide each class into two or more grades, but where a class is not so subdivided it shall for the purposes of this section constitute a grade.
(3) The Commission shall define each grade by reference to standards of duties, responsibilities and qualifications, and shall give it an appropriate title.
(4) Each grade shall embrace all positions in a class having similar duties and responsibilities and requiring similar qualifications of persons appointed to a position in the grade.
(5) The Commission may divide, combine, alter or abolish any classes or grades, but no alteration in the establishment of a department shall be affected by anything done under this subsection without the approval of the Governor in Council.
(6) The title of each grade shall be observed in all records of the Commission, the Auditor General and the Treasury Board, and in all departmental estimates and parliamentary returns and appropriations, but need not be used for other purposes.
29 In its Report of Transmission, Arthur Young and Company in 1919 dealt with the needs and purpose of classification. It pointed out that the classification of the service was a prerequisite to the examination of applicants. The Act of 1918 required the testing of candidates, and appointments were to be made after competitive examination "which shall be of such a nature as will determine the qualifications of candidates for the particular positions to which they are to be appointed." "Obviously," wrote Arthur Young and Company, "the Commission cannot pass on the qualifications of candidates to fulfill the duties of particular positions unless they know what the duties of those positions are ... Only by a system of classification by which positions having substantially the same duties and calling for the same qualifications are grouped together can examinations be held in advance and lists of qualified persons be secured and maintained."
30 In addition, the Act required the Civil Service Commission "after consultation with department heads, to prepare plans for the organization of each department of the civil service." To fulfill its obligation to "indicate what classes of positions and what numbers of each class are required for the work of any department," a scheme of classification was essential. Finally, Arthur Young and Company emphasized that such a programme was necessary "if uniformity in compensation for the same work was to be brought about."
31 Since its inception in 1919, the system of classifications has been administered by the Civil Service Commission. For the guidance of those who were engaged in the classification programme, the Civil Service Commission approved the following statement of principles:
1. That the duties and responsibilities appertaining to a position should be the criteria for determining the classification of the position because these attributes constitute the fundamental characteristics that distinguish the position from other positions and because all of the purposes of classification will be served by a grouping that will bring together positions involving substantially the same duties and responsibilities.
2. That positions involving substantially the same duties and responsibilities call for practically the same qualifications as to education, experience, knowledge, and skill in their incumbents and that for this reason such qualification requirements, dependent as they are on the work to be performed, constitute an auxiliary basis for determining the proper classification of a given position.
3. That neither the degree of efficiency with which the duties of a position are being carried out by the person who may be filling it, nor the qualifications such person may possess or lack, nor the pay he may receive, nor any other fact dependent solely on his individuality, shall be considered as having any bearing on the classification of the position in question.
4. That the simplest practical grouping of positions should be adopted that will serve the purposes for which the classification is needed that in conformity with this principle the unit of classification should be a group (called a "class") embracing all those positions in the service, regardless of departmental lines, that involve duties and responsibilities which are substantially the same.
32 The problem of administering a classification scheme may be readily appreciated merely by noting that when the system was inaugurated there were only 25,000 employees in the classified civil service, whereas today there are 130,000. A system which was intended to incorporate "the simplest practical grouping of positions" may have permitted a reasonable degree of flexibility when it covered 25,000 or even 50,000 employees. It has become more complex, more difficult to administer, and more inadequate as the size of the service has increased.
33 The Royal Commission on Administrative Classifications reported that in 1946 there weresome 3,700 different classifications (1,500 of which were for temporary war-time posi�tions), which it considered an excessive refinement and by no means "the simplest practical grouping." The Royal Commission recommended a simpler and more workable system of classification. In the intervening years an effort has obviously been made to meet this criterion: at the time the present study was undertaken the number of classes had been reduced to 887, of which 106 had been defined in such terms that they were considered adequate for present working conditions. There were no official standards for the remaining 781 classes, however, and it is estimated that a complete set of standards will not be "achieved for some years."
34 Until the early fifties the administration of the classification system had the merit of relative flexibility. Classification officers were employees of the Civil Service Commission but spent considerable time in the departments in the performance of their duties and were under instructions to become familiar with every first name. They came to have a considerable knowledge of the departments for which they were responsible and of the individuals in them. Classification decisions were made close to the work place. This was very much the picture after World War II, when the men doing this work were comparatively senior and experienced, not only in classification but also in dealing with widely varying types of personnel under many different circumstances. It was a period when the Civil Service Commission had one clearly recognized head, communication lines from the classifier to the Chairman of the Commission were short, and those responsible for classification could get relatively quick decisions and be certain of firm support.
35 Within the last decade, this flexibility has been lost. To the individual and his supervisor alike classification problems appear more difficult. There is less room for intelligent persuasion and the whole process is much slower. Among the several apparent reasons is the change in the organization of the Commission itself. The three Commissioners now allocate their responsibilities among themselves. As a result, staff work on classification and pay falls to one Commissioner while the operations group responsible for implementation reports to a different Commissioner.
36 In a move of debatable wisdom, too, classification, recruitment and placement have been combined under officers attached to the Operations Branch of the Commission. Experience in industry suggests that these are distinct functions best kept separate and that, if they are not, one or other of them is likely to suffer, depending upon the pressures of the moment. Few personnel administrators are equally effective in handling such divergent functions.
37 The exigencies of financial control have, however, been the source of most of the relative deterioration in the administration of the classification system. Although the Treasury Board has no authority to classify a position, it has become the real power behind the classification system by ruling on the number of positions of any given classification to be permitted in a department and on the salary appropriate to each classification. Inevitablyt its enlarged role has involved duplication of personnel staff. The Treasury Board soon found, for instance, that to rule on the salary range appropriate to a classification it required personnel specialists to assess the recommendations of the Civil Service Commission. In addition, the establishment review procedure, the defects of which have been enlarged on earlier, has tended to make the classification plan sluggish and unmanoeuverable.
38 Classification administration does not usually pose the problem for industry it does for the civil service. An important reason is that industry is less prone to apply common classifications to all divisions of its operations. Whereas in the federal civil service the common denominator is the classification, in industry it is usually the salary range. This is an important distinction. Industry has found that a system which ranks classifications largely by linking them to a simplified set of salary ranges is much more flexible than a system of classifications applying across the organization.
39 Many European countries, notably Britain, France, Germany, Italy, Austria, and Belgium, have adopted general classes which are common to their whole civil service; this is also the pattern favoured by the Canadian classification system. In the United States, the enormous size of the federal public service has made the concept of service-wide classes impractical. The salary range has, accordingly, been made the common denominator and, under the United States Federal Position Classification Plan, all positions are encompassed within 18 salary grades. Each salary grade takes in many classifications, and position names are of relatively little significance. The important fact is the decision that the position is comparable in terms of difficulty and responsibility with all other positions classified within the same salary grade.
40 In essence, this is the system now used widely throughout North American industry. The description of the duties of the class determines its ranking within a comparatively small number of salary grades. Since these rankings are subjective, they cannot be really precise and there is, therefore, a tendency to use broad overlapping ranges. In effect, through the present classification system, Canada's Treasury Board and the Civil Service Commission are struggling to make distinctions finer than either the United States Civil Service Commission or major company industrial relations executives consider themselves competent to achieve. In the result, the classification files of Ottawa's Civil Service Commission are replete with tedious evidence of long-drawn-out wrangles over alleged inequities and inconsistencies which the present classification maze makes largely unavoidable.
41 The groping for unattainable perfection is also evident in the attempt to write standards. Up to May 1961, only some 106 of 887 classes had been brought within the control of generally accepted standards. Some months earlier, one officer of the Civil Service Commission had predicted that it would take fourteen years to complete the programme. This prediction was probably appropriate to the approach being used, with standards being written in the most meticulous detail. Their very length and complexity would overwhelm the memory of the average executive, so that he could never expect to get any substantial number of standards clearly in his head. Preoccupation with meticulously detailed classification is unrealistic. Minutely descriptive detail, of little significance for determining the market value of the position or its relative organizational position, serves chiefly to confuse the issue and limit flexibility in personnel management. Such descriptions can be accurate only at a point in time, because jobs, like living organisms, change constantly.
42 Succinct descriptions, containing all the essential detail needed for organizational clarity and the determination of job value, are greatly preferable. Fortunately, this style has recently gained favour with the Civil Service Commission and, not surprisingly, the work of preparing standards has been speeded up accordingly. There is now some reasonable hope that a complete set of standards will be provided in not more than four years. This may prove an optimistic forecast, depending upon the rate of change within the classification system during this period. The pace of change within the civil service will force the administrators of the classification system to run faster and faster, if they would avoid giving the embarrassing illusion of standing still.
43 This, however, is only tinkering with part of a system which needs wholesale review and revision. The present classification officers are like skilled mechanics repairing the engines of a paddle-wheeler, forging a replacement part from a carriage bolt here and making do with a bicycle chain there. They are too preoccupied to consider the relevant question of whether the engine they tend so knowingly and with such ingenuity has not long since become obsolete.
44 A major element of rigidity has been injected into the civil service classification system by the practice of tying very specific educational and experience qualifications to the descriptions of the positions. These qualifications often appear to be somewhat arbitrary and have the inevitable result that career sequences indicated by the classification system are often bestrewn with road blocks insurmountable by many, regardless of the level to which their energies and abilities might otherwise take them.
45 The practice of specifying educational and experience standards for positions was forecast in the early Civil Service Commission statement of principles on classification which has been quoted above. The administrative convenience of such standards is that they make it easier to screen candidates. Specific objective standards, no matter how arbitrary, have practical advantages over the best conceived job descriptions, in limiting the number of appeals which can be launched against promotion decisions and in relieving some of the continuing pressure for making seniority the chief element in promotions.
46 Experience in the exempt agencies does not support the contention that arbitrary and tightly drawn educational standards are necessarily required. In the Bank of Canada, for example, there is no fixed educational requirement for an economist. There are examples of this classification being attained by men who have never been to university, but who have developed the ability to perform the work of an economist in the Bank.
47 Over the years, the administrators of the classification system have endeavoured to slay the dragon of rigidity in the classification system by the development of loose general classes. Those who can meet the educational prerequisites can be classified, for example, as "Chemists;" others who have the knowledge of junior chemists but lack the formal education are classified as "Technical Officers." The academically qualified man may be an "Economist," his self-educated colleague a "Technical Officer." Thus, to give the system something of the flexibility which the standards themselves deny, a number of exceedingly loose general classifications have been added, of which the most striking examples are the Technical Officer and the Administrative Officer series. An employee classified as a Clerk, an Economist, a Calculating Equipment Operator, or a Cargo Inspector, can be readily identified; but one cannot guess what a Technical Officer does simply from his classification. Although the classification suggests a laboratory occupation, the individual often turns out to be a personnel officer or information officer.
48 A basic principle of the classification system enunciated in 1919 was "that neither the degree of efficiency with which the duties of a position are being carried out by the person who may be filling it, nor the qualifications such person may possess or lack, or the pay he may receive, nor any other fact dependent solely on his individuality, shall be considered as having any bearing on the classification of the position in question." Classification, in other words, is concerned with duties and positions, not persons.
49 However, concern for the individual rather than the position in the civil service classification has become very evident, particularly in the scientific classifications. A chemist, for example, may go all the way from a Chemist 1 at $4,380 to a Chemist 5 at $11,200 per year without ever changing his job, and might do so while working at the same problem from start to finish. Here the change in the classification is the change the man makes in the job; literally he changes the whole level of the job "solely on his individuality." It has long been recognized that the job tends to form itself around the man at all levels of management. There is not one best way of performing a management function; the best way for one may be almost impossible for another, and yet each may discharge his responsibility competently.
50 Even at clerical levels, the qualifications of the individual, and other factors dependent solely on his individuality, may change the job and force reclassification. The result is referred to in the civil service as "classification creeping," and some of it is undoubtedly justified.
51 The present administration of the classification system, and indeed the classification system itself, is only part of the excessive paternalism which surrounds the civil servant. He is protected by Parliament, both indirectly by individual members and directly through the Civil Service Commission, and except by various evasions of the system, denied his individuality by the tight control system of personnel management. Control of classification, for example, is removed from departmental management and placed in the hands of a more remote control agency, presumably to ensure objective review, free of bias. The result is that the system is made more impersonal and at the same time is much less sensitive to the realities of constantly chang�ing duties and responsibilities for the individual.
The Remuneration System
52 Most modern remuneration systems are imperfect attempts to see that each employee is paid fairly in relation to four basic considerations:
- The requirements of the job.
- The employee's performance in relation to such requirements.
- The internal (and usually historical) concept of the difficulty and responsibility of any given job as compared with the relative difficulty and responsibility of all other jobs within the organization.
- The external concepts of relativity with reference to the same job.
53 Since the perfect remuneration system does not exist anywhere, a variety of methods are used to determine the relativities within a remuneration system and to administer the system. There is to be seen, on the North American continent, a considerable area of agreement in the economy at large and in some governments, notably that of the United States of America, on the desirable principles of a good remuneration system. The system currently in use in the civil service and in most, but not all, of the Crown agencies, does not meet these standards.
54 Like the classification system, the remuneration system in the civil service of Canada evolved from principles enunciated in the Arthur Young and Company study of 1919. Briefly, these were:
- Rates of compensation should be uniform for the same work.
- Rates of compensation should be relatively right for different classes. Within the same vocation, trade or profession, this relativity was to be measured by differences in duties, responsibilities, experience, knowledge and skill. In "different fields," rates of compensation were to be related, one field with another, in the same way that the "business world" related rates for different vocations, trades, professions and lines of work.
- The pay for each class should be equitable. This was to mean "fair to the employee: and fair to the taxpaying public." This fairness was spelled out in its social implications and was also taken to mean that compensation should not materially exceed that generally paid for similar service by employers in the industrial and commercial world. In making comparisons with the industrial world, consideration was to be given to permanence and continuity of tenure, hours of work, and holiday and sick leave.
- The schedule should provide an absolute minimum, absolute maximum and intermediate rates between the two.
55 Before describing the administration of the present system, it is useful to consider some of the assumptions inherent in this approach. These may be stated as follows:
- The principles can best be implemented through a central administrative agency.
- The principle of equal pay for equal work can be implemented with a close approach to precision.
- The implementation of the second principle, that rates of compensation should be relatively right for different classes, assumes a system of job evaluation.
- The fourth of the principles originally set out by Arthur Young and Company, "that the schedules should
provide an absolute minimum, absolute maximum and intermediate rates within this range," now relies for its
interpretation on a number of assumptions which appear to have evolved over the years and which do not derive their
inspiration from the report submitted by Arthur Young and Company. These are:
- that the value of an employee in a given classification can be defined within narrow limits;
- that the limits within which this definition may be achieved become increasingly narrow as the value of the employee's service increases;
- that within this narrow range, the increasing effectiveness of the employee can be directly related to time and his increasing merit compensated on a pre-set time schedule;
- that the vast majority of employees in any given classification will merit the pay increases based on time and that denial of such increases should therefore be made difficult.
- Unstated, but important, is the assumption that no salary of a member of the classified civil service may exceed the remuneration of a cabinet minister. This assumption also appears to exert a powerful influence in the Crown agencies and there is reason to believe it may have important influence even where the chief executive is paid more than a cabinet minister.
56 The administration of the remuneration system has been plagued by the absence of a complete set of classification standards as a prime requisite. Moreover, the system has presupposed job evaluation, but no formal system of job evaluation has ever been adopted. It is true that some of the elements of a factor comparison system have been applied to job evaluation, but it is essentially a loosely administered ranking system. If equitable salaries have from time to time been achieved, this has been in spite of the system. Because the Civil Service Commission advises and Treasury Board decides, there is dual responsibility and duplication of staff. Relativity with salaries in the economy at large has undoubtedly been improved since the establishment of the Pay Research Bureau, but the Bureau, in turn, is handicapped by the inadequacy of standards for making the comparisons.
57 One of the principles of remuneration applied since the inception of the system is that the schedules should provide an absolute minimum, an absolute maximum, and automatically attained intermediate rates within each range. This principle is sharply at variance with the general practice in the economy, particularly with reference to supervisory and management positions. Some companies have adopted systems of automatic progression at the lower levels of office employment because they have found that automatic progression at the lowest level, and sometimes to the mid-point of the range in clerical levels, tends to reduce arguments, simplify administration, and conserve the time of departmental management and of the personnel or industrial relations organization.
58 This might be taken as evidence of the wisdom of the present civil service system. Most of those who administer such systems will admit, however, that they favour mediocrity and constitute a rationalization in favour of peace. The victims of the system are those superior performers whose merit is not recognized lest such recognition bring grievances from less meritorious but more numerous colleagues.
59 The validity of this conclusion may be tested by noting that companies, which pay typists on an automatic progression of salary, pay supervisors by merit within broad ranges, on the assumption that incentive is more important to supervisors. There is, indeed, some possibility that this is true for it is not unreasonable to suppose that the very employees who have the qualities necessary for progressing to supervisory positions, are likely to be the most alert and responsive to financial incentive. Even so, there is certainly no proof that the elimination of financial incentives for meritorious performance at the lower levels of office employment is an advantage. Treating all such employees in a uniform manner may have the advantage of convenience, but this is scarcely the same as saying that the elimination of financial incentive at the lower levels of an office organization will improve efficiency. Even those companies which have done it suffer from no such delusion.
60 The administration of ranges within the civil service bears no resemblance whatsoever to the recommendation of Arthur Young and Company in the Report of Transmission, Part III (g) which reads:
Advancement in pay as used herein is to be taken to mean an increase in the salary of an employee in a given position, from one rate to a higher rate within the range of compensation allowed, without involving any change in position or duties... It will be conceded that advancement in pay is one of the most effective forms of reward that can be offered to an employee as an incentive to him to apply himself industriously to the duties of his position. It is manifest that if an increase in pay is given as a reward for and an inducement to efficient service it must be based on demonstrated efficient service and on no other consideration.
Even as far back as 1919, it was possible for the Report of Transmission to note "that only in very rare cases indeed is the annual increase withheld" -a statement as valid today as it was then. The tendency is so strong toward automatic progression through the ranges that the key comparison used by the Pay Research Bureau, the Civil Service Commission and the Treasury Board in establishing salaries is the comparison of the top of the range with that in selected companies.
61 The system of ranges as conceived in the 1919 study recognized the impact of the employee's own efforts upon the value of his job. The ranges were comparatively narrow and therefore the provision for the recognition of such effort and such variation between employees was modest; but it was there, and it is unfortunate that this potentially effective incentive has been largely destroyed by administrative practice within the service.
62 In the intervening years, enlightened companies on the North American continent have tended toward a widening of ranges, particularly at the more senior levels. The endeavour is to fix the employee's salary within the appropriate range strictly on the relative merit of his performance. This is not to deny that in any organization length of service tends to influence salary in an upward direction, but there has been a conscious and increasing effort to control this tendency and to make its influence secondary to quality of performance.
63 These broader ranges favoured by industry are effective only when administered in accordance with the principle of merit. It would be extremely costly to use wide ranges, designed to recognize the variations in performance which are inevitable in any group of men and women, in such a way that movement through the ranges would, in practice, be related strictly to the passage of time. As the present system of ranges in the service is geared to the passage of time and not to merit, managers in the departments find it necessary to use other expedients for the recognition of merit. The most common is what has been referred to previously as "classification creeping," a practice which is facilitated by the loose general classification and by the lack of standards for the majority of classifications. Thus, it is possible to support a change in classification, ostensibly because the duties have changed, but actually because the worth of an employee in a position has changed. His duties remain the same, but in the opinion of his superior he deserves recognition for his accomplishment.
64 This procedure has largely destroyed the effectiveness of the classification system and made a mockery of the ranges, to the point that only a far-reaching job evaluation study within the civil service would disclose the real ranges for positions of comparable difficulty and responsibility. It is safe to say that the actual ranges would be found to be considerably broader than they appear to be from the official classification listings. Experience elsewhere suggests that they may well be broader than those currently favoured by industry but, if this is true, they are not administered fairly, because not every able employee giving superior performance in his position is recognized by the device of classification creeping. Moreover, real changes in responsibility may not be, and frequently are not, recognized promptly. An employee may be misclassified and mispaid for long periods while his case is passed through the control agencies, which have no real responsibility for him, no interest in him and no concern for the achievement of his department's objectives.
65 Your Commissioners are bound to conclude that the present remuneration system is essentially negative. It does not provide for positive recognition of superior performance. The administrators tend to regard it as a system of cost control and, for the reasons set out, it lends itself to the self-deception of those who cherish it as an effective instrument of cost control. It is too easily defeated and, worse still, those who exercise the control cannot know the extent to which it is being defeated. So it is a control system which is not what it appears to be - a system pushed and pulled by pressures from many sources and revised in its parts to meet such shifting pressures. It has long since lost any unity of concept which it may once have had.
66 These serious defects in the classification and remuneration systems become more evident as the public service employs more high-level professional and managerial manpower. Whether for the purpose of its competitive position in recruiting such personnel or of obtaining most effective results from their services, the public service, like private employers, should increasingly be guided by the following principles:
- More emphasis should be placed on developing appropriate monetary and non-monetary rewards for senior professional people, as an offset to check the present incentive to abandon professional jobs and seek advancement through the administrative hierarchy. Salary plans should provide for parallel lines of advancement for professional and administrative personnel, with roughly comparable salary scales. The present system in many areas places too much emphasis for purposes of remuneration on the organizational level and numbers of people supervised and not enough emphasis on the technical competence and contribution of the individual.
- There must be greater recognition of differences in individual performance, particularly for high-level manpower. It is becoming important to base compensation on the capabilities and performance of individuals rather than solely upon rigid job descriptions. The present system, which is said to be based on equal pay for equal work, too often results in equal pay for unequal effort and un-equal interest. This is unfair and has an insidious effect on morale and efficiency. The present classification system emphasizes the job first and the man second. A proper classification and remuneration system recognizes that in the professional and managerial areas the individual determines the level of responsibility carried in the job. Job families can be classified by level of responsibility carried as well as by the nature of the work performed. Thus, to the extent appropriate, the individual can be rewarded either by advancement within the range or by promotion to a higher range in the series, for the same work carried out at more responsible level.
MACHINERY FOR WAGE DETERMINATION AND SALARY ADMINISTRATION
67 By the terms of the Civil Service Act, responsibility for wage determination and salary administration rests with the Civil Service Commission and the Governor in Council. The Commission is required to keep the rates of pay under review and, whenever the need arises, to make recommendations concerning them to the Governor in Council. To become effective, the recommendations of the Commission must be approved by the Governor in Council, whose powers in this respect are normally exercised by the Treasury Board.
68 Two branches of the Civil Service Commission are involved in the process of wage determination. The Pay Research Bureau is responsible for fact-finding. Its function is to carry out comparative studies of the rates of pay, conditions of employment and related practices prevailing inside and outside the civil service, and to report its findings in an objective manner to the Commission, the Treasury Board, and, in practice, to representatives of the major staff associations. The Pay and Standards Branch is responsible for assisting the Commission to develop pay recommendations. Reports of the Pay Research Bureau are considered in conjunction with other relevant factors, such as the need for appropriate internal relativities or recent experience in recruiting and retaining qualified employees for the public service.
69 The Commission receives advice on pay research from the Advisory Committee on Pay Research. This body meets regularly to review progress reports of the Bureau and to consider a variety of problems associated with survey concepts and techniques, the timing of studies and the distribution of reports. The Committee is chaired by a Civil Service Commissioner and has six other members, three representing the staff side and three representing the official side. Of the three staff side members, one represents the Professional Institute of the Public Service of Canada. Of the three offcial side members, one is e�xpected to represent the views of management of departments employing professional personnel.
70 The staff associations maintain a very active interest in the whole process of pay determination. Their role in the process, which has developed gradually over the years, has recently achieved formal recognition in the sections of the new Civil Service Act that provide for consultation with "representatives of appropriate organizations and associations of employees" on pay matters.
71 The role of the departments is more difficult to identify. Legally, they have no responsibility in this field. In practice, however, there is continuous communication between the Commission and departmental management on the adequacy of existing rates of pay and the probable effects of proposed revisions.
72 The final step in the pay determination process is the review of the Commission's recommendations by the Treasury Board. This frequently requires intensive discussion between senior staff of the two agencies. Under the former provisions of the Civil Service Act, the Governor in Council could accept or reject the Commission's recommendations, but could not establish rates of pay different from those recommended. Under the provisions of the new Act, the Governor in Council, while bound to consider the views of the Commission, will be free to set whatever rates it considers appropriate.
73 Civil Service Commission responsibility for pay recommendations extends only to those affecting civil servants. Determination and application of rates of pay for prevailing rate employees, ships' officers and crews, and other similar groups exempt from the Civil Service Act is shared among the Treasury Board, the employing department and the Department of Labour. It is not surprising that the whole area of pay determination is marked by duplication of machinery and effort and a failure to achieve reasonable co-ordination and common guiding principles. These defects can be remedied if the proposed Personnel Division of the Treasury Board is held responsible for appraisal of the wage and salary situation and for making recommendations to the Board for all pay adjustments in the public service. Similarly, the Pay Research Bureau should be held responsible for collecting and organizing all the necessary outside comparative data. It is much better fitted to provide this necessary specialized information than are either the Department of Labour or the Dominion Bureau of Statistics, whose roles are more suited to the collection and compilation of aggregate data for public consumption and use.
74 Responsibility for determining and adjusting employee benefit plans is even more widely dispersed than is that for wage and salary determination. As a result, each benefit plan has tended to be looked at in a vacuum rather than in the perspective of the total benefits package or, more properly still, in the perspective of the total compensation (pay and benefits) package. To fill its contemplated role properly, the Personnel Division of the Treasury Board must be as concerned with the benefits part of the total compensation pattern as it will be with wage and salary determination.
75 Some special comment is desirable on the task of making suitable outside comparisons with public service wage and salary rates, benefit plans, and other working conditions. This, while simple in concept, is remarkably diffcult in practice. It is essentially a fact-finding job, but one which requires the exercise of a great deal of skilled and professional judgment as to what are relevant facts. Wage and salary comparisons can be made properly only on the basis of a sound evaluation of job duties and requirements. Comparison of working conditions and benefit plans involves weighing complex questions of relative value and costs to employer and employee.
76 The Pay Research Bureau was established in 1957 for this difficult fact-finding job. It has made substantial progress in assessing the comparability of public service and private sector jobs and in building pay comparisons on these. It produces valuable information about the labour markets in which the federal public service must compete. Recently, it has begun the very necessary task of matching pay comparisons with data on benefits and other working conditions. The Bureau operates, and must if it is to do its job properly, as an independent, objective body, producing data which the central management of government can use as a basis for making its compensation decisions. Currently the information it gathers is made available to the Civil Service Commission (of which it is a part), the Treasury Board, and certain senior ofl�cials of major staff associations.
77 As has already been demonstrated by United Kingdom experience (where pay research is conducted by a body directed and financed jointly by the government and the staff associations) a major hazard is the temptation, or alternatively the pressure, to make too many outside comparisons and to make them too frequently. To keep the job within manageable proportions for an organization as large and as varied as the public service, there must be a determination to limit comparisons to appropriate bench-mark jobs and, generally, to limit frequency of comparison by some cyclical review plan. Recently, the federal government has moved in this direction with its biennial review schedule, which divides wage and salary rates of civil servants and the R.C.M.P. into five groups, with the following initial set of review dates.
- Professional and related classes: reviewed July 1, 1961.
- Administrative classes, clerical and office service classes, professional support classes and commissioned R.C.M.P. officers: reviewed October 1, 1961.
- Hospital classes: reviewed January 1, 1962.
- Penitentiary staffs and non-commissioned R.C.M.P.: reviewed April 1, 1962.
- Customs and Immigration classes, postal classes, crafts, building, custodial and maintenance classes and other classes: to be reviewed October 1, 1962.
78 Complementing the internal administrative need for limiting the number and frequency of comparisons is the desirability of considering the position of the co-operating employers. Without the willing co-operation of outside employers, the usefulness of pay comparisons is likely to be vitiated and the task of getting even poor comparisons made very difficult. On the other hand, most employers with whom the federal government wishes to make comparisons share the same need and are themselves accustomed to the procedure. They realize that for them the values of pay comparisons must be balanced against costs in manpower and dollars. They make comparisons with other firms, but realize that to obtain co-operation they must keep their requests reasonable and ensure that the information they receive and exchange makes the process worthwhile to both parties. It would be most unfortunate if there were any attempt to compel outside employers to "co-operate" or to impose on them an unreasonably detailed and costly burden without adequate reciprocal advantages.
Appendix D
Organizations by domain, 2003
|
Core Public Service – PSSRA 1-1 DEPARTMENT |
|
ATLANTIC CANADA OPPORTUNITIES AGENCY |
|
CANADA INDUSTRIAL RELATIONS BOARD |
|
CANADIAN ARTISTS AND PRODUCERS PROFESSIONAL RELATIONS TRIBUNAL |
|
CANADIAN CENTRE FOR MANAGEMENT DEVELOPMENT |
|
CANADIAN DAIRY COMMISSION |
|
CANADIAN ENVIRONMENTAL ASSESSMENT AGENCY |
|
CANADIAN FORCES GRIEVANCE BOARD |
|
CANADIAN GRAIN COMMISSION |
|
CANADIAN HUMAN RIGHTS COMMISSION |
|
CANADIAN HUMAN RIGHTS TRIBUNAL |
|
CANADIAN INTERGOVERNMENTAL CONFERENCE SECRETARIAT |
|
CANADIAN INTERNATIONAL DEVELOPMENT AGENCY |
|
CANADIAN INTERNATIONAL TRADE TRIBUNAL |
|
CANADIAN RADIO-TELEVISION AND TELECOMMUNICATIONS COMMISSION |
|
CANADIAN SPACE AGENCY |
|
CANADIAN TRANSPORTATION ACCIDENT INVESTIGATION AND SAFETY BOARD |
|
CANADIAN TRANSPORTATION AGENCY |
|
CIVIL AVIATION TRIBUNAL |
|
COMMUNICATION CANADA |
|
COPYRIGHT BOARD |
|
CORRECTIONAL SERVICE OF CANADA |
|
DEPARTMENT OF AGRICULTURE AND AGRI-FOOD |
|
DEPARTMENT OF CANADIAN HERITAGE |
|
DEPARTMENT OF CITIZENSHIP AND IMMIGRATION |
|
DEPARTMENT OF FINANCE |
|
DEPARTMENT OF FISHERIES AND OCEANS |
|
DEPARTMENT OF FOREIGN AFFAIRS AND INTERNATIONAL TRADE |
|
DEPARTMENT OF HUMAN RESOURCES DEVELOPMENT |
|
DEPARTMENT OF INDIAN AFFAIRS AND NORTHERN DEVELOPMENT |
|
DEPARTMENT OF INDUSTRY |
|
DEPARTMENT OF JUSTICE |
|
DEPARTMENT OF NATIONAL DEFENCE |
|
DEPARTMENT OF NATIONAL HEALTH AND WELFARE |
|
DEPARTMENT OF NATURAL RESOURCES |
|
DEPARTMENT OF PUBLIC WORKS AND GOVERNMENT SERVICES |
|
DEPARTMENT OF THE ENVIRONMENT |
|
DEPARTMENT OF THE SOLICITOR GENERAL |
|
DEPARTMENT OF TRANSPORT |
|
DEPARTMENT OF VETERANS AFFAIRS |
|
DEPARTMENT OF WESTERN ECONOMIC DIVERSIFICATION |
|
ECONOMIC DEVELOPMENT AGENCY OF CANADA FOR THE REGIONS OF QUEBEC |
|
HAZARDOUS MATERIALS INFORMATION REVIEW COMMISSION |
|
IMMIGRATION AND REFUGEE BOARD |
|
INTERNATIONAL JOINT COMMISSION |
|
LAW COMMISSION OF CANADA |
|
MILITARY POLICE COMPLAINTS COMMISSION |
|
NAFTA SECRETARIAT – CANADIAN SECTION |
|
NATIONAL ARCHIVES OF CANADA |
|
NATIONAL FARM PRODUCTS COUNCIL |
|
NATIONAL LIBRARY OF CANADA |
|
NATIONAL PAROLE BOARD |
|
OFFICE OF INDIAN RESIDENTIAL SCHOOLS RESOLUTION OF CANADA |
|
OFFICE OF THE CHIEF ELECTORAL OFFICER |
|
OFFICE OF THE COMMISSIONER FOR FEDERAL JUDICIAL AFFAIRS |
|
OFFICE OF THE COMMISSIONER OF OFFICIAL LANGUAGES |
|
OFFICE OF THE CO-ORDINATOR STATUS OF WOMEN |
|
OFFICE OF THE GOVERNOR GENERAL'S SECRETARY |
|
OFFICE OF THE REGISTRAR OF THE SUPREME COURT OF CANADA |
|
OFFICES OF THE INFORMATION AND PRIVACY COMMISSIONERS |
|
PASSPORT OFFICE |
|
PATENTED MEDICINE PRICES REVIEW BOARD |
|
PRAIRIE FARM REHABILITATION ADMINISTRATION |
|
PRIVY COUNCIL OFFICE |
|
PUBLIC SERVICE COMMISSION |
|
REGISTRY OF THE COMPETITION TRIBUNAL |
|
REGISTRY OF THE FEDERAL COURT OF CANADA |
|
REGISTRY OF THE TAX COURT OF CANADA |
|
ROYAL CANADIAN MOUNTED POLICE (CIVILIAN STAFF) |
|
ROYAL CANADIAN MOUNTED POLICE EXTERNAL REVIEW COMMITTEE |
|
ROYAL CANADIAN MOUNTED POLICE PUBLIC COMPLAINTS COMMISSION |
|
STATISTICS CANADA |
|
TREASURY BOARD (SECRETARIAT) |
SEPARATE EMPLOYERS – PSSRA 1-2
|
DEPARTMENTS |
|
CANADA CUSTOMS AND REVENUE AGENCY |
|
CANADIAN FOOD INSPECTION AGENCY |
|
CANADIAN INSTITUTES OF HEALTH RESEARCH |
|
CANADIAN NUCLEAR SAFETY COMMISSION |
|
CANADIAN POLAR COMMISSION |
|
COMMUNICATIONS SECURITY ESTABLISHMENT |
|
FINANCIAL CONSUMER AGENCY OF CANADA |
|
FINANCIAL TRANSACTIONS AND REPORTS ANALYSIS CENTRE OF CANADA |
|
INDIAN OIL AND GAS CANADA |
|
NATIONAL ENERGY BOARD |
|
NATIONAL FILM BOARD |
|
NATIONAL RESEARCH COUNCIL OF CANADA |
|
NATIONAL ROUND TABLE ON THE ENVIRONMENT AND THE ECONOMY |
|
NATURAL SCIENCES AND ENGINEERING RESEARCH COUNCIL |
|
NORTHERN PIPELINE AGENCY |
|
OFFICE OF THE AUDITOR GENERAL OF CANADA |
|
OFFICE OF THE CORRECTIONAL INVESTIGATOR |
|
OFFICE OF THE SUPERINTENDENT OF FINANCIAL INSTITUTIONS |
|
PARKS CANADA AGENCY |
|
PUBLIC SERVICE STAFF RELATIONS BOARD |
|
SOCIAL SCIENCES AND HUMANITIES RESEARCH COUNCIL |
|
OTHER ORGANIZATIONS |
|
ATLANTIC PILOTAGE AUTHORITY |
|
CANADA DEPOSIT INSURANCE CORPORATION |
|
CANADA HARBOUR PLACE CORPORATION |
|
CANADIAN BROADCASTING CORPORATION |
|
CANADIAN CENTRE FOR OCCUPATIONAL HEALTH AND SAFETY |
|
CANADIAN COMMERCIAL CORPORATION |
|
CANADIAN FILM DEVELOPMENT CORPORATION |
|
CANADIAN MUSEUM OF CIVILIZATION |
|
CANADIAN MUSEUM OF NATURE |
|
CANADIAN TOURISM COMMISSION |
|
DEFENCE CONSTRUCTION (1951) LIMITED |
|
HERITAGE CANADA |
|
HOUSE OF COMMONS (EMPLOYEES) |
|
INTERNATIONAL CENTRE FOR HUMAN RIGHTS AND DEMOCRATIC DEVELOPMENT |
|
INTERNATIONAL DEVELOPMENT RESEARCH CENTRE |
|
LAURENTIAN PILOTAGE AUTHORITY |
|
LIBRARY OF PARLIAMENT |
|
NATIONAL ARTS CENTRE CORPORATION |
|
NATIONAL BATTLEFIELDS COMMISSION |
|
NATIONAL CAPITAL COMMISSION |
|
NATIONAL GALLERY OF CANADA |
|
NATIONAL MUSEUM OF SCIENCE AND TECHNOLOGY |
|
OFFICE OF THE PRIME MINISTER (EMPLOYEES) |
|
SENATE (EMPLOYEES) |
|
STANDARDS COUNCIL OF CANADA |
|
MISCELLANEOUS (INCLUDE, AMONG OTHERS, MINISTERIAL STAFF, JUDGES, STUDENTS AND STATISTICAL SURVEY OPERATION STAFF) |
Note : In this study, we included most of the above-noted organizations with federal business enterprises in the sixth domain, which we examine only to a very limited degree. In our "Other domain" we include from this list only the House of Commons (employees), Library of Parliament, Office of the Prime Minister (employees), Senate (employees) and most of the Miscellaneous group, i.e. Ministerial staff, judges and students.
|
FEDERAL BUSINESS ENTERPRISES |
|
ATOMIC ENERGY OF CANADA LIMITED |
|
BANK OF CANADA |
|
BELLEDUNE PORT AUTHORITY |
|
BUSINESS DEVELOPMENT BANK OF CANADA |
|
CANADA LANDS COMPANY LIMITED |
|
CANADA MORTGAGE AND HOUSING CORPORATION |
|
CANADA POST CORPORATION |
|
CANADIAN WHEAT BOARD |
|
CAPE BRETON DEVELOPMENT CORPORATION |
|
EXCHANGE FUND ACCOUNT |
|
EXPORT DEVELOPMENT CORPORATION |
|
FARM CREDIT CORPORATION |
|
FEDERAL BRIDGE CORPORATION LIMITED |
|
FRASER RIVER PORT AUTHORITY |
|
FRESHWATER FISH MARKETING CORPORATION |
|
HALIFAX PORT AUTHORITY |
|
MARINE ATLANTIC INC. |
|
MONTREAL PORT AUTHORITY |
|
NANAIMO PORT AUTHORITY |
|
NORTH FRASER PORT AUTHORITY |
|
PETRO-CANADA LIMITED |
|
PORT ALBERNI PORT AUTHORITY |
|
PRINCE RUPERT PORT AUTHORITY |
|
QUEBEC PORT AUTHORITY |
|
RIDLEY TERMINALS INC. |
|
ROYAL CANADIAN MINT |
|
SAGUENAY PORT AUTHORITY |
|
SAINT JOHN PORT AUTHORITY |
|
SEPT-ILES PORT AUTHORITY |
|
ST. JOHN'S PORT AUTHORITY |
|
THUNDER BAY PORT AUTHORITY |
|
TORONTO PORT AUTHORITY |
|
TROIS-RIVI�RES PORT AUTHORITY |
|
VANCOUVER PORT AUTHORITY |
|
VIA RAIL CANADA INC. |
|
WINDSOR PORT AUTHORITY |
Appendix E
Lexicon of names and symbols for the current and former occupational group structure in the core public service domain
LEXICON
Bargaining Agents & Bargaining Groups
Public Service Alliance of Canada (PSAC)
Program Administration (PA)
|
AS |
Administrative Services |
|
|
CM |
Communications |
|
|
CR |
Clerical and Regulatory |
|
|
DA |
Data Processing |
|
|
IS |
Information Services |
|
|
OE |
Office Equipment |
|
|
PM |
Program Administration |
|
|
ST |
Secretarial, Stenographic and Typing |
|
|
WP |
Welfare Program |
Operational Services (SV)
|
FR |
Firefighters |
|
|
GL |
General Labour and Trades |
|
|
GS |
General Services |
|
|
HP |
Heating, Power and Stationary Plant Operations |
|
|
HS |
Hospital Services |
|
|
LI |
Lightkeepers |
|
|
SC |
Ships' Crew |
|
|
PR(SUP) |
Printing Operations ( Supervisory) |
Technical Services (TC) Services techniques
|
DD |
Drafting and Illustration |
|
|
EG |
Engineering and Scientific Support |
|
|
GT |
General Technical |
|
|
PY |
Photography |
|
|
PI |
Primary Products Inspection |
|
|
TI |
Technical Inspection |
Education and Library Science (EB)
|
ED |
Education |
|
|
LS |
Library Science |
|
|
EU |
Educational Support |
Professional Institute of the Public Service of Canada (PIPSC)
Auditing, Commerce and Purchasing (AV)
|
AU |
Auditing |
|
|
CO |
Commerce |
|
|
PG |
Purchasing |
Computer Systems (CS)
Law (LA)
Research (RE)
|
HR |
Historical Research |
|
|
MA |
Mathematics |
|
|
SE |
Scientific Research |
|
|
DS |
Defence Scientific Service |
Health Services (SH)
|
DE |
Dentistry |
|
|
ND |
Nutrition and Dietetics |
|
|
MD |
Medicine |
|
|
NU |
Nursing |
|
|
OP |
Occupational and physical Therapy |
|
|
PH |
Pharmacy |
|
|
PS |
Psychology |
|
|
SW |
Social Work |
|
|
VM |
Veterinary Medicine |
Applied Science and Engineering (AP)
|
AC |
Actuarial Science |
|
|
AG |
Agriculture |
|
|
AR |
Architecture and Town Planning |
|
|
BI |
Biological Science |
|
|
CH |
Chemistry |
|
|
EN |
Engineering and Land Survey |
|
|
FO |
Forestry |
|
|
MT |
Meteorology |
|
|
PC |
Physical Sciences |
|
|
SG-SRE |
Scientific Regulation |
|
|
SG-PAT |
Patent |
Canadian Association of Professional Employees (CAPE) /
Translation (TR)
Economics and Social Sciences Services (EC)
|
ES |
Economics, Sociology and Statistics |
|
|
SI |
Social Science Support |
Union of Canadian Correctional Officers
Correctional Services (CX)
Association of Public Service Financial Administrators (APSFA)
Financial Management (FI)
International Brotherhood of Electrical Workers, Local 2228 (IBEW)
Electronics (EL)
The Professional Association of Foreign Service Officers (PAFSO)
Foreign Service (FS)
Canadian Merchant Service Guild (CMSG)
Ships' Officers (SO)
Federal Government Dockyard Trades and Labour Council (East) - (FGDTLC) (E)
Ship Repair East (SR-E)
Federal Government Dockyard Trades and Labour Council (West) - (FGDTLC(W))
Ship Repair West (SR-W)
Canadian Federal Pilots Association (CFPA)
Aircraft Operations (AO)
CAW Local 2182
Radio Operations (RO)
The Canadian Military Colleges Faculty Association (CMCFA)
University Teachers (UT)
Federal Government Dockyard Chargehands Association (FGDCA)
Ship Repair (Chargehands) (SRC)
Graphic Communications International Union – local 588 M (GCIU)
Printing Operation (non-sup) (PR)
Canadian Air Traffic Control Association (CATCA)
Air Traffic Control (AI)
Appendix F
List of monetary benefits (other than economic increases) negotiated between 1997 and 2003
LIST OF MONETARY BENEFITS NEGOTIATED BETWEEN 1997 AND 2003
January 1 - December 31, 2003
|
Group/Bargaining Agent |
Population |
Duration in months |
Expiry Date |
% Wage Increases |
ECONOMIC INCREASES |
|
Radio Operations (RO) |
362 |
36.00 |
30/04/2004 |
2.8, 2.5 & 2.3 |
Restructure (May 1, 2001) |
|
Computer Systems (CS) |
9330 |
31.68 |
21/12/2004 |
0.4, 3.6 & 2.5 |
Restructure (May 2003) |
|
Air Traffic Control (AI) |
9 |
36.00 |
30/06/2003 |
3.2, 2.8 & 2.5 |
Restructure (June 01, 2000) |
|
Aircraft Operations (AO) |
426 |
36.00 |
25/01/2004 |
3.2, 2.8 & 2.5 |
Restructure (Jan. 26, 2001,02 & 03) & |
|
Non-Supervisory Printing Services (PR(NS)) |
48 |
36.00 |
30/09/2005 |
2.5, 2.5 & 2.5 |
|
|
Applied Science & Engineering (AP) |
7022 |
36.00 |
30/09/2005 |
2.75, 2.5 & 2.5 |
Harmonization (Oct.1, 2002) AG, BI & CH groups |
|
AC-201 |
4 |
36.00 |
30/09/2005 |
2.75, 2.5 & 2.5 |
Restructure (Oct. 1, 2002) |
|
AG-202 |
8 |
36.00 |
30/09/2005 |
2.75, 2.5 & 2.5 |
Harmonization (Oct.1, 2002) & |
|
AR-203 |
195 |
36.00 |
30/09/2005 |
2.75, 2.5 & 2.5 |
Restructure (Oct. 1, 2002) & |
|
BI-205 |
1455 |
36.00 |
30/09/2005 |
2.75, 2.5 & 2.5 |
Harmonization (Oct.1, 2002) & |
|
CH-206 |
409 |
36.00 |
30/09/2005 |
2.75, 2.5 & 2.5 |
Harmonization (Oct.1, 2002) & |
|
EN-210 |
2216 |
36.00 |
30/09/2005 |
2.75, 2.5 & 2.5 |
Restructure (Oct. 1, 2002) & |
|
FO-211 |
101 |
36.00 |
30/09/2005 |
2.75, 2.5 & 2.5 |
Restructure (Oct. 1, 2002) |
|
MT-218 |
462 |
36.00 |
30/09/2005 |
2.75, 2.5 & 2.5 |
Restructure (Oct. 1, 2002) |
|
PC-222 |
1695 |
36.00 |
30/09/2005 |
2.75, 2.5 & 2.5 |
Restructure (Oct. 1, 2002) |
|
SG-224 |
303 |
36.00 |
30/09/2005 |
2.75, 2.5 & 2.5 |
Restructure (Oct. 1, 2002) |
|
SG(PAT)-230 |
174 |
36.00 |
30/09/2005 |
2.75, 2.5 & 2.5 |
Restructure (Oct. 1, 2002) & |
|
University Teaching (UT) |
131 |
24.00 |
30/06/2004 |
2.75 & 2.50 |
Restructure (Jul. 1, 2002) & |
LIST OF MONETARY BENEFITS NEGOTIATED BETWEEN 1997 AND 2003
January 1 - December 31, 2002
|
Group/Bargaining Agent |
Population |
Duration in months |
Expiry Date |
% Wage Increases |
ECONOMIC INCREASES |
|
Ship Repair Chargehand and Production Supervisor Employees Located on the East Coast (SRC) |
68 |
36.00 |
3/31/2003 |
3.2, 2.8 & 2.5 |
Restructure (Zone reduction) |
|
Ship Repair East (SRE) |
583 |
36.00 |
12/31/2003 |
3.2, 2.8 & 2.5 |
Restructure (Zone reduction) |
|
Law (LA) |
78 |
36.00 |
2/28/2004 |
5.14, 2.8 & 2.5 |
|
|
Ships' Officers (SO) |
900 |
36.00 |
3/31/2003 |
3.2, 2.8 & 2.5 |
|
|
Electronics (EL) |
1084 |
36.00 |
8/31/2004 |
2.8, 2.5 & 2.3 |
Restructure (September 1, 2001) |
|
Foreign Services (FS) |
1053 |
24.00 |
6/30/2003 |
2.8, & 2.5 |
Restructure (July 1, 2001) |
|
Financial Management (FI) |
2404 |
36.00 |
11/6/2004 |
2.8, 2.5 & 2.3 |
Restructure (November 7, 2002) |
LIST OF MONETARY BENEFITS NEGOTIATED BETWEEN 1997 AND 2003
January 1 - December 31, 2001
|
Group/Bargaining Agent |
Population |
Duration in months |
Expiry Date |
% Wage Increases |
ECONOMIC INCREASES |
|
Financial Management (FI) |
1,919 |
24.00 |
06/11/2001 |
2.0 & 2.5 |
Lump Sum $800 to all employees in lieu of |
|
Printing Operations (NS) (PR) |
83 |
24.00 |
30/09/2002 |
2.5 & 2.5 |
|
|
Correctional Services (S&NS) (CX) |
5,147 |
24.00 |
31/05/2002 |
2.0 & 2.5 |
Restructure June 1, 2000 & June 1, 2001. |
|
Economics and Social Science Services (EC) |
5,991 |
36.00 |
21/06/2003 |
2.5, 2.5 & 2.5 |
Restructure June 22, 2000 & June 22, 2001 |
|
Translation (TR) |
821 |
36.00 |
18/04/2003 |
2.5, 2.5 & 2.5 |
Restructure April 19, 2000 - Increase by 2.25% the last step of TR-2 & TR-3 and by 2.00% TR-4. |
|
Computer Systems (CS) |
7,771 |
24.00 |
30/04/2002 |
2.5 & 2.5 |
Restructure - add a step at CS-2 to CS-5& delete a step at CS-2 to CS-5 May 1, 2000. |
|
University Teaching (UT) |
127 |
24.00 |
30-06-2002 |
2.5 & 2.5 |
Restructure add 1 step June 1, 2001 |
|
Education & Library Science (EB) |
924 |
36.00 |
30-06-2003 |
3.2, 2.8 & 2.5 |
|
|
Program & Administrative Services (PA) |
58,813 |
36.00 |
20/Jun/2003 |
3.2, 2.8 & 2.5 |
Restructure WP June 21, 2000 & June 21, 2001 & AS, PM & IS ranges consolidated June 21, 2001 |
|
Operational Services (SV) |
10,752 |
36.00 |
04-08-2003 |
3.2, 2.8 & 2.5 |
GL, GS & HS Zone reduction to 3 zones |
|
Technical Services (TC) |
8,901 |
36.00 |
21/Jun/2003 |
3.2, 2.8 & 2.5 |
Terminable Allowance continued for TI and PI |
|
Research (RE) |
2,456 |
36.00 |
30/09/2003 |
3.2, 2.8 & 2.5 |
Terminable Allowance |
|
Ship Repair West (SRW) |
529 |
36.00 |
30/Sep/2003 |
3.2, 2.8 & 2.5 |
Lump sum signing bonus |
|
Audit, Commerce and Purchasing (AV) |
4,035 |
36.00 |
21/Jun/2003 |
3.2, 2.8 & 2.5 |
|
|
Health Services (SH) |
1,465 |
36.00 |
30/Sep/2003 |
3.2, 2.8 & 2.5 |
Consolidation & Terminable Allowance |
LIST OF MONETARY BENEFITS NEGOTIATED BETWEEN 1997 AND 2003
January 1 - December 31, 2000
|
Group/Bargaining Agent |
Population |
Duration in months |
Expiry Date |
% Wage Increases |
ECONOMIC INCREASES |
||
|
Translation (TR ) |
747 |
12.0 |
18/04/2000 |
2.0 |
Lump Sum |
||
|
Economics and Social Science Services (EC) |
5,694 |
|
|
|
|
||
|
|
Economics, Sociology and Statistics (ES) |
2,976 |
12.0 |
21/06/2000 |
2.0 |
Lump Sum |
|
|
|
Social Science Support (SI) |
2,718 |
12.0 |
21/06/2000 |
2.0 |
Lump Sum |
|
|
Ship Repair Chargehands and Production Supervisors East (SRC) |
70 |
12.0 |
31/03/2000 |
2.0 |
Lump Sum |
||
|
Health Services (SH) |
1,435 |
|
|
|
|
||
|
|
Dentistry (DE) |
9 |
12.0 |
30/09/2000 |
2.0 |
Lump Sum |
|
|
|
Nutrition and Dietetics (ND) |
21 |
12.0 |
30/09/2000 |
2.0 |
Lump Sum |
|
|
|
Medicine (MD) |
136 |
12.0 |
30/09/2000 |
2.0 |
Lump Sum |
|
|
|
Nursing (NU) |
944 |
12.0 |
30/09/2000 |
2.0 |
Lump Sum |
|
|
|
Occupational and Physical Therapy (OP) |
20 |
12.0 |
30/09/2000 |
2.0 |
Lump Sum |
|
|
|
Pharmacy (PH) |
12 |
12.0 |
30/09/2000 |
2.0 |
Lump Sum |
|
|
|
Psychology (PS) |
235 |
12.0 |
30/09/2000 |
2.0 |
Lump Sum |
|
|
|
Social Work (SW) |
30 |
12.0 |
30/09/2000 |
2.0 |
Lump Sum |
|
|
|
Veterinary Medicine (VM) |
28 |
12.0 |
30/09/2000 |
2.0 |
Lump Sum |
|
|
Education and Library Science (EB) |
957 |
|
|
|
|
||
|
|
Education (ED) |
599 |
12.0 |
30/06/2000 |
2.0 |
Lump Sum |
|
|
|
Library Science (LS) |
356 |
12.0 |
30/06/2000 |
2.0 |
Lump Sum |
|
|
|
Educational Support (EU) |
2 |
12.3 |
30/06/2000 |
2.0 |
Lump Sum |
|
|
Technical Services (TC) |
8,654 |
|
|
|
|
||
|
|
Drafting and Illustration (DD) |
356 |
12.0 |
21/06/2000 |
2.0 |
Lump Sum |
|
|
|
Engineering and Scientific Support (EG) |
5,215 |
12.0 |
21/06/2000 |
2.0 |
Lump Sum |
|
|
|
General Technical (GT) |
1,735 |
12.0 |
21/06/2000 |
2.0 |
Lump Sum |
|
|
|
Photography (PY) |
25 |
12.0 |
21/06/2000 |
2.0 |
Lump Sum |
|
|
|
Primary Products Inspection (PI) |
245 |
12.0 |
21/06/2000 |
2.0 |
Lump Sum |
|
|
|
Technical Inspection (TI) |
1,078 |
12.0 |
21/06/2000 |
2.0 |
Lump Sum |
|
|
Research (RE) |
2,430 |
|
|
|
|
||
|
|
Historical Research (HR) |
126 |
12.0 |
30/09/2000 |
2.0 |
Lump Sum |
|
|
|
Mathematics (MA) |
260 |
12.0 |
30/09/2000 |
2.0 |
Lump Sum |
|
|
|
Scientific Research (SE) |
1,644 |
12.0 |
30/09/2000 |
2.0 |
Lump Sum |
|
|
|
Defence Scientific Service (DS) |
400 |
12.0 |
30/09/2000 |
2.0 |
Lump Sum |
|
|
Ship Repair East (SRE) |
617 |
12.0 |
31/12/2000 |
2.0 |
Lump Sum |
||
|
Radio Operations (RO) |
355 |
12.0 |
30/04/2001 |
2.0 |
Lump Sum |
||
|
Program and Administrative Services (PA) |
84,884 |
|
|
|
|
||
|
|
Administrative Services (AS) |
12,554 |
12.0 |
20/06/2000 |
2.0 |
Lump Sum |
|
|
|
Information Services (IS) |
1,498 |
12.0 |
20/06/2000 |
2.0 |
Lump Sum |
|
|
|
Programme Administration (PM) |
29,455 |
12.0 |
20/06/2000 |
2.0 |
Lump Sum |
|
|
|
Welfare Programmes (WP) |
2,074 |
12.0 |
20/06/2000 |
2.0 |
Lump Sum |
|
|
|
Communications (CM) |
76 |
12.0 |
20/06/2000 |
2.0 |
Lump Sum |
|
|
|
Data Processing (DA) |
1,194 |
12.0 |
20/06/2000 |
2.0 |
Lump Sum |
|
|
|
Clerical and Regulatory (CR) |
34,104 |
12.0 |
20/06/2000 |
2.0 |
Lump Sum |
|
|
|
Office Equipment (OE) |
28 |
12.0 |
20/06/2000 |
2.0 |
Lump Sum |
|
|
|
Secretarial, Stenographic & Typing (ST) |
3,901 |
12.0 |
20/06/2000 |
2.0 |
Lump Sum |
|
|
Operational Services (SV) |
11,160 |
|
|
|
|
||
|
|
Firefighters (S&NS) (FR) |
483 |
12.0 |
04/08/2000 |
2.0 |
Lump Sum |
|
|
|
General Labour & Trades (S&NS) (GL) |
5,266 |
12.0 |
04/08/2000 |
2.0 |
Lump Sum |
|
|
|
General Services (S&NS) (GS) |
3,072 |
12.0 |
04/08/2000 |
2.0 |
Lump Sum |
|
|
|
Heating, Power & Stationary Plant Operations (S&NS) (HP) |
522 |
12.0 |
04/08/2000 |
2.0 |
Lump Sum |
|
|
|
Hospital Services (S&NS) (HS) |
453 |
12.0 |
04/08/2000 |
2.0 |
Lump Sum |
|
|
|
Lightkeepers (S&NS) (LI) |
97 |
12.0 |
04/08/2000 |
2.0 |
Lump Sum |
|
|
|
Ship Crews (S&NS) (SC) |
1,267 |
12.0 |
04/08/2000 |
2.0 |
Lump Sum |
|
|
Printing Operations (Supervisory) (PR(S)) |
15 |
12.0 |
04/08/2000 |
2.0 |
Lump Sum |
||
|
Foreign Service (FS) |
993 |
24.0 |
30/06/2001 |
2.0 & 2.5 |
FS-1 In-range Relativity with FSDP |
||
|
Electronics (EL) |
1,120 |
24.0 |
31/08/2001 |
2.0 & 2.5 |
Restructure. Add a step to max of all levels in the first year |
||
|
Applied Science and Engineering (AP) |
5,793 |
|
|
|
|
||
|
|
Actuarial Science (AC) |
8 |
36.0 |
30/09/2002 |
2.0, 2.5 & 2.5 |
Restructure, effective October 1, 2000, add 2 steps to AC-1&2 and 3 steps to AC-3 |
|
|
|
Agriculture (AG) |
10 |
36.0 |
30/09/2002 |
2.0, 2.5 & 2.5 |
|
|
|
|
Architecture & Town Planning (AR) |
158 |
36.0 |
30/09/2002 |
2.0, 2.5 & 2.5 |
Terminable Allowance to all employees 2nd & 3rd year. |
|
|
|
Biological Science (BI) |
1,120 |
36.0 |
30/09/2002 |
2.0, 2.5 & 2.5 |
|
|
|
|
Chemistry (CH) |
384 |
36.0 |
30/09/2002 |
2.0, 2.5 & 2.5 |
|
|
|
|
Engineering & Land Survey (EN) |
1,848 |
36.0 |
30/09/2002 |
2.0, 2.5 & 2.5 |
Terminable Allowance to all employees 2nd & 3rd year. |
|
|
|
Forestry (FO) |
92 |
36.0 |
30/09/2002 |
2.0, 2.5 & 2.5 |
|
|
|
|
Meteorology (MT) |
432 |
36.0 |
30/09/2002 |
2.0, 2.5 & 2.5 |
Restructure, Effective October 1, 2000, add 1 step to MT-3 and 2 steps to MT-4 to 7. |
|
|
|
Physical Sciences (PC) |
1,379 |
36.0 |
30/09/2002 |
2.0, 2.5 & 2.5 |
|
|
|
|
Scientific Regulation (SG) |
231 |
36.0 |
30/09/2002 |
2.0, 2.5 & 2.5 |
|
|
|
|
Patent Sub-Group (SG-PAT) |
131 |
36.0 |
30/09/2002 |
2.0, 2.5 & 2.5 |
Restructure, effective October 1, 2000 add 1 step to SG-PAT-6 and 2 steps to SG-PAT-7. |
|
LIST OF MONETARY BENEFITS NEGOTIATED BETWEEN 1997 AND 2003
January 1 - December 31, 1999
|
Group/Bargaining Agent |
Population |
Duration in months |
Expiry Date |
% Wage Increases |
ECONOMIC INCREASES |
|
Ship Repair (W) SR(W) |
525 |
24.0 |
30/09/2000 |
2.5 & 2.0 |
Restructure (The cost will be recovered from the Department of National Defence.) |
|
Dentistry(DE) |
9 |
24.0 |
30/09/1999 |
2.5 & 2.0 |
|
|
Medicine(MD) |
152 |
30.4 |
30/09/1999 |
1.08, 2.5 & 2.0 |
|
|
Pharmacy(PH) |
24 |
24.0 |
30/09/1999 |
2.5 & 2.0 |
|
|
Drafting and Illustration (DD) |
602 |
27.3 |
21/06/1999 |
0.599, 2.0 & 2.0 |
Restructure (Add a new maximum step) June 22, 98 |
|
Engineering and Scientific Support (EG) |
5,996 |
24.0 |
21/06/1999 |
2.0 & 2.0 |
Restructure (Add a new maximum step) June 22, 98 |
|
General Technical (GT) |
2,420 |
24.0 |
21/06/1999 |
2.0 & 2.0 |
Restructure (Add a new maximum step) June 22, 98 |
|
Photography (PY) |
33 |
27.2 |
21/06/1999 |
0.589, 2.0 & 2.0 |
Restructure (Add a new maximum step) June 22, 98 |
|
Primary Products Inspection (PI) |
463 |
25.9 |
21/06/1999 |
0.336, 2.0 & 2.0 |
Restructure (Add a new maximum step) June 22, 98 |
|
Technical Inspection (TI) |
1,112 |
24.0 |
21/06/1999 |
2.0 & 2.0 |
Restructure (Add a new maximum step) June 22, 98 |
|
Correctional Services (S&NS) (CX) |
4,752 |
36.0 |
31/05/2000 |
2.5, 2.0 & 2.0 |
Restructure (Add a new maximum step) June 1, 97 |
|
Ship Repair - East (SRE) |
859 |
24.0 |
31/12/1999 |
2.5 & 2.0 |
Restructure (Jan. 1, 98) |
|
Firefighters (S&NS) (FR) |
733 |
25.1 |
04/08/1999 |
0.1918, 2.75, 2.0 & 0.271 |
|
|
General Labour and Trades (S&NS) (GL) |
8,416 |
27.0 |
04/08/1999 |
0.5041, 2.75 2.0 & 0.314 |
Zone reduction (Aug. 5, 97) |
|
General Services (S&NS) (GS) |
4,328 |
24.0 |
04/08/1999 |
2.75, 2.0 & 0.355 |
Zone reduction (Aug. 5, 97) |
|
Heating, Power & Stationary Plant Operations (S&NS) (HP) |
754 |
27.9 |
04/08/1999 |
0.6575, 2.75 2.0 & 0.3 |
|
|
Hospital Services (S&NS) (HS) |
552 |
25.4 |
04/08/1999 |
0.2411, 2.75 2.0 & 0.329 |
Special Pay Adjustment for HS-PHS (First year) |
|
Lightkeepers (S&NS) (LI) |
116 |
25.5 |
04/08/1999 |
0.2521, 2.75 2.0 & 0.351 |
|
|
Ships' Crews (S&NS) (SC) |
1,471 |
19.1 |
04/08/1999 |
2.75, 2.0 & 0.297 |
|
|
Auditing (AU) |
5,163 |
12.0 |
04/05/2000 |
2.0 |
|
|
Radio Operations (RO) |
326 |
24.0 |
30/04/2000 |
2.5 & 2.0 |
|
|
Printing Operations (NS) (PR) |
131 |
24.0 |
30/09/2000 |
2.5 & 2.0 |
|
|
Law (LA) |
56 |
24.0 |
01/02/2001 |
2.0 & 2.0 |
Restructure (delete steps at min.) |
|
Printing Operations (S) (PR) |
15 |
12.0 |
30/09/1999 |
2.5 |
|
|
Computer Systems Administration (CS) |
9,072 |
12.0 |
30/04/2000 |
2.0 |
Restructure (add one step at max.) and TA Adjustments |
|
University Teaching (UT) |
135 |
24.0 |
30/06/2000 |
2.5 & 1.17 |
Restructure - add step to UT-1 to 4(partially paid by National Defence) |
|
Air Traffic Control (AI) |
24 |
30.0 |
30/06/2000 |
1.73, 2.0 & 1.0 |
Restructure range and add 1 step at maximum |
|
Auditing (AU) |
5,269 |
1.6 |
21/06/2000 |
0.26 |
|
|
Commerce (CO) |
2,009 |
8.7 |
21/06/2000 |
1.45 |
|
|
Purchasing and Supply (PG) |
1,753 |
12.0 |
21/06/2000 |
2.0 |
|
|
Aircraft Operations (AO) |
429 |
27.0 |
25/01/2001 |
2.5 & 2.0 |
Recruitment and Retention (includes a restructure for CAI-4 & 5 and increment movement, Recruitment and Retention Allowance, EDA Improvement and a Retention Bonus) |
LIST OF MONETARY BENEFITS NEGOTIATED BETWEEN 1997 AND 2003
January 1 - December 31, 1998
|
Group/Bargaining Agent |
Population |
Duration in months |
Expiry Date |
% Wage Increases |
ECONOMIC INCREASES |
|
University Teachers (UT) |
150 |
12.0 |
30/06/1998 |
2.0 |
$350 signing bonus |
|
Social Science Support (SI) |
2,353 |
24.0 |
21/06/1999 |
1.8 & 2.0 |
Restructure |
|
Electronics (EL) |
1,256 |
24.0 |
31/08/1999 |
2.5 & 2.0 |
|
|
Economics, Sociology & Statistics (ES) |
2,815 |
13.6 |
21/06/1999 |
1.95 & 0.27 (49 days) |
Restructure |
|
Foreign Service (FS) |
1,015 |
26.0 |
30/06/1999 |
2.5, 2.0 & 0.33 (2 mths) |
Restructure |
|
Ship Repair - Chargehands (SRC) |
88 |
12.0 |
31/03/1999 |
2.5 |
|
|
Translation (TR) |
711 |
24.0 |
18/04/1999 |
1.34 & 1.64 |
Restructure |
|
Auditing (AU) |
4,801 |
24.0 |
04/05/1999 |
2.5 & 2.0 |
Restructure - add step at max to address retention problems. |
|
Financial Management (FI) |
2,042 |
24.0 |
06/11/1999 |
2.5 & 2.0 |
3.45% Increase -reflects hours of work to 7.5 daily |
|
Actuarial Science (AC) |
7 |
24.0 |
30/09/1999 |
2.5 & 2.0 |
Restructure rate scale of AC-1 to introduce half increments (Oct. 1, 97) |
|
Agriculture (AG) |
209 |
24.0 |
30/09/1999 |
2.5 & 2.0 |
|
|
Architecture & Town Planning (AR) |
228 |
21.0 |
30/09/1999 |
1.87 & 2.0 |
|
|
Biological Science (BI) |
1,197 |
24.0 |
30/09/1999 |
2.5 & 2.0 |
|
|
Chemistry (CH) |
457 |
21.8 |
30/09/1999 |
1.93 & 2.0 |
|
|
Engineering & Land Survey (EN) |
2,073 |
24.3 |
30/09/1999 |
0.049, 2.5 & 2.0 |
|
|
Forestry (FO) |
108 |
24.0 |
30/09/1999 |
2.5 & 2.0 |
|
|
Meteorology (MT) |
464 |
24.0 |
30/09/1999 |
2.5 & 2.0 |
Salary adjustment of $2500 to the MT-3 level (Oct. 1, 97) |
|
Physical Sciences (PC) |
1,304 |
27.5 |
30/09/1999 |
0.586, 2.5 & 2.0 |
|
|
Scientific Regulation (SG) |
372 |
24.0 |
30/09/1999 |
2.5 & 2.0 |
Restructure add 1 step to max of levels SRE 2 to 8 and salary adjustement of 2% increase to levels SRE 1 to 3 & SRE 6 to 8 and a 4% increase to levels SRE 4 & 5 (Oct. 1, 97) |
|
Patent Sub-Group (SG-PAT) |
130 |
17.1 |
30/09/1999 |
1.04 & 2.0 |
Restructure add a step to max of levels PAT 3 to 7 (May 2, 98) |
|
Ship's Officers (SO) |
885 |
24.0 |
31/03/2000 |
2.5 & 2.0 |
|
|
Nutrition and Dietetics (HE/ND) |
18 |
24.0 |
30/09/1999 |
2.5 & 2.0 |
|
|
Nursing (NU) |
1,038 |
24.0 |
30/09/1999 |
2.5 & 2.0 |
|
|
Occupational and Physical Therapy (OP) |
21 |
24.0 |
30/09/1999 |
2.5 & 2.0 |
|
|
Psychology (PS) |
210 |
29.0 |
30/09/1999 |
0.91, 2.5 & 2.0 |
|
|
Social Work (SW) |
48 |
24.0 |
30/09/1999 |
2.5 & 2.0 |
|
|
Veterinary Medicine (VM) |
28 |
24.0 |
30/09/1999 |
2.5 & 2.0 |
|
|
Commerce (CO) |
1,865 |
24.0 |
30/09/1999 |
2.5 & 2.0 |
|
|
Historical Research (HR) |
228 |
24.0 |
30/09/1999 |
2.5 & 2.0 |
|
|
Mathematics (MA) |
243 |
24.0 |
30/09/1999 |
2.5 & 2.0 |
|
|
Scientific Research (SE) |
1,762 |
24.0 |
30/09/1999 |
2.5 & 2.0 |
Terminable Allowances: Effective October 1, 1999 until September 30, 2000 for employees who are working at the Communications Research Centre |
|
Defence Scientific Service (DS) |
383 |
24.0 |
30/09/1999 |
2.5 & 2.0 |
Terminable Allowances: Effective October 1, 1999 until September 30, 2000 |
|
Purchasing and Supply (PG) |
1,828 |
24.0 |
21/06/1999 |
2.5 & 2.0 |
|
|
Education (ED) |
728 |
22.0 |
30/06/1999 |
2.5 & 2.0 |
Restructure (deletion of minimum step to all levels) (April 1, 99) |
|
Library Science (LS) |
383 |
27.0 |
30/06/1999 |
0.50, 2.5 & 2.0 |
Special Pay Adjustments & 1980 Equalization Payment into rates of pay |
|
Administrative Services (AS) |
10,764 |
24.0 |
20/06/1999 |
2.5 & 2.0 |
Restructure (deletion of minimum step) April 1, 99 |
|
Information Services (IS) |
1,328 |
23.9 |
20/06/1999 |
2.5 & 2.0 |
Restructure (deletion of minimum step) April 1, 99 |
|
Programme Administration (PM) |
29,391 |
24.0 |
20/06/1999 |
2.5 & 2.0 |
Restructure (deletion of minimum step) April 1, 99 |
|
Welfare Programmes (WP) |
1,733 |
18.9 |
20/06/1999 |
2.5 & 2.0 |
Restructure (deletion of minimum step) April 1, 99 |
|
Educational Support (EU) |
2 |
27.7 |
20/06/1999 |
0.77, 2.5 & 2.0 |
Special Pay Adjustments |
|
Communications (CM) |
113 |
24.0 |
20/06/1999 |
2.5 & 2.0 |
Restructure (deletion of minimum step) April 1, 99 |
|
Data Processing (DACON) |
424 |
21.7 |
20/06/1999 |
2.5 & 1.62 |
Special Pay Adjustments |
|
Data Processing (DAPRO) |
703 |
21.7 |
20/06/1999 |
2.5 & 2.0 |
Restructure (deletion of minimum step) April 1, 99 |
|
Clerical & Regulatory (CR) |
37,462 |
24.3 |
20/06/1999 |
0.055, 2.5 & 2.0 |
Special Pay Adjustments |
|
Office Equipment (OE) |
58 |
25.4 |
20/06/1999 |
0.29, 2.5 & 2.0 |
Restructure (deletion of minimum step) April 1, 99 |
|
Secretarial, Stenographic & Typing (ST) |
5,527 |
23.0 |
20/06/1999 |
2.5 & 1.83 |
Special Pay Adjustments |
LIST OF MONETARY BENEFITS NEGOTIATED BETWEEN 1997 AND 2003
January 1 - December 31, 1997
|
Group/Bargaining Agent |
Population |
Duration in months |
Expiry Date |
% Wage Increases |
ECONOMIC INCREASES |
|
Ship Repair - Chargehands (SRC) |
102 |
12.0 |
31/03/1998 |
2.0 |
Restructure add step at bottom |
|
Law (LA) |
39 |
24.0 |
28/02/1999 |
2.0 & 2.0 |
Restructure for parity with Justice excluded lawyers |
|
Computer Systems (CS) |
7,540 |
24.0 |
30/04/1999 |
2.5 & 2.0 |
Restructure add step to max of all levels (May 1, 97) |
Appendix G
Analysis for selected classification groups of the distribution of employees by classification level, 1991–2003
AS
|
|
1991 |
1994 |
1998 |
2001 |
2003 |
91/03 |
|
AS0 |
14 |
5 |
4 |
4 |
7 |
-50% |
|
AS1 |
2638 |
3158 |
3371 |
4279 |
5467 |
107% |
|
AS2 |
3638 |
4086 |
3742 |
6059 |
7379 |
103% |
|
AS3 |
2564 |
2549 |
2166 |
2865 |
3384 |
32% |
|
AS4 |
1919 |
1989 |
1510 |
1878 |
2328 |
21% |
|
AS5 |
1626 |
1711 |
1621 |
1822 |
2329 |
43% |
|
AS6 |
1323 |
1321 |
1173 |
1476 |
1750 |
32% |
|
AS7 |
804 |
943 |
827 |
929 |
1080 |
34% |
|
AS8 |
3 |
103 |
116 |
99 |
92 |
2967% |
|
AS20 |
0 |
0 |
0 |
11 |
1 |
- |
|
Total |
14529 |
15865 |
14530 |
19422 |
23817 |
64% |
AS0 and AS20 levels are not shown in the pyramids
CR
|
1991 |
1994 |
1998 |
2001 |
2003 |
91/03 |
|
|
CR1 |
70 |
48 |
35 |
53 |
93 |
33% |
|
CR2 |
9248 |
5908 |
3597 |
2939 |
2472 |
-73% |
|
CR3 |
21009 |
17013 |
12225 |
11673 |
10546 |
-50% |
|
CR4 |
22228 |
23391 |
20022 |
20644 |
20150 |
-9% |
|
CR5 |
7275 |
7362 |
6418 |
8813 |
9974 |
37% |
|
CR6 |
339 |
253 |
126 |
87 |
92 |
-73% |
|
CR7 |
3 |
3 |
2 |
2 |
1 |
-67% |
|
Total |
60172 |
53978 |
42425 |
44211 |
43328 |
-28% |
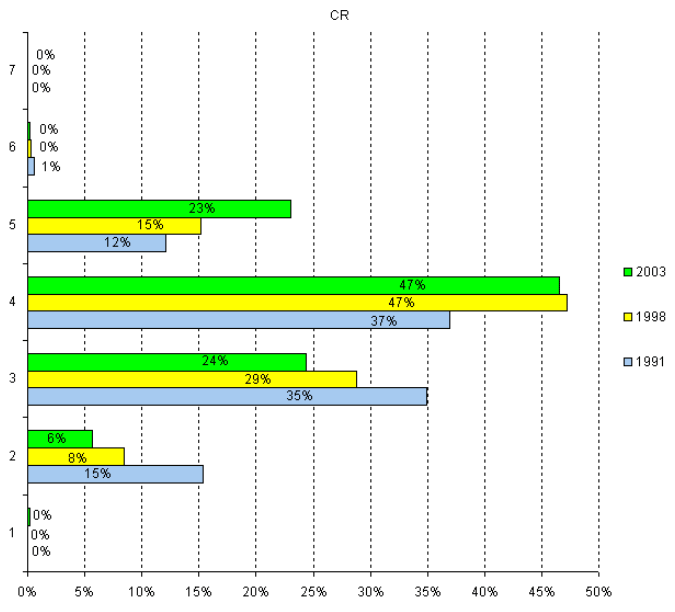
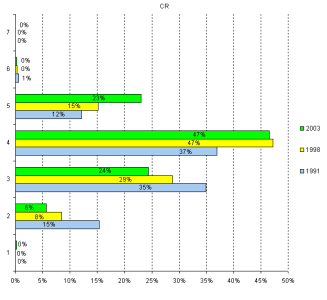
CS
|
|
1991 |
1994 |
1998 |
2001 |
2003 |
91/03 |
|
CS1 |
1059 |
1435 |
2533 |
3216 |
3622 |
242% |
|
CS2 |
2549 |
3394 |
3902 |
5065 |
6323 |
148% |
|
CS3 |
1465 |
1787 |
2303 |
2967 |
3833 |
162% |
|
CS4 |
427 |
510 |
615 |
982 |
1057 |
148% |
|
CS5 |
16 |
44 |
69 |
212 |
262 |
1538% |
|
Total |
5516 |
7170 |
9422 |
12442 |
15097 |
174% |
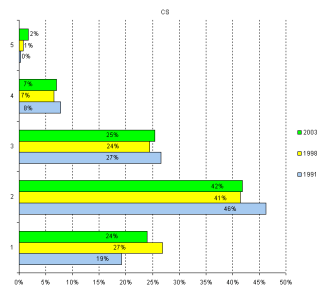
CX
|
|
1991 |
1994 |
1998 |
2001 |
2003 |
91/03 |
|
CX1 |
2275 |
2083 |
2295 |
2572 |
2872 |
26% |
|
CX2 |
1968 |
2070 |
2219 |
2694 |
2709 |
38% |
|
CX3 |
307 |
293 |
388 |
489 |
555 |
81% |
|
CX4 |
6 |
2 |
33 |
34 |
35 |
483% |
|
Total |
4556 |
4448 |
4935 |
5789 |
6171 |
|
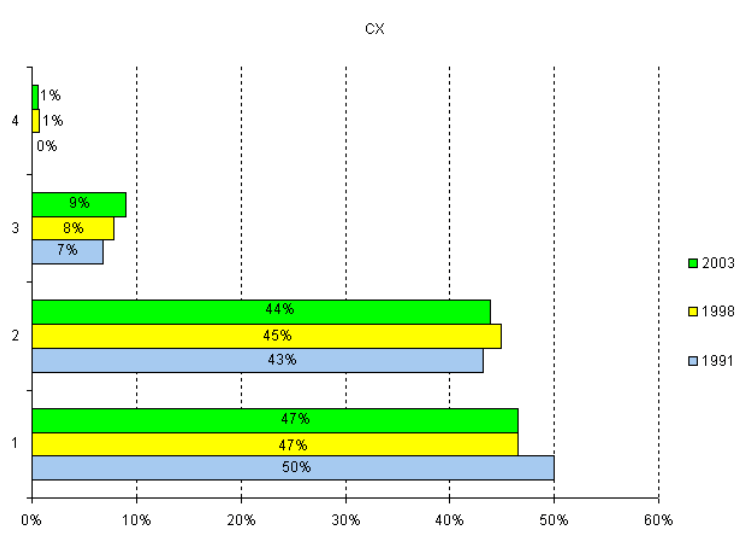
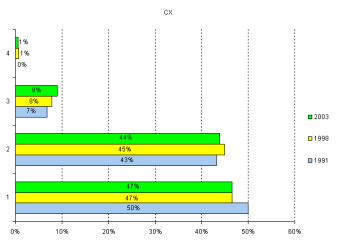
ES
|
|
1991 |
1994 |
1998 |
2001 |
2003 |
91/03 |
|
ES1 |
99 |
60 |
133 |
103 |
25 |
-75% |
|
ES2 |
175 |
169 |
152 |
257 |
357 |
104% |
|
ES3 |
392 |
466 |
375 |
474 |
737 |
88% |
|
ES4 |
622 |
665 |
820 |
1012 |
1199 |
93% |
|
ES5 |
653 |
728 |
771 |
1128 |
1454 |
123% |
|
ES6 |
509 |
597 |
685 |
1058 |
1470 |
189% |
|
ES7 |
170 |
215 |
213 |
285 |
410 |
141% |
|
ES8 |
1 |
0 |
1 |
0 |
1 |
0% |
|
Total |
2621 |
2900 |
3150 |
4317 |
5653 |
116% |
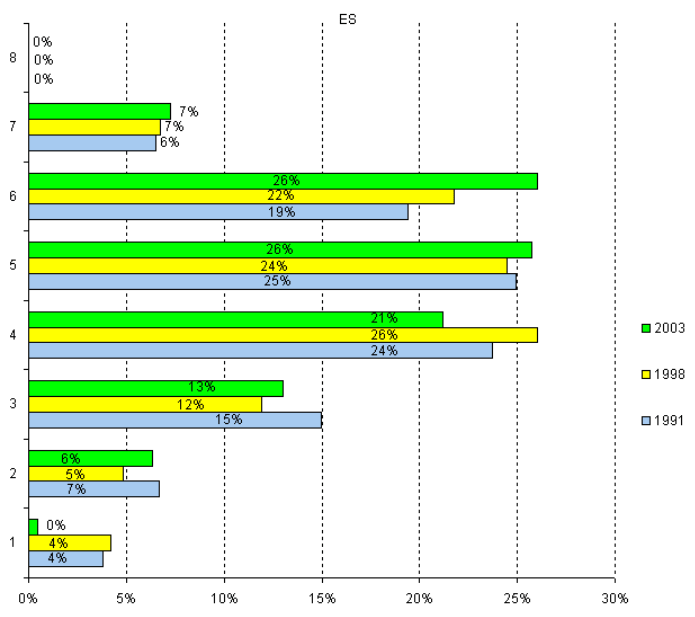
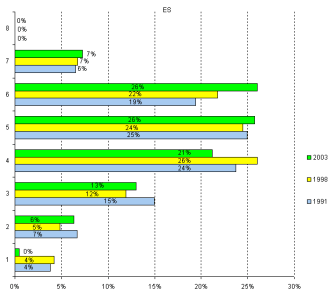
EG
|
|
1991 |
1994 |
1998 |
2001 |
2003 |
91/03 |
|
EG1 |
126 |
114 |
234 |
424 |
427 |
239% |
|
EG2 |
408 |
369 |
460 |
1182 |
1185 |
190% |
|
EG3 |
883 |
983 |
781 |
1306 |
1550 |
76% |
|
EG4 |
1749 |
1736 |
1468 |
2047 |
2323 |
33% |
|
EG5 |
2159 |
2225 |
1656 |
1934 |
2019 |
-6% |
|
EG6 |
1896 |
1810 |
1286 |
1328 |
1412 |
-26% |
|
EG7 |
228 |
253 |
165 |
168 |
164 |
-28% |
|
EG8 |
41 |
33 |
22 |
30 |
38 |
-7% |
|
EG9 |
0 |
0 |
0 |
0 |
0 |
|
|
EG10 |
4 |
3 |
1 |
0 |
0 |
-100% |
|
EG11 |
0 |
1 |
0 |
0 |
0 |
|
|
Total |
7494 |
7527 |
6073 |
8419 |
9118 |
22% |
Note: EG9, EG10 and EG11 are not shown in the following pictures. They are salary protected levels resulting from the EG conversion in December 1987
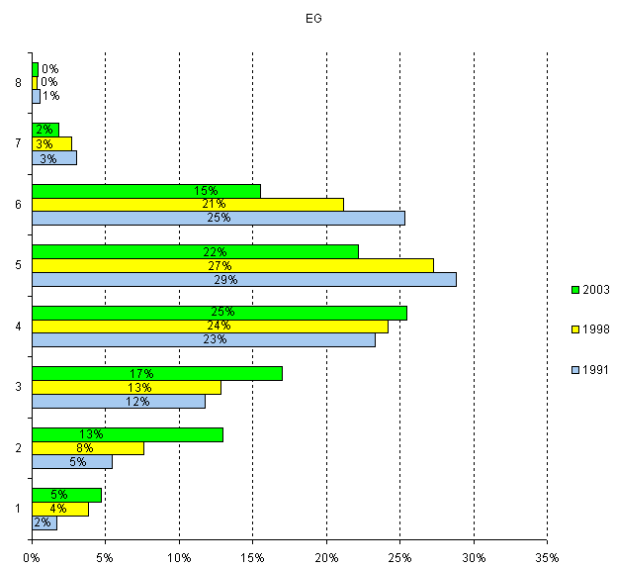
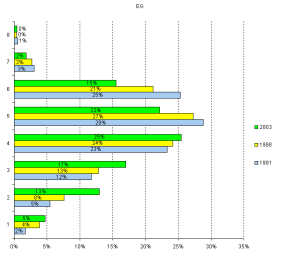
EX
|
|
1991 |
1994 |
1998 |
2001 |
2003 |
91/03 |
|
EX1 |
3193 |
2330 |
1811 |
2138 |
2581 |
-19% |
|
EX2 |
894 |
862 |
775 |
974 |
1226 |
37% |
|
EX3 |
480 |
460 |
468 |
620 |
768 |
60% |
|
EX4 |
234 |
206 |
150 |
202 |
228 |
-3% |
|
EX5 |
84 |
88 |
81 |
77 |
83 |
-1% |
|
Total |
4885 |
3946 |
3285 |
4011 |
4886 |
|
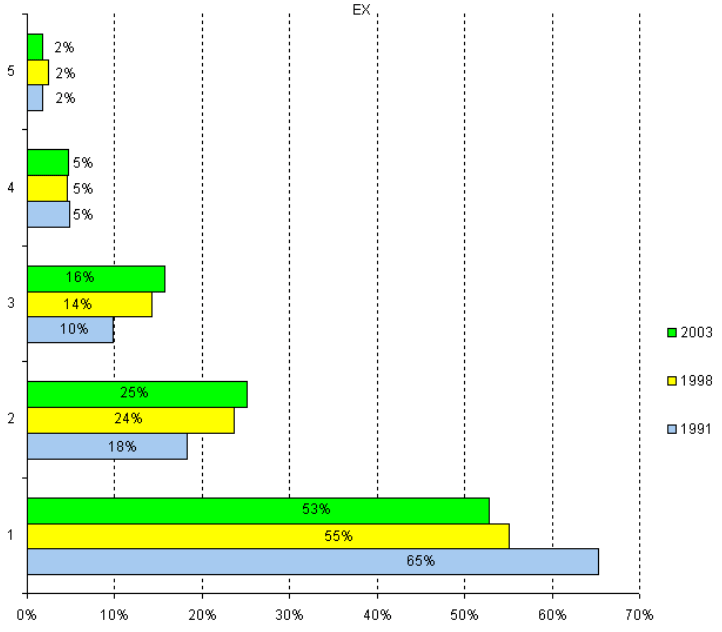
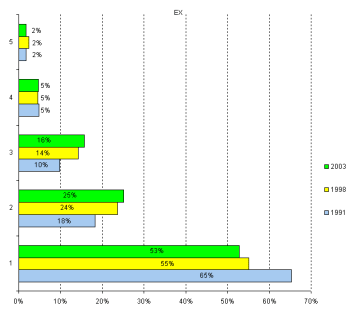
FI
|
|
1991 |
1994 |
1998 |
2001 |
2003 |
91/03 |
|
FI1 |
928 |
930 |
706 |
911 |
996 |
7% |
|
FI2 |
1002 |
961 |
856 |
1037 |
1213 |
21% |
|
FI3 |
626 |
650 |
541 |
661 |
788 |
26% |
|
FI4 |
257 |
292 |
233 |
319 |
394 |
54% |
|
|
4804 |
4827 |
4334 |
4929 |
5394 |
109% |
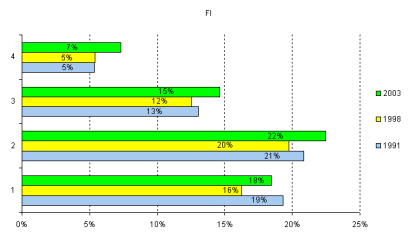
PE
|
|
1991 |
1994 |
1998 |
2001 |
2003 |
91/03 |
|
PE1 |
163 |
126 |
117 |
231 |
238 |
46% |
|
PE2 |
617 |
567 |
352 |
449 |
503 |
-18% |
|
PE3 |
1356 |
1424 |
1301 |
1210 |
1233 |
-9% |
|
PE4 |
635 |
692 |
596 |
883 |
1166 |
84% |
|
PE5 |
342 |
394 |
371 |
536 |
677 |
98% |
|
PE6 |
119 |
142 |
159 |
311 |
391 |
229% |
|
PE7 |
0 |
2 |
1 |
2 |
2 |
|
|
|
3232 |
3347 |
2897 |
3622 |
4210 |
30% |
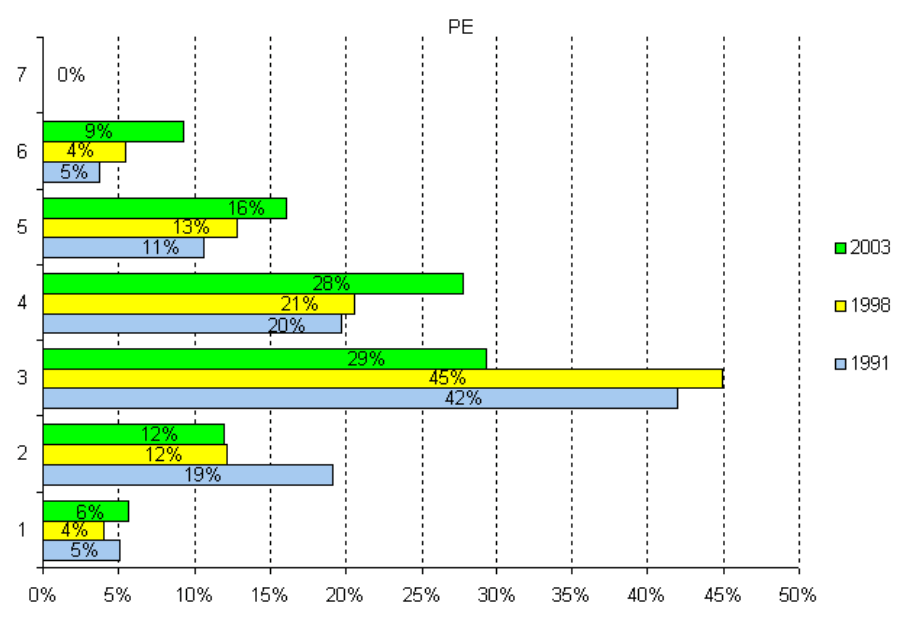
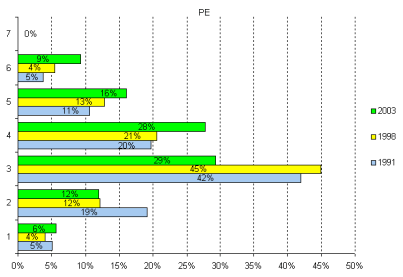
ST
|
|
1991 |
1994 |
1998 |
2001 |
2003 |
91/03 |
|
ST1 |
824 |
448 |
145 |
88 |
52 |
-94% |
|
ST2 |
6761 |
4589 |
1812 |
1102 |
709 |
-90% |
|
ST3 |
4466 |
4004 |
2884 |
2261 |
1262 |
-72% |
|
ST4 |
1043 |
957 |
803 |
537 |
268 |
-74% |
|
ST5 |
21 |
0 |
0 |
0 |
0 |
-100% |
|
ST6 |
1 |
0 |
0 |
0 |
0 |
-100% |
|
Total |
13116 |
9998 |
5644 |
3988 |
2291 |
-83% |
ST5 and ST 6 levels are not shown in the following charts
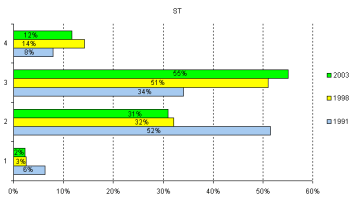
SI
|
|
1991 |
1994 |
1998 |
2001 |
2003 |
91/03 |
|
SI1 |
692 |
705 |
736 |
689 |
566 |
-18% |
|
SI2 |
839 |
816 |
984 |
1212 |
1475 |
76% |
|
SI3 |
494 |
490 |
514 |
689 |
756 |
53% |
|
SI4 |
291 |
317 |
305 |
425 |
435 |
49% |
|
SI5 |
150 |
121 |
153 |
250 |
316 |
111% |
|
SI6 |
65 |
73 |
54 |
87 |
95 |
46% |
|
SI7 |
10 |
14 |
13 |
10 |
32 |
220% |
|
SI8 |
7 |
29 |
36 |
45 |
55 |
686% |
|
Total |
2548 |
2565 |
2795 |
3407 |
3730 |
46% |
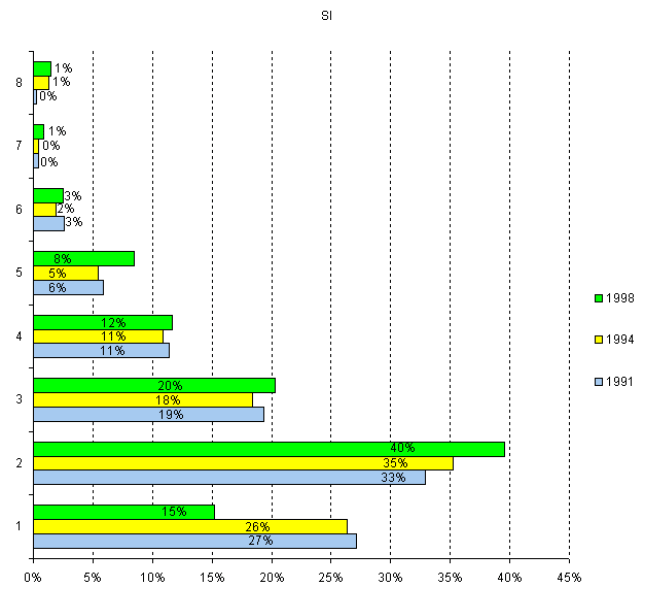
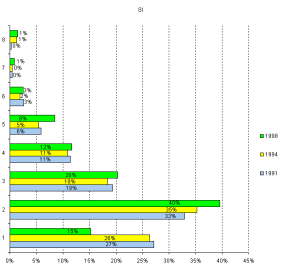
GL-MAN
|
|
1991 |
1994 |
1998 |
2001 |
2003 |
91/03 |
|
GLMAN1 |
1 |
9 |
13 |
0 |
1 |
0% |
|
GLMAN2 |
22 |
25 |
27 |
15 |
15 |
-32% |
|
GLMAN3 |
118 |
77 |
84 |
120 |
93 |
-21% |
|
GLMAN4 |
121 |
94 |
120 |
121 |
118 |
-2% |
|
GLMAN5 |
423 |
315 |
225 |
281 |
302 |
-29% |
|
GLMAN6 |
393 |
371 |
305 |
250 |
236 |
-40% |
|
GLMAN7 |
309 |
304 |
213 |
232 |
235 |
-24% |
|
GLMAN8 |
204 |
205 |
163 |
155 |
147 |
-28% |
|
GLMAN9 |
139 |
131 |
94 |
82 |
92 |
-34% |
|
GLMAN10 |
85 |
58 |
46 |
60 |
68 |
-20% |
|
GLMAN11 |
24 |
22 |
13 |
26 |
24 |
0% |
|
GLMAN12 |
11 |
9 |
9 |
7 |
5 |
-55% |
|
GLMAN13 |
2 |
2 |
2 |
2 |
3 |
50% |
|
Total |
1852 |
1622 |
1314 |
1351 |
1339 |
-28% |
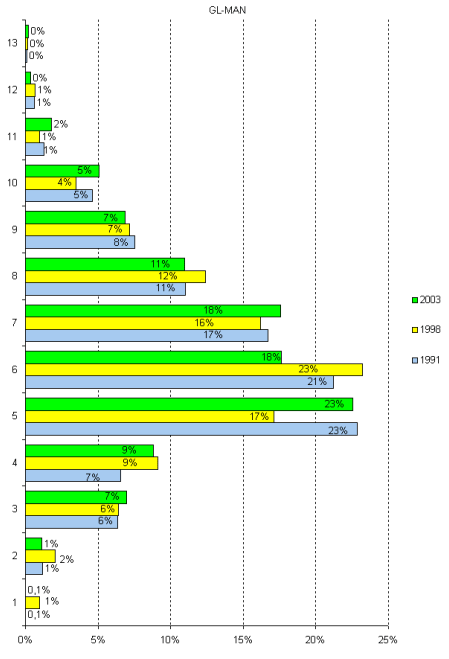
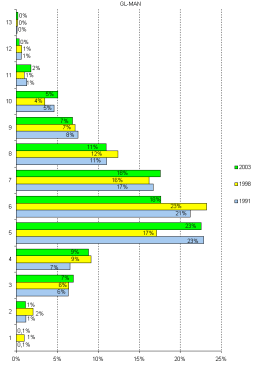
GL-MDO
|
|
1991 |
1994 |
1998 |
2001 |
2003 |
91/03 |
|
GLMDO1 |
0 |
0 |
1 |
0 |
0 |
|
|
GLMDO2 |
1 |
0 |
0 |
0 |
0 |
-100% |
|
GLMDO3 |
82 |
48 |
3 |
3 |
7 |
-91% |
|
GLMDO4 |
841 |
655 |
258 |
160 |
152 |
-82% |
|
GLMDO5 |
539 |
460 |
269 |
184 |
208 |
-61% |
|
GLMDO6 |
1047 |
849 |
513 |
234 |
235 |
-78% |
|
GLMDO7 |
88 |
66 |
56 |
84 |
77 |
-13% |
|
GLMDO8 |
90 |
84 |
21 |
26 |
23 |
-74% |
|
GLMDO9 |
7 |
5 |
2 |
0 |
0 |
-100% |
|
GLMDO10 |
7 |
4 |
3 |
2 |
0 |
-100% |
|
GLMDO11 |
6 |
2 |
0 |
0 |
0 |
-100% |
|
Total |
2708 |
2173 |
1126 |
693 |
702 |
-74% |
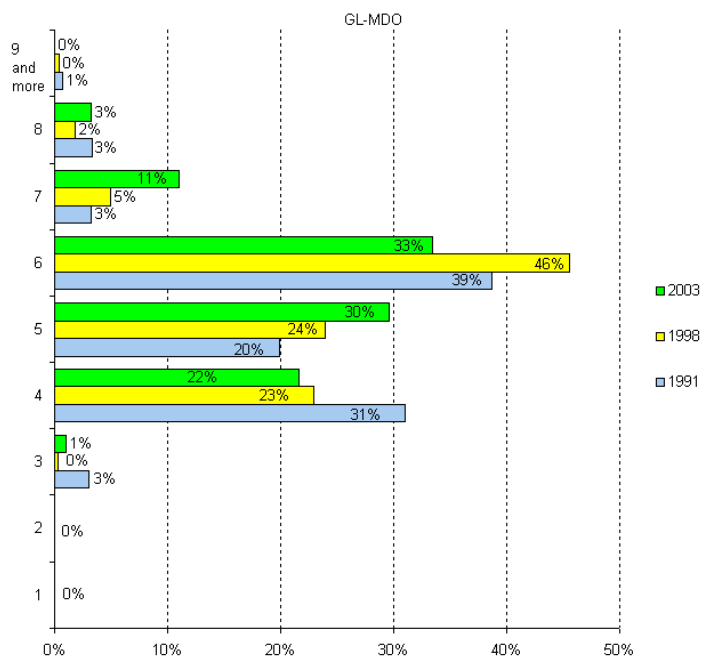
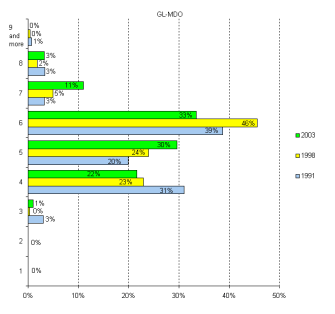
GL-EL
|
|
1991 |
1994 |
1998 |
2001 |
2003 |
91/03 |
|
GLEL1 |
47 |
32 |
66 |
48 |
29 |
-38% |
|
GLEL2 |
918 |
742 |
435 |
273 |
240 |
-74% |
|
GLEL3 |
1029 |
713 |
409 |
306 |
317 |
-69% |
|
GLEL4 |
221 |
226 |
133 |
131 |
98 |
-56% |
|
GLEL5 |
77 |
41 |
35 |
27 |
29 |
-62% |
|
GLEL6 |
20 |
26 |
17 |
21 |
15 |
-25% |
|
GLEL7 |
10 |
3 |
0 |
0 |
0 |
-100% |
|
GLEL8 |
9 |
11 |
1 |
3 |
2 |
-78% |
|
GLEL9 |
8 |
3 |
2 |
0 |
0 |
-100% |
|
GLEL10 |
1 |
5 |
2 |
0 |
0 |
-100% |
|
GLEL11 |
0 |
1 |
1 |
0 |
0 |
|
|
GLEL12 |
1 |
5 |
1 |
0 |
0 |
-100% |
| Total |
2341 |
1808 |
1102 |
809 |
730 |
-69% |
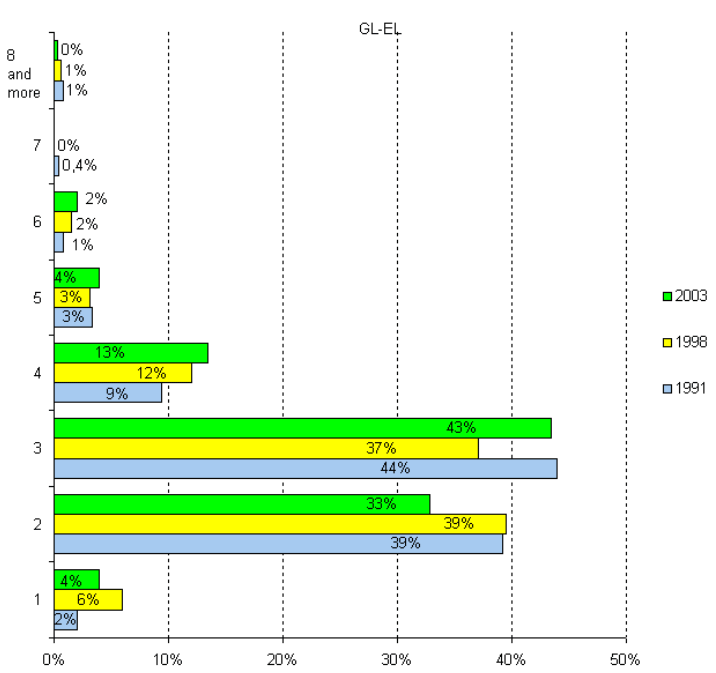
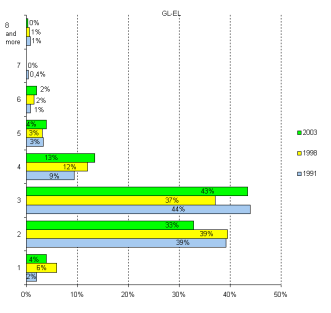
PM
|
|
1991 |
1994 |
1998 |
2001 |
2003 |
91/03 |
|
PM1 |
7 982 |
9 608 |
8 425 |
7 882 |
8 271 |
4% |
|
PM2 |
11 475 |
11 911 |
13 400 |
14 496 |
13 984 |
22% |
|
PM3 |
5 140 |
5 063 |
4 580 |
4 505 |
5 814 |
13% |
|
PM4 |
3 459 |
4 029 |
4 103 |
5 331 |
4 870 |
41% |
|
PM5 |
2 279 |
2 586 |
2 498 |
3 253 |
3 492 |
53% |
|
PM6 |
1 451 |
1 647 |
1 684 |
1 948 |
1 853 |
28% |
|
PM7 |
11 |
2 |
4 |
4 |
3 |
-73% |
|
Total |
31 797 |
34 846 |
34 694 |
37 419 |
38 287 |
20% |
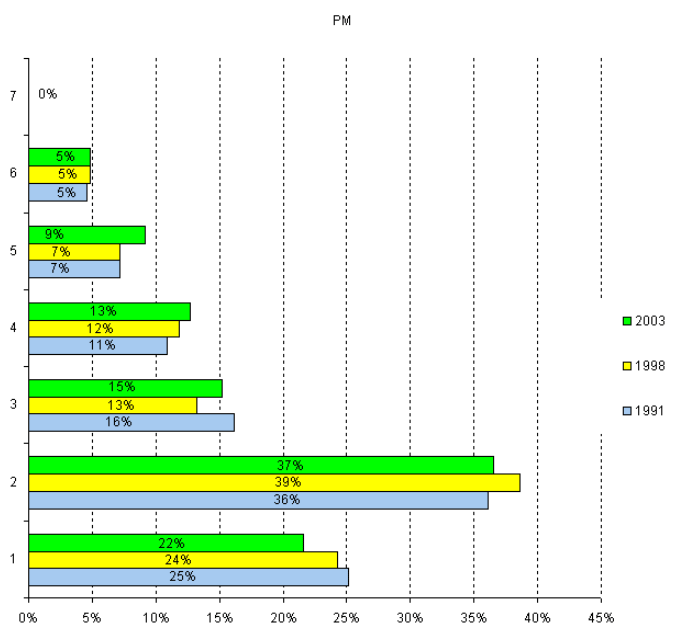
Appendix H
Summary of Resolved Pay Equity Complaints Relating to the Core Public Service up to 2003
Since the enactment of the Canadian Human Rights Act (CHRA) in 1978, the Treasury Board has resolved many complaints in the federal Public Service.
Complaints have most often been resolved through negotiated settlements with individuals or bargaining agents. The early complaints were between single groups and were really more about equal pay for equal or similar work. For example, the Library Services group compared with the Historical Research Group. This type of complaint lent itself to a "group to group" comparison that was relatively straightforward. Later complaints have involved comparisons between several female and male predominant groups that covered a broader range of work and required more complex methodologies.
Resolved Complaints
Group Complaints
- In February 1979, the female predominant Library Sciences (LS) group compared its work to that of the male predominant Historical Research (HR) group. The complaint was resolved in December 1980, and employees were paid an annual pay equity adjustment until April 1997 when the amount was integrated into their salary.
- In November 1979, three female predominant sub-groups (Food Services, Laundry Services, and Miscellaneous Personnel Services) of the General Services (GS) group compared their work to that of the four male predominant sub-groups (Building Services, Messengers, Protective and Custodial Services, and Stores Services) also of the GS group. The sub-groups shared a common evaluation plan but were subject to different hourly wage rates. Correction was based on a comparison of the complainants' average wage to the average wage paid to the comparison sub-groups for the period from November 1978 to 1980. Negotiation of a collective agreement effective December 22, 1980, introduced a common pay plan and eliminated separate wage rates by sub-groups.
- Within the Hospital Services (HS) group, the Registered Nursing Assistants (RNA) compared their work to that of the male predominant Nursing Orderlies. It was alleged that the HS classification standard under-evaluated RNA positions. The standard was revised in January 1983 and RNA positions were upgraded retroactive to December 12, 1979.
- In June and July 1979, the Nutrition and Dietetics (ND) group (previously known as Home Economists) and the Occupational and Physical Therapy (OP) group compared their work to that of five male-predominant groups. The complaints were modified in April 1982 to compare the work to that of the Forestry (FO) Group. Treasury Board argued that a multiple comparator approach was justified and five groups were used as comparators. In September 1985, the first bilateral agreement between union and management was reached and recommended to and accepted by the CHRC. The interim settlement reached with the Professional Institute of the Public Service of Canada (PIPSC) was subject to revision based on the outcome of the JUMI study.
- In September 1981, the Hospital Services (HS) group compared its work to that of the male predominant General Services (GS) group performing similar functions. A settlement was negotiated between TB and PSAC and a HRT Consent Order was issued in July 1987. In 1989, the HRT reconvened to exercise the jurisdiction retained concerning certain aspects of the dispute in the event that the implementation of the terms of reference did not resolve them. As a result, in April 1991, the HRT ordered pay equity adjustments and the adoption and implementation of a gender-neutral classification standard. In order to comply with the HRT Order, TB has being applying the GS standard since 1991.
- When the PSAC filed a complaint in 1984 under sections 7, 10 and 11 of the CHRA on behalf of the Clerical and
Regulatory (CR) group alleging discriminatory differences in the CR and Program Administration (PM) classification
standards, the TB invited unions to participate in a Joint Union Management Initiative (JUMI) to make
recommendations on a service-wide implementation of equal pay for work of equal value. Based on the existing
occupational groups, it was determined that there were nine female predominant groups (Clerical and Regulatory (CR),
Data Processing (DA), Educational Support (EU), Hospital Services (HS), Library Science (LS), Secretarial,
Stenographic and Typing (ST), Nursing (NU), Occupational and Physical Therapy (OP) and Home Economics (HE) now known
as Nutrition and Dietetics (ND)) and 53 male predominant groups (neutral groups were excluded from the JUMI).
Because of a disagreement over the existence of gender bias in job evaluations, the JUMI study was interrupted in the fall of 1989 before the parties could discuss or agree on a method to analyse the evaluation results. When it became obvious that the Initiative would not reconvene, the TBS began analysing the evaluation data to determine to what extent the predominantly female groups were underpaid. These analyses lead to an announcement on January 26, 1990, of a lump sum payment to employees of the CR, EU, ST and NU groups and ongoing annual salary adjustments to employees of the CR, EU and ST groups.
Because PSAC and PIPSC were not satisfied with these payments, they submitted new or revised complaints and requested that they be referred to a Tribunal. The fundamental issue before the Tribunal was related to section 11 of the CHRA. In an initial decision in 1996, the Tribunal held that the data gathered during the JUMI provided a reasonable basis for assessing whether further payments were required. Meanwhile the PIPSC complaints were resolved through negotiations in early 1995 and lead to a lump-sum payment and an ongoing equalization adjustment to employees of the HE/ND, OP and NU groups, which was integrated into base rates of pay effective April 1, 1994.
The second Tribunal decision, which relates to the method to be used to estimate the existence and extent of the wage gap, was rendered in July 1998. For the first time in pay equity history, the Tribunal ordered simple interest payments on the net amount of wages owing for each year of the retroactive period.
In the last week of December 1998, the TBS and the PSAC signed new collective agreements that included special pay adjustments (SPA) for employees in the groups affected by the Tribunal's decision with the understanding that these SPA would be taken into account in any calculation of the pay equity wage gap that may be required by the final resolution of the complaints.
An implementation agreement of the Tribunal's decision was negotiated by the parties in October 1999. The agreement provided, for employees of the CR, DA CON, EU, HS, LS and ST groups, retroactive adjustments to March 8, 1985, plus interest, and incorporation of adjustments into salary effective July 28, 1998. On that date, the equal pay adjustments announced on January 26, 1990 for employees of the CR, ST and EU groups were also incorporated into salary.
With respect to the sections 7 and 10 aspects of the 1984 PSAC complaint concerning the allegation of discriminatory differences in the CR and PM classification standards, in December 2003 the CHRC's investigator recommended that the Commission not intervene further in this case as the Employer has undertaken a reform of the two standards.
- The NU group's original complaint, dated November 1987, was filed after employees of the NU group observed a narrowing of the difference between their salaries and those of Registered Nursing Assistant in the HS group as a result of the Consent Order issued by the Canadian Human Rights Tribunal on July 15, 1987. In this complaint, the NU group compared its work to that of the Computer Services (CS) group. Shortly after the complaint had been submitted, a Memorandum of Understanding was negotiated within the collective agreement and as a result employees of the NU group were paid an annual salary adjustment of $5,500. Furthermore, in January 1990 (following the JUMI study), additional payments were also made retroactive to 1985. As previously mentioned, the NU complaint was revised in 1990 and resolved through a negotiated settlement in the course of the Human Rights Tribunal hearing.
- In 1990, Interviewers and Senior Interviewers in Statistics Canada claimed they were employees of Treasury Board and entitled to the equal pay adjustments given to CRs as per the January 26, 1990 announcement. Interviewers had been treated as contractual employees who received an hourly salary established on the basis of CR wages. The complaint was resolved in 1991 with Treasury Board accepting responsibility as the employer of Interviewers until November 1987, when the Minister responsible for Statistics Canada was designated a "separate employer." Interviewers received equal pay adjustments as CRs for the period from 1985 to 1987.
- Following the January 26, 1990 announcement of equal pay adjustments, 64 women who had been on maternity leave during the period of April 1, 1985 to March 31, 1990, submitted complaints because their maternity allowances had not been increased. This situation resulted from the lump-sum portion of the equal pay adjustments being considered "salary" for superannuation purposes only. The 1995 settlement approved by the CHRC recognized a lump sum payment per period of maternity leave taken between April 1, 1985 and March 31, 1990. Since then, pay equity settlements have considered employees on maternity leave as having been at work for the purposes of the pay equity adjustment.
- In June 1990, the Translator (TR) group compared its work to that of the Economics, Sociology and Statistics (ES) group, and then modified its complaint to compare itself to all male predominant groups. For a time the TR and Personnel Administration (PE) complaints were addressed simultaneously and a joint committee composed of representatives from the TR union, the PE group, the CHRC and the Treasury Board Secretariat was established. The joint committee agreed to examine both complainant groups as well as the following seven male predominant groups: Commerce (CO), Computer Systems (CS), Engineering and Scientific Support (EG), Economics, Sociology and Statistics (ES), Financial Administration (FI), Purchasing and Supply (PG) and Welfare Programmes (WP). A settlement was negotiated in December 2003 and the CHRC approved the terms of the settlement in February 2004. Employees received retroactive lump sum payments to April 1990 and an amount was integrated into their salary effective April 19, 2003.
- In 1991, several employees of the Personnel Administration (PE) group compared their work to that of various male predominant groups. Being unrepresented, the PEs formed the PE National Assembly to represent them for purposes of the complaint. The complaint was settled in November 1999 after a study comparing seven male predominant groups (those agreed to by the above-mentioned joint committee). Employees received lump sum payments retroactive to 1991 and an amount was integrated into their salary effective October 1, 1999.
- In December 1992, the National Indian and Inuit Community Health Representatives Organisation (NIICHRO) representing Community Health Representatives (CHRs) working in First Nations communities alleged that CHRs were employed by the federal government and claimed that they were entitled to the pay equity adjustments that federal CHRs had received. The parties agreed to mediation of the complaint and arrived at a settlement in April 2000. Under the terms of the settlement, NIICHRO acknowledged for purposes of the complaint that Her Majesty was not, between September 1980 and April 2000, the employer of any band-employed CHR. The Crown agreed to transfer a Settlement Amount to a Trust Fund to be held and administered by a board of trustees for equitable distribution to band-employed CHRs. The CHRC approved the terms of the settlement in May and the Federal Court ordered that the settlement be made an order of the Court in June 2000. The Trustees expect final payments to be made to CHRs in 2005.
- On August 31, 1995, Clinical Social Workers at levels 1 to 3 of the Social Welfare sub-group of the Social Work (SW-SCW) group compared their work to that of predominantly male program/policy workers employed at levels 3 to 5 of the same group and sub-group. A settlement was reached in June 1996 and the CHRC approved the terms of the settlement in August 1996. The Clinical Social Workers (a group of 21 employees) received lump-sum payments effective December 12, 1994 and an ongoing equalization adjustment, which was integrated into base rates of pay on October 1, 2000.
Individual Complaints
Individual complaints have tended to be resolved mostly through reclassifications and, at times, other forms of compensation. The number of individual complaints lodged under s. 11 of the Act has significantly decreased since the 1990s.
Outstanding Complaints
As of March 31, 2003, 12 complaints were outstanding, 9 of which related to allegations that derive from the definition of "employer / establishment". The majority of these complaints alleged that TB and/or separate employers discriminated against employees of separate employers by refusing to grant them the pay equity adjustments negotiated for employees of the TB (1-1- universe).[1]
Since March 31, 2003, four more complaints have been lodged.[2]
Footnotes
[1] Since November 2003, the CHRC has dismissed or decided not to deal with 11 complaints, 8 of which related to allegations that derive from the definition of "employer / establishment." To date, one decision has been referred to Federal Court for judicial review.
[2] Of the 5 complaints currently outstanding, 2 deal with the definition of "employer / establishment."
Appendix I
Estimated costs of pay equity settlements, 1980–2003
Estimated Costs of Pay Equity Settlements as of March 31, 2003
A. PSAC Groups
|
General Services (GS) Group |
|||||
|
Description |
Date |
Lump Sum Payment |
Accumulation of Annual Amount (Up to March 31, 2003) |
Annual Ongoing Amount After March 31, 2003 |
|
|
GS-FOS, GS-LAS and GS-MPS (1) |
02 Mar 82 |
|
19,421,774 |
- |
- |
|
(1) Harmonization of Rates of Pay |
19,421,774 |
- |
- |
||
|
Hospital Services (HS) Group |
|||||
|
Description |
Date |
Lump Sum Payment |
Accumulation of Annual Amount (Up to March 31, 2003) |
Annual Ongoing Amount After March 31, 2003 |
|
|
General HS Agreement (2) |
09 Sep 80 |
26 Jul 87 |
28,303,452 |
- |
- |
|
General HS Agreement (2) |
27 Jul 87 |
21 Dec 87 |
1,645,665 |
- |
- |
|
Community Health Rep. Supplement (2) |
09 Sep 80 |
21 Dec 87 |
2,198,500 |
- |
- |
|
(2) Pay Equity Adjustments and Application of the GS Classification Standard |
32,147,617 |
- |
- |
||
|
Clerical and Regulatory (CR) Group |
|||||
|
Date |
Date |
Lump Sum Payment |
Accumulation of Annual Amount (Up to March 31, 2003) |
Annual Ongoing Amount After March 31, 2003 |
|
|
1990 Equalization Adjustments - Integrated into base rates of pay as of 29 Jul 98 |
01 Apr 85 |
31 Mar 90 |
192,545,605 |
- |
- |
|
|
01 Apr 90 |
31 Mar 03 |
- |
558,864,042 |
- |
|
|
|
|
- |
- |
31,740,408 |
|
Special Pay Adjustment - Integrated into base rates of pay as of 12 Jun 97 |
12 Jun 97 |
31 Mar 03 |
- |
509,925,159 |
79,036,533 |
|
1999 Agreement - Integrated into base rates of pay as of 29 Jul 98 |
08 Mar 85 |
28 Jul 98 |
1,587,128,454 |
- |
- |
|
|
29 Jul 98 |
31 Mar 03 |
- |
197,098,651 |
- |
|
|
|
|
- |
- |
38,684,879 |
|
|
1,779,674,059 |
1,265,887,852 |
149,461,820 |
||
|
Data Processing - Data Conversion (DA-CON) |
|||||
|
Description |
Date |
Lump Sum Payment |
Accumulation of Annual Amount (Up to March 31, 2003) |
Annual Ongoing Amount After March 31, 2003 |
|
|
Special Pay Adjustment - Integrated into base rates of pay as of 29 Aug 97 |
29 Aug 97 |
31 Mar 03 |
- |
6,214,597 |
321,621 |
|
1999 Agreement - Integrated into base rates of pay as of 29 Jul 98 |
08 Mar 85 |
28 Jul 98 |
38,052,875 |
- |
- |
|
|
29 Jul 98 |
31 Mar 03 |
- |
76,515 |
- |
|
|
|
|
- |
- |
10,269 |
|
|
38,052,875 |
6,291,112 |
331,890 |
||
|
Educational Support (EU) Group |
|||||
|
Description |
Date |
Lump Sum Payment |
Accumulation of Annual Amount (Up to March 31, 2003) |
Annual Ongoing Amount After March 31, 2003 |
|
|
1990 Equalization Adjustments - Integrated into base rates of pay as of 29 Jul 98 |
01 Apr 85 |
31 Mar 90 |
1,073,095 |
- |
- |
|
|
01 Apr 90 |
31 Mar 03 |
- |
540,208 |
- |
|
|
|
|
- |
- |
114,450 |
|
Special Pay Adjustment - Integrated into base rates of pay as of 12 Jun 97 |
12 Jun 97 |
31 Mar 03 |
- |
109,934 |
111,950 |
|
1999 Agreement - Integrated into base rates of pay as of 29 Jul 98 |
08 Mar 85 |
28 Jul 98 |
2,112,645 |
- |
- |
|
|
29 Jul 98 |
31 Mar 03 |
- |
3,014 |
- |
|
|
|
|
- |
- |
9,550 |
|
|
3,185,740 |
653,156 |
235,950 |
||
|
Library Science (LS) Group |
|||||
|
Description |
Date |
Lump Sum Payment |
Accumulation of Annual Amount (Up to March 31, 2003) |
Annual Ongoing Amount After March 31, 2003 |
|
|
1980 Agreement - Equalization Adjustments |
01 Mar 78 |
31 Mar 97 |
- |
38,878,738 |
- |
|
Special Pay Adjustment - Integrated into base rates of pay as of 1 Apr 97 |
01 Apr 97 |
31 Mar 03 |
- |
25,850,452 |
4,312,651 |
|
1999 Agreement - Integrated into base rates of pay as of 29 Jul 98 |
08 Mar 85 |
28 Jul 98 |
28,998,339 |
- |
- |
|
|
29 Jul 98 |
31 Mar 03 |
- |
3,447,503 |
- |
|
|
|
|
- |
- |
734,636 |
|
|
28,998,339 |
68,176,693 |
5,047,287 |
||
|
Hospital Service |
|||||
|
Description |
Date |
Lump Sum Payment |
Accumulation of Annual Amount (Up to March 31, 2003) |
Annual Ongoing Amount After March 31, 2003 |
|
|
Special Pay Adjustment - Integrated into base rates of pay as of 22 Jun 97 |
22 Jun 97 |
31 Mar 03 |
- |
4,816,952 |
815,493 |
|
1999 Agreement - Integrated into base rates of pay as of 29 Jul 98 |
08 Mar 85 |
28 Jul 98 |
33,459,644 |
- |
- |
|
|
29 Jul 98 |
31 Mar 03 |
- |
7,350,079 |
- |
|
|
|
|
- |
- |
1,527,551 |
|
|
33,459,644 |
12,167,031 |
2,343,044 |
||
|
Secretarial, Stenographic and Typing (ST) Group |
|||||
|
Description |
Date |
Lump Sum Payment |
Accumulation of Annual Amount (Up to March 31, 2003) |
Annual Ongoing Amount After March 31, 2003 |
|
|
1990 Equalization Adjustments - Integrated into base rates of pay as of 29 Jul 98 |
01 Apr 85 |
31 Mar 90 |
84,592,986 |
- |
- |
|
|
01 Apr 90 |
31 Mar 03 |
- |
123,607,782 |
- |
|
|
|
|
- |
- |
2,278,952 |
|
Special Pay Adjustment - Integrated into base rates of pay as of 12 Jun 97 |
12 Jun 97 |
31 Mar 03 |
- |
32,827,626 |
2,568,771 |
|
1999 Agreement - Integrated into base rates of pay as of 29 Jul 98 |
08 Mar 85 |
28 Jul 98 |
252,926,859 |
- |
- |
|
|
29 Jul 98 |
31 Mar 03 |
- |
9,587,652 |
- |
|
|
|
|
- |
- |
1,029,460 |
|
|
337,519,845 |
166,023,060 |
5,877,183 |
||
|
Interviewers and Senior Interviewers (in Statistics Canada) |
|||||
|
Description |
Date |
Lump Sum Payment |
Accumulation of Annual Amount (Up to March 31, 2003) |
Annual Ongoing Amount After March 31, 2003 |
|
|
1991 Settlement |
01 Apr 85 |
Nov 87 |
1,000,000 |
- |
- |
|
|
1,000,000 |
- |
- |
||
Roll-up of PSAC Groups
|
Description |
Lump Sum Payment |
Accumulation of Annual Amount (Up to March 31, 2003) |
Annual Ongoing Amount After March 31, 2003 |
|
GS-FOS, GS-LAS and GS-MPS |
19,421,774 |
- |
- |
|
General HS Agreement |
29,949,117 |
- |
- |
|
Community Health Rep. Supplement |
2,198,500 |
- |
- |
|
1990 Equalization Adjustments |
278,211,686 |
683,012,032 |
34,133,810 |
|
1980 Agreement - Equalization Adjustments |
- |
38,878,738 |
- |
|
Special Pay Adjustment |
- |
579,744,720 |
87,167,019 |
|
1999 Agreement |
1,942,678,816 |
217,563,414 |
41,996,345 |
|
1991 Settlement |
1,000,000 |
- |
- |
|
1999 Agreement - Interest (as of Feb. 03) |
911,841,018 |
- |
- |
|
|
3,185,300,911 |
1,519,198,904 |
163,297,174 |
B. PIPSC Groups
|
Nursing (NU) Group |
|||||
|
Description |
Date |
Lump Sum Payment |
Accumulation of Annual Amount (Up to March 31, 2003) |
Annual Ongoing Amount After March 31, 2003 |
|
|
1987 Memorandum of Understanding ($5,500) |
01 Oct 87 |
31 Mar 94 |
- |
58,588,750 |
- |
|
1990 TB Announcement - Retroactivity |
01 Apr 85 |
30 Sep 87 |
24,441,887 |
- |
- |
|
1994 Agreement - Integrated into base rates of pay as of 1 Apr 94 |
01 Oct 87 |
31 Mar 94 |
57,341,690 |
- |
- |
|
|
01 Apr 94 |
31 Mar 03 |
- |
177,705,400 |
- |
|
|
|
|
- |
- |
21,454,951 |
|
|
81,783,577 |
236,294,150 |
21,454,951 |
||
|
Nutrition and Dietetics (ND) Group (formerly Home Economics (HE)) |
|||||
|
Description |
Date |
Lump Sum Payment |
Accumulation of Annual Amount (Up to March 31, 2003) |
Annual Ongoing Amount After March 31, 2003 |
|
|
Includes Occupational and Physical Therapy (OP) Group payments |
01 Mar 78 |
31 Mar 85 |
2,524,775 |
- |
- |
|
Interim Settlement |
01 Apr 85 |
31 Mar 94 |
- |
1,430,933 |
- |
|
1994 Agreement - Integrated into base rates of pay as of 1 Apr 94 |
01 Apr 87 |
31 Mar 94 |
1,507,786 |
- |
- |
|
|
01 Apr 94 |
31 Mar 03 |
- |
2,937,454 |
- |
|
|
|
|
- |
- |
408,317 |
|
|
4,032,561 |
4,368,387 |
408,317 |
||
|
Occupational and Physical Therapy (OP) Group |
|||||
|
Description |
Date |
Lump Sum Payment |
Accumulation of Annual Amount (Up to March 31, 2003) |
Annual Ongoing Amount After March 31, 2003 |
|
|
See ND Table |
01 Mar 78 |
31 Mar 85 |
- |
- |
- |
|
Interim Settlement |
01 Apr 85 |
31 Mar 94 |
- |
2,425,465 |
- |
|
1994 Agreement - Integrated into base rates of pay as of 1 Apr 94 |
01 Apr 87 |
31 Mar 94 |
1,296,536 |
- |
- |
|
|
01 Apr 94 |
31 Mar 03 |
- |
5,295,890 |
- |
|
|
|
|
- |
- |
775,736 |
|
|
1,296,536 |
7,721,355 |
775,736 |
||
|
Social Work (SW-SCW) sub-Group |
|||||
|
Description |
Date |
Lump Sum Payment |
Accumulation of Annual Amount (Up to March 31, 2003) |
Annual Ongoing Amount After March 31, 2003 |
|
|
1996 Settlement - Integrated into base rates of pay as of 12 Jun 96 |
12 Dec 94 |
11 Jun 96 |
396,926 |
- |
- |
|
|
12 Jun 96 |
31 Mar 03 |
- |
1,949,389 |
- |
|
|
|
|
- |
- |
333,000 |
|
|
396,926 |
1,949,389 |
333,000 |
||
Roll-up of PIPSC Groups
|
Description |
Lump Sum Payment |
Accumulation of Annual Amount (Up to March 31, 2003) |
Annual Ongoing Amount After March 31, 2003 |
|
ND(HE) and OP (up to March 85) |
2,524,775 |
- |
- |
|
1987 Memorandum of Understanding |
- |
58,588,750 |
- |
|
1990 Treasury Board Announcement |
24,441,887 |
- |
- |
|
Interim Settlement |
- |
3,856,398 |
- |
|
1994 Agreement |
60,146,012 |
185,938,744 |
22,639,004 |
|
1996 Agreement |
396,926 |
1,949,389 |
333,000 |
|
|
87,509,600 |
250,333,281 |
22,972,004 |
C. Other Settlements
|
National Indian and Inuit Community Health Representatives Organization (NIICHRO) |
|||||
|
Description |
Date |
Lump Sum Payment |
Accumulation of Annual Amount (Up to March 31, 2003) |
Annual Ongoing Amount After March 31, 2003 |
|
|
Transfer of settlement amount to a trust fund |
09 Sep 80 |
26 Apr 00 |
45,700,000 |
- |
- |
|
|
45,700,000 |
- |
- |
||
|
Personnel Administration (PE) Group |
|||||
|
Description |
Date |
Lump Sum Payment |
Accumulation of Annual Amount (Up to March 31, 2003) |
Annual Ongoing Amount After March 31, 2003 |
|
|
1999 Agreement - Integrated into base rates of pay as of 1 Oct 99 |
01 Oct 91 |
30 Sep 99 |
60,744,550 |
- |
- |
|
|
01 Oct 99 |
31 Mar 03 |
- |
57,681,250 |
- |
|
|
|
|
- |
- |
18,012,500 |
|
|
60,744,550 |
57,681,250 |
18,012,500 |
||
|
Translation (TR) Group |
|||||
|
Description |
Date |
Lump Sum Payment |
Accumulation of Annual Amount (Up to March 31, 2003) |
Annual Ongoing Amount After March 31, 2003 |
|
|
2003 Agreement - Integrated into base rates of pay as of April 19, 2003 |
01 Apr 90 |
31 Mar 03 |
17,279,670 |
- |
4,479,425 |
|
|
17,279,670 |
- |
4,479,425 |
||
D. Totals for all Groups
|
Description |
Lump Sum Payment |
Accumulation of Annual Amount (Up to March 31, 2003) |
Annual Ongoing Amount After March 31, 2003 |
|
PSAC |
3,185,300,911 |
1,519,198,904 |
163,297,174 |
|
PIPSC |
87,509,600 |
250,333,281 |
22,972,004 |
|
Other Groups |
123,724,220 |
57,681,250 |
22,491,925 |
|
|
3,396,534,731 |
1,827,213,435 |
208,761,103 |
Appendix J
Data in support of figures illustrating trends in key economic indicators
Figure 1018: Key economic indicators in Canada, 1990‑91 to 2002‑03
KEY ECONOMIC INDICATORS IN CANADA OVER THE 1990‑91 ‑ 2002‑03 PERIOD
|
|
FY |
$ Millions |
$ Millions |
# of persons |
$ Millions |
% |
% |
Units |
|
Nominal GDP |
Real GDP |
Population |
Federal Deficit |
Unemployment Rate |
Inflation Rate |
Housing starts (calendar year) |
||
|
|
90‑91 |
678172 |
745782 |
27,736,755 |
32,368 |
8.1 |
4.8 |
|
|
1991 |
91‑92 |
692940 |
752103 |
28,066,408 |
38,617 |
10.3 |
5.6 |
156197 |
|
1992 |
92‑93 |
714776 |
765599 |
28,407,880 |
40,602 |
11.2 |
1.5 |
168271 |
|
1993 |
93‑94 |
750696 |
794261 |
28,724,135 |
40,432 |
11.4 |
1.8 |
155443 |
|
1994 |
94‑95 |
801904 |
832472 |
29,035,161 |
36,736 |
10.4 |
0.2 |
154057 |
|
1995 |
95‑96 |
819976 |
837371 |
29,339,247 |
33,211 |
9.4 |
2.2 |
110933 |
|
1996 |
96‑97 |
867828 |
867450 |
29,646,827 |
13,499 |
9.6 |
1.6 |
124713 |
|
1997 |
97‑98 |
906904 |
908309 |
29,938,140 |
-4,507 |
9.1 |
1.6 |
147040 |
|
1998 |
98‑99 |
949136 |
950590 |
30,183,789 |
-2,786 |
8.3 |
0.9 |
137439 |
|
1999 |
99‑00 |
1042100 |
1004935 |
30,436,185 |
-6,999 |
7.6 |
1.7 |
149968 |
|
2000 |
00‑01 |
1115408 |
1035414 |
30,725,451 |
-9,213 |
6.8 |
2.7 |
151653 |
|
2001 |
01‑02 |
1121528 |
1060397 |
31,059,970 |
-7,351 |
7.2 |
2.6 |
162733 |
|
2002 |
02‑03 |
1214880 |
1093793 |
31,385,694 |
-2,780 |
7.7 |
2.2 |
205034 |
Figure 1019: Comparison of rate of change of key economic indicators in Canada, 1990‑91 to 2002‑03 (1990‑91=100)
KEY ECONOMIC INDICATORS IN CANADA OVER THE 1990‑91 ‑ 2002‑03 PERIOD
|
|
Index (1990‑91=100) |
|||||||
|
FY |
Nominal GDP |
Real GDP |
Population |
Federal Deficit |
Unemployment Rate |
Inflation Rate |
Housing starts (calendar year) |
|
|
|
90‑91 |
100.0 |
100.0 |
100.0 |
100.0 |
100.0 |
100.0 |
100.0 |
|
1991 |
91‑92 |
102.2 |
100.8 |
101.2 |
119.3 |
127.2 |
115.4 |
100.0 |
|
1992 |
92‑93 |
105.4 |
102.7 |
102.4 |
125.4 |
138.3 |
31.5 |
107.7 |
|
1993 |
93‑94 |
110.7 |
106.5 |
103.6 |
124.9 |
140.7 |
37.3 |
99.5 |
|
1994 |
94‑95 |
118.2 |
111.6 |
104.7 |
113.5 |
128.4 |
4.1 |
98.6 |
|
1995 |
95‑96 |
120.9 |
112.3 |
105.8 |
102.6 |
116.0 |
44.6 |
71.0 |
|
1996 |
96‑97 |
128.0 |
116.3 |
106.9 |
41.7 |
118.5 |
33.8 |
79.8 |
|
1997 |
97‑98 |
133.7 |
121.8 |
107.9 |
-13.9 |
112.3 |
33.2 |
94.1 |
|
1998 |
98‑99 |
140.0 |
127.5 |
108.8 |
-8.6 |
102.5 |
19.2 |
88.0 |
|
1999 |
99‑00 |
153.7 |
134.7 |
109.7 |
-21.6 |
93.8 |
36.2 |
96.0 |
|
2000 |
00‑01 |
164.5 |
138.8 |
110.8 |
-28.5 |
84.0 |
56.2 |
97.1 |
|
2001 |
01‑02 |
165.4 |
142.2 |
112.0 |
-22.7 |
88.9 |
52.9 |
104.2 |
|
2002 |
02‑03 |
179.1 |
146.7 |
113.2 |
-8.6 |
95.1 |
46.2 |
131.3 |
NOTE
(1) GDP at current prices, expenditure-based, seasonally adjusted quarterly data at annual rate for the first quarter, Statistics Canada, CANSIM.
(2) GDP at chained 1997 dollars, seasonally adjusted at annual rate for the first quarter, Statistics Canada, CANSIM.
(3) Average population of four quarterly population estimates, Estimates of population, Statistics Canada, CANSIM.
(4) Federal government deficit for fiscal year ending March 31. Federal Government Finance - Estimates and Actual Data, Statistics Canada, CANSIM.
(5) Unemployment rate, both sexes, 15 years and older, Labour Force Survey estimates, Statistics Canada, CANSIM.
(6) Annual Change in CPI all items index, Statistics Canada, CANSIM.
Figure 1020: Employment and Income in Canada, 1990‑91 to 2002‑03
EMPLOYMENT AND INCOME
|
FY |
# of persons |
$ |
||||||
|
Canadian Employment (x1000) |
Private Sector Employment |
Public Sector Employment |
Nominal GDP per capita |
Real GDP per capita |
Average Weekly Earnings |
Median after-tax income |
Average Hourly Earnings |
|
|
90‑91 |
13,017 |
10,267 |
2,749 |
24,450 |
26,887.86 |
n/a |
38,300 |
n/a |
|
91‑92 |
12,833 |
10,040 |
2,793 |
24,689 |
26,797.27 |
544.68 |
36,400 |
n/a |
|
92‑93 |
12,772 |
9,945 |
2,828 |
25,161 |
26,950.23 |
562.73 |
37,200 |
n/a |
|
93‑94 |
12,886 |
10,077 |
2,809 |
26,135 |
27,651.35 |
569.59 |
35,700 |
n/a |
|
94‑95 |
13,215 |
10,415 |
2,800 |
27,618 |
28,671.17 |
579.65 |
36,600 |
n/a |
|
95‑96 |
13,377 |
10,646 |
2,731 |
27,948 |
28,540.98 |
584.50 |
36,000 |
n/a |
|
96‑97 |
13,507 |
10,831 |
2,676 |
29,272 |
29,259.45 |
598.24 |
35,900 |
15.61 |
|
97‑98 |
13,870 |
11,226 |
2,645 |
30,293 |
30,339.53 |
606.85 |
36,000 |
15.75 |
|
98‑99 |
14,241 |
11,588 |
2,654 |
31,445 |
31,493.40 |
615.09 |
37,000 |
16.09 |
|
99‑00 |
14,640 |
11,914 |
2,725 |
34,239 |
33,017.77 |
624.63 |
38,300 |
16.56 |
|
00‑01 |
14,969 |
12,159 |
2,810 |
36,302 |
33,698.90 |
638.89 |
39,100 |
17.16 |
|
01‑02 |
15,116 |
12,288 |
2,828 |
36,108 |
34,140.31 |
650.83 |
40,800 |
17.69 |
|
02‑03 |
15,531 |
12,591 |
2,939 |
38,708 |
34,850.05 |
662.47 |
41,300 |
18.04 |
Figure 1020: (cont'd)
EMPLOYMENT AND INCOME
|
FY |
Index (1990-91=100) |
|||||||
|
Canadian Employment (x1000) |
Private Sector Employment |
Public Sector Employment |
Nominal GDP per capita |
Real GDP per capita |
Avrg Weekly Earnings |
Median after-tax income |
Average Hourly Earnings |
|
|
90‑91 |
100.0 |
100.0 |
100.0 |
100.0 |
100.0 |
|
100.0 |
|
|
91‑92 |
98.6 |
97.8 |
101.6 |
101.0 |
99.7 |
100.0 |
95.0 |
|
|
92‑93 |
98.1 |
96.9 |
102.8 |
102.9 |
100.2 |
103.3 |
97.1 |
|
|
93‑94 |
99.0 |
98.1 |
102.2 |
106.9 |
102.8 |
104.6 |
93.2 |
|
|
94‑95 |
101.5 |
101.4 |
101.8 |
113.0 |
106.6 |
106.4 |
95.6 |
|
|
95‑96 |
102.8 |
103.7 |
99.3 |
114.3 |
106.1 |
107.3 |
94.0 |
|
|
96‑97 |
103.8 |
105.5 |
97.3 |
119.7 |
108.8 |
109.8 |
93.7 |
100.0 |
|
97‑98 |
106.6 |
109.3 |
96.2 |
123.9 |
112.8 |
111.4 |
94.0 |
100.9 |
|
98‑99 |
109.4 |
112.9 |
96.5 |
128.6 |
117.1 |
112.9 |
96.6 |
103.1 |
|
99‑00 |
112.5 |
116.0 |
99.1 |
140.0 |
122.8 |
114.7 |
100.0 |
106.1 |
|
00‑01 |
115.0 |
118.4 |
102.2 |
148.5 |
125.3 |
117.3 |
102.1 |
109.9 |
|
01‑02 |
116.1 |
119.7 |
102.8 |
147.7 |
127.0 |
119.5 |
106.5 |
113.3 |
|
02‑03 |
119.3 |
122.6 |
106.9 |
158.3 |
129.6 |
121.6 |
107.8 |
115.6 |
Source:
(1) Average monthly employment for the year ended March. Both sexes, 15 years and older. Labour Force Survey Estimates, Statistics Canada, CANSIM.
(2) Monthly average of the difference between total employment in all industries minus the number of public sector employees for the year ended March (includes private sector employees and self-employed). Both sexes. Labour Force Survey Estimates, Statistics Canada, CANSIM.
(3) Monthly average of the number of public sector employees for the year ended March. Both sexes. Labour Force Survey Estimates, Statistics Canada, CANSIM.
(4) Average weekly earnings for all employees, excluding overtime, industrial aggregate excluding unclassified. SEPH, Statistics Canda, CANSIM.
(5) Median after-tax income at 2002 constant dollars, all family types. Statistics Canada, CANSIM.
(6) Average hourly wage rate in the month of March. Total employees, both sexes, 12 years and older. Labour Force Survey Estimates, Statistics Canada, CANSIM.
Figure 1021: Comparison of rate of change in key employment and income indicators in Canada, 1990-91 to 2002-03 (indexed, 1990-91 =100)
|
FY |
Index (1990-91=100) |
|||
|
|
Federal Public Sector Average Salary |
Public Service and Separate Employers Average Salary |
Regular Canadian Forces Average Salary |
RCMP Average Salary |
|
90‑91 |
100.0 |
100.0 |
100.0 |
100.0 |
|
91-92 |
101.8 |
101.7 |
99.9 |
115.5 |
|
92-93 |
107.0 |
106.1 |
106.0 |
130.8 |
|
93-94 |
109.3 |
108.2 |
106.9 |
142.0 |
|
94-95 |
110.5 |
109.3 |
107.6 |
149.1 |
|
95-96 |
112.1 |
109.7 |
111.3 |
158.9 |
|
96-97 |
113.9 |
109.6 |
117.2 |
167.4 |
|
97-98 |
116.2 |
110.7 |
121.5 |
176.9 |
|
98-99 |
120.2 |
114.7 |
124.9 |
184.7 |
|
99-00 |
126.7 |
121.4 |
129.9 |
201.0 |
|
00-01 |
133.3 |
125.7 |
142.8 |
223.5 |
|
01-02 |
138.5 |
131.5 |
146.2 |
229.2 |
|
02-03 |
147.1 |
141.0 |
151.6 |
238.5 |
Figure 1021: (cont'd)
|
FY |
Index (1990-91=100) |
||||
|
|
Average Weekly Earnings |
Average Hourly Earnings |
Private Sector Average Weekly Earnings |
Private Sector Average Hourly Earnings |
Federal Public Sector Wage Bill (x Millions) |
|
90‑91 |
|
|
|
|
100.0 |
|
91‑92 |
101.8 |
|
101.8 |
|
101.6 |
|
92‑93 |
105.1 |
|
105.1 |
|
105.9 |
|
93‑94 |
106.4 |
|
106.3 |
|
105.6 |
|
94‑95 |
108.3 |
|
108.4 |
|
103.2 |
|
95‑96 |
109.2 |
|
109.6 |
|
97.7 |
|
96‑97 |
111.8 |
111.8 |
112.4 |
111.8 |
93.6 |
|
97‑98 |
113.4 |
112.8 |
114.3 |
112.4 |
91.8 |
|
98‑99 |
114.9 |
115.2 |
115.9 |
115.4 |
93.5 |
|
99‑00 |
116.7 |
118.6 |
117.6 |
117.8 |
100.5 |
|
00‑01 |
119.4 |
122.9 |
120.3 |
120.2 |
109.6 |
|
01‑02 |
121.6 |
126.7 |
122.5 |
124.3 |
119.2 |
|
02‑03 |
123.8 |
129.2 |
124.4 |
126.5 |
131.4 |
(1) Wage bill divided by employment for Core Public Service (PSSRA 1-1), Separate Employers (PSSRA 1-2), regular Canadian Forces and RCMP members. TBS Incumbent System, Statistics Canada, and RCMP.
(2) Public Service (PSSRA 1-1) and Separate Employers (PSSRA 1-2) wage bill divided by employment for the fiscal year ended March 31. TBS Incumbent System.
(3) Regular Canadian Forces wage bill (including allowances) divided by employment. Statistics Canada CANSIM.
(4) RCMP wage bill divided by RCMP employment, RCMP and Statistics Canada.
(5) Average weekly earnings for all employees, excluding overtime, industrial aggregate excluding unclassified. SEPH, Statistics Canda, CANSIM.
(6) Average hourly wage rate in the month of March. Total employees, both sexes, 15 years and older. Labour Force Survey Estimates, Statistics Canada, CANSIM.
(7) Average weekly earnings computed from Industrial Aggregate excluding Public Administration for all employees (salaried employees and employees paid by the hour), SEPH, Statistics Canada, CANSIM.
(8) Average hourly earnings for the Private Sector with an establishment size greater than 500 employees, for full-time employed single job holder, Labour Force Survey, Statistics Canada, CANSIM.
(9) Covers total payroll for Core Public Service (PSSRA 1-1), Separate Employers (PSSRA 1-2), regular Canadian Forces (including allowances) and RCMP members. TBS Incumbent System, Statistics Canada, and RCMP.
Figure 1022: Federal and overall Canadian employment trends 1990-91 to 2002-03
Federal Public Sector and Canadian Employment
|
FY |
# of persons |
% |
||||
|
|
Federal Public Sector Employment |
Public Service and Separate Employers Employment |
Canadian Employment (x1000) |
Private Sector Employment |
Public Sector Employment |
Share of Federal Public Sector Employment as a Percentage of Canadian Employment |
|
90‑91 |
350,868 |
242,398 |
13,017 |
10267 |
2,749 |
2.70% |
|
91-92 |
350,429 |
244,099 |
12,833 |
10040 |
2,793 |
2.73% |
|
92-93 |
347,242 |
245,116 |
12,772 |
9945 |
2,828 |
2.72% |
|
93-94 |
339,268 |
240,867 |
12,886 |
10077 |
2,809 |
2.63% |
|
94-95 |
327,689 |
233,695 |
13,215 |
10415 |
2,800 |
2.48% |
|
95-96 |
305,742 |
218,297 |
13,377 |
10646 |
2,731 |
2.29% |
|
96-97 |
288,334 |
206,221 |
13,507 |
10831 |
2,676 |
2.13% |
|
97-98 |
277,340 |
197,642 |
13,870 |
11226 |
2,645 |
2.00% |
|
98-99 |
273,020 |
194,776 |
14,241 |
11588 |
2,654 |
1.92% |
|
99-00 |
278,420 |
202,282 |
14,640 |
11914 |
2,725 |
1.90% |
|
00-01 |
288,343 |
213,185 |
14,969 |
12159 |
2,810 |
1.93% |
|
01-02 |
301,961 |
225,469 |
15,116 |
12288 |
2,828 |
2.00% |
|
02-03 |
313,421 |
234,393 |
15,531 |
12591 |
2,939 |
2.02% |
Figure 1023: Comparison of trends in federal employment to total Canadian employment, 1990-91 to 2002-03 (1990-91 = 100)
|
FY |
Index (1990-91=100) |
|||||
|
|
Federal Public Sector Employment |
Public Service and Separate Employers Employment |
Canadian Employment (x1000) |
Private Sector Employment |
Public Sector Employment |
Share of Federal Public Sector Employment as a Percentage of Canadian Employment |
|
90‑91 |
100.0 |
100.0 |
100.0 |
100.0 |
100.0 |
100.0 |
|
91-92 |
99.9 |
100.7 |
98.6 |
97.8 |
101.6 |
101.3 |
|
92-93 |
99.0 |
101.1 |
98.1 |
96.9 |
102.8 |
100.9 |
|
93-94 |
96.7 |
99.4 |
99.0 |
98.1 |
102.2 |
97.7 |
|
94-95 |
93.4 |
96.4 |
101.5 |
101.4 |
101.8 |
92.0 |
|
95-96 |
87.1 |
90.1 |
102.8 |
103.7 |
99.3 |
84.8 |
|
96-97 |
82.2 |
85.1 |
103.8 |
105.5 |
97.3 |
79.2 |
|
97-98 |
79.0 |
81.5 |
106.6 |
109.3 |
96.2 |
74.2 |
|
98-99 |
77.8 |
80.4 |
109.4 |
112.9 |
96.5 |
71.1 |
|
99-00 |
79.4 |
83.5 |
112.5 |
116.0 |
99.1 |
70.6 |
|
00-01 |
82.2 |
87.9 |
115.0 |
118.4 |
102.2 |
71.5 |
|
01-02 |
86.1 |
93.0 |
116.1 |
119.7 |
102.8 |
74.1 |
|
02-03 |
89.3 |
96.7 |
119.3 |
122.6 |
106.9 |
74.9 |
(1) Covers Core Public Service (PSSRA 1-1), Separate Employers (PSSRA 1-2), Regular Canadian Forces and RCMP Members. Average employment for the four period (March, June, September, December). TBS incumbent system and Statistics Canada.
(2) Covers Core Public Service (PSSRA 1-1) and Separate Employers (PSSRA 1-2), Regular Canadian Forces and RCMP Members. Average employment for the four period (March, June, September, December). TBS incumbent system.
(3) Average monthly employment for the year ended March. Both sexes, 15 years and older. Labour Force Survey Estimates, Statistics Canada, CANSIM.
(4) Monthly average of the difference between total employment in all industries minus the number of public sector employees for the year ended March (includes private sector employees and self-employed). Both sexes. Labour Force Survey Estimates, Statistics Canada, CANSIM.
(5) Monthly average of the number of public sector employees for the year ended March. Both sexes. Labour Force Survey Estimates, Statistics Canada, CANSIM.
Figure 1024 : Federal, provincial, municipal and overall Canadian wage bills, 1990-91 to 2002-03
WAGE BILLS
In Nominal Terms
|
FY |
$ Millions |
|||||
|
|
Federal Public Sector Wage Bill |
Public Service and Separate Employers Wage Bill |
Total Canadian Wage Bill (incl. Supplementary labour income) |
Private Sector Wage Bill |
Public Sector Payroll |
Broad Provincial and Territorial Public Sector Wage Bill |
|
90‑91 |
13,095 |
9,081 |
374,900 |
275,703 |
99,197 |
46,573 |
|
91-92 |
13,311 |
9,297 |
384,244 |
280,214 |
104,030 |
49,183 |
|
92-93 |
13,872 |
9,742 |
393,252 |
285,770 |
107,482 |
50,736 |
|
93-94 |
13,834 |
9,764 |
397,708 |
289,354 |
108,354 |
50,989 |
|
94-95 |
13,514 |
9,566 |
414,432 |
306,872 |
107,560 |
50,424 |
|
95-96 |
12,794 |
8,972 |
422,852 |
317,729 |
105,123 |
49,693 |
|
96-97 |
12,254 |
8,471 |
443,832 |
341,297 |
102,535 |
49,082 |
|
97-98 |
12,023 |
8,200 |
468,188 |
366,573 |
101,615 |
48,936 |
|
98-99 |
12,243 |
8,368 |
490,084 |
385,789 |
104,295 |
50,478 |
|
99-00 |
13,161 |
9,197 |
528,444 |
419,540 |
108,904 |
53,282 |
|
00-01 |
14,350 |
10,037 |
564,836 |
447,438 |
117,398 |
56,880 |
|
01-02 |
15,608 |
11,110 |
582,564 |
461,502 |
121,062 |
60,066 |
|
02-03 |
17,204 |
12,384 |
609,020 |
481,602 |
127,418 |
63,232 |
Figure 1024: (cont'd)
|
FY |
$ Millions |
% |
|
||
|
|
Broad Municipal Public Sector Wage Bill |
Nominal GDP |
Total Canadian Wage Bill (wages & salaries only) |
Federal Public Sector Wage Bill as a % of Nominal GDP |
Federal Public Sector Wage Bill as a % of Canadian Wage Bill |
|
90‑91 |
31,043 |
678,172 |
|
1.9% |
3.5% |
|
91-92 |
33,452 |
692,940 |
|
1.9% |
3.5% |
|
92-93 |
35,083 |
714,776 |
|
1.9% |
3.5% |
|
93-94 |
35,623 |
750,696 |
|
1.8% |
3.5% |
|
94-95 |
35,463 |
801,904 |
|
1.7% |
3.3% |
|
95-96 |
35,341 |
819,976 |
|
1.6% |
3.0% |
|
96-97 |
35,308 |
867,828 |
|
1.4% |
2.8% |
|
97-98 |
34,775 |
906,904 |
403,898 |
1.3% |
2.6% |
|
98-99 |
35,018 |
949,136 |
424,586 |
1.3% |
2.5% |
|
99-00 |
36,118 |
1,042,100 |
454,204 |
1.3% |
2.5% |
|
00-01 |
37,201 |
1,115,408 |
491,980 |
1.3% |
2.5% |
|
01-02 |
38,567 |
1,121,528 |
508,128 |
1.4% |
2.7% |
|
02-03 |
40,404 |
1,214,880 |
526,696 |
1.4% |
2.8% |
Figure 1025 : Comparison of changes in federal, provincial, municipal and overall Canadian wage bills 1990-91 to 2002-03 (1990-91 = 100)
|
FY |
Index (1990-91=100) |
||||
|
|
Federal Public Sector Wage Bill |
Public Service and Separate Employers Wage Bill |
Total Canadian Wage Bill (incl. Supplementary labour income) |
Private Sector Wage Bill |
Public Sector Payroll |
|
90‑91 |
100.0 |
100.0 |
100.0 |
100.0 |
100.0 |
|
91-92 |
101.6 |
102.4 |
102.5 |
101.6 |
104.9 |
|
92-93 |
105.9 |
107.3 |
104.9 |
103.7 |
108.4 |
|
93-94 |
105.6 |
107.5 |
106.1 |
105.0 |
109.2 |
|
94-95 |
103.2 |
105.3 |
110.5 |
111.3 |
108.4 |
|
95-96 |
97.7 |
98.8 |
112.8 |
115.2 |
106.0 |
|
96-97 |
93.6 |
93.3 |
118.4 |
123.8 |
103.4 |
|
97-98 |
91.8 |
90.3 |
124.9 |
133.0 |
102.4 |
|
98-99 |
93.5 |
92.1 |
130.7 |
139.9 |
105.1 |
|
99-00 |
100.5 |
101.3 |
141.0 |
152.2 |
109.8 |
|
00-01 |
109.6 |
110.5 |
150.7 |
162.3 |
118.3 |
|
01-02 |
119.2 |
122.3 |
155.4 |
167.4 |
122.0 |
|
02-03 |
131.4 |
136.4 |
162.4 |
174.7 |
128.5 |
Figure 1025: (cont'd)
|
FY |
Index (1990-91=100) |
|||||
|
|
Broad Provincial and Territorial Public Sector Wage Bill |
Broad Municipal Public Sector Wage Bill |
Nominal GDP |
Total Canadian Wage Bill (wages & salaries only) |
Federal Public Sector Wage Bill as a % of Nominal GDP |
Federal Public Sector Wage Bill as a % of Canadian Wage Bill |
|
90‑91 |
100.0 |
100.0 |
100.0 |
|
100.0 |
100.0 |
|
91-92 |
105.6 |
107.8 |
102.2 |
|
99.5 |
99.2 |
|
92-93 |
108.9 |
113.0 |
105.4 |
|
100.5 |
101.0 |
|
93-94 |
109.5 |
114.8 |
110.7 |
|
95.4 |
99.6 |
|
94-95 |
108.3 |
114.2 |
118.2 |
|
87.3 |
93.4 |
|
95-96 |
106.7 |
113.8 |
120.9 |
|
80.8 |
86.6 |
|
96-97 |
105.4 |
113.7 |
128.0 |
|
73.1 |
79.0 |
|
97-98 |
105.1 |
112.0 |
133.7 |
100.0 |
68.7 |
73.5 |
|
98-99 |
108.4 |
112.8 |
140.0 |
105.1 |
66.8 |
71.5 |
|
99-00 |
114.4 |
116.4 |
153.7 |
112.5 |
65.4 |
71.3 |
|
00-01 |
122.1 |
119.8 |
164.5 |
121.8 |
66.6 |
72.7 |
|
01-02 |
129.0 |
124.2 |
165.4 |
125.8 |
72.1 |
76.7 |
|
02-03 |
135.8 |
130.2 |
179.1 |
130.4 |
73.3 |
80.9 |
(1) Covers total payroll excluding Pay Equity for Core Public Service (PSSRA 1-1), Separate Employers (PSSRA 1-2), regular Canadian Forces (including allowances) and RCMP members. TBS Incumbent System, Statistics Canada, and RCMP.
(2) Average of four quarterly data on wages and salaries excluding Pay Equity for Public Service (PSSRA 1-1) and Separate Employers (PSSRA 1-2) for the fiscal year ended March 31. TBS Incumbent System.
(3) Wages, salaries and supplementary income in Canada, GDP, income-based, seasonally adjusted data at the annual rate for the first quarter to match the fiscal year. Statistics Canada CANSIM.
(4) Computed from taking the difference between total Canadian wage bill and public sector wage bill.
(5) Public sector includes all levels of governments and government business enterprises, Public Sector Employment, Statistics Canada CANSIM.
(6) Includes general government plus health and social services institutions, universities, colleges, vocational and trades institutions, and provincial and territorial government business enterprises. The sum of the wages and salaries for the 12 months ended March 31, Estimates of Labour Income, Statistics Canada CANSIM.
(7) Includes general government plus local school boards and local government business enterprises. The sum of the wages and salaries for the 12 months ended March 31. Statistics Canada, CANSIM.
(8) GDP at current prices, expenditure-based, seasonally adjusted quarterly data at annual rate for the first quarter, Statistics Canada, CANSIM.
(9) 12 month roll up of monthly wages and salaries for the year ended March 31, Estimates of Labour Income, Statistics Canada CANSIM.
Appendix K
Distribution of employees by gender in the federal public service for selected years, 1981 to 2005
|
Distribution of Employment Groups by Gender |
|||||
|
|
|
1981 |
1986 |
||
|
|
Note: female dominated groups are shaded |
Male |
Female |
Male |
Female |
|
|
Employment Groups |
% |
% |
% |
% |
|
AC |
Actuarial Science |
100% |
0% |
91% |
9% |
|
AG |
Agriculture |
96% |
4% |
86% |
14% |
|
AI |
Air Traffic Control |
98% |
2% |
96% |
4% |
|
AO |
Aircraft Operations |
99% |
1% |
96% |
4% |
|
AR |
Architecture & Town Planning |
93% |
7% |
87% |
13% |
|
AS |
Administrative Services |
63% |
37% |
53% |
47% |
|
AT |
Administrative Trainee |
55% |
45% |
33% |
68% |
|
AU |
Auditing |
95% |
5% |
91% |
9% |
|
BI |
Biological Sciences |
83% |
17% |
80% |
20% |
|
CA |
CAP Program |
na |
na |
na |
na |
|
CH |
Chemistry |
81% |
19% |
76% |
24% |
|
CM |
Communications |
58% |
42% |
62% |
38% |
|
CO |
Commerce Officer |
93% |
7% |
85% |
15% |
|
CR |
Clerical & Regulatory |
23% |
77% |
20% |
80% |
|
CS |
Computer Systems Admin. |
80% |
20% |
76% |
24% |
|
CX |
Correctional Services |
97% |
3% |
88% |
12% |
|
DA |
Data Processing |
20% |
80% |
22% |
78% |
|
DD |
Drafting & Illustration |
87% |
13% |
84% |
16% |
|
DE |
Dentistry |
100% |
0% |
92% |
8% |
|
DS |
Defense Scientific Service |
95% |
5% |
92% |
8% |
|
ED |
Education |
51% |
49% |
49% |
51% |
|
EG |
Engineering & Scientific Support |
84% |
16% |
83% |
17% |
|
EL |
Electronics |
99% |
1% |
98% |
2% |
|
EN |
Engineering & Land Survey |
99% |
1% |
96% |
4% |
|
ES |
Economics, Sociology & Statistics |
85% |
15% |
77% |
23% |
|
EU |
Educational Support |
26% |
74% |
29% |
71% |
|
EX |
Executive Group |
na |
na |
93% |
7% |
|
FI |
Financial Administration |
79% |
21% |
71% |
29% |
|
FO |
Forestry |
97% |
3% |
94% |
6% |
|
FR |
Firefighters |
100% |
0% |
99% |
1% |
|
FS |
Foreign Services |
92% |
8% |
83% |
17% |
|
GL |
General Labour & Trades |
98% |
2% |
98% |
2% |
|
GS |
General Services |
70% |
30% |
68% |
32% |
|
GT |
General Technical |
89% |
11% |
85% |
15% |
|
GX |
General Executive Group |
na |
na |
100% |
0% |
|
HE |
Home Economics |
2% |
98% |
0% |
100% |
|
HP |
Heating Power and Stationary Plant Operation |
100% |
0% |
99% |
1% |
|
HR |
Historical Research |
72% |
28% |
68% |
32% |
|
HS |
Hospital Services |
42% |
58% |
43% |
57% |
|
IS |
Information Services |
60% |
40% |
48% |
52% |
|
LA |
Law |
79% |
21% |
68% |
32% |
|
LI |
Lightkeepers |
98% |
2% |
97% |
3% |
|
LS |
Library Science |
35% |
65% |
33% |
67% |
|
MA |
Mathematics |
76% |
24% |
72% |
28% |
|
MD |
Medicine |
88% |
12% |
87% |
13% |
|
MM |
Management Trainee Group |
na |
na |
na |
na |
|
MT |
Meteorology |
96% |
4% |
92% |
8% |
|
ND |
Nutrition & Dietetics |
na |
na |
na |
na |
|
NU |
Nursing |
6% |
94% |
10% |
90% |
|
OE |
Office Equipment |
45% |
55% |
50% |
50% |
|
OM |
Organization & Methods |
84% |
16% |
73% |
27% |
|
OP |
Occupations & Physical Therapy |
8% |
92% |
3% |
97% |
|
PC |
Physical Sciences |
89% |
11% |
84% |
16% |
|
PE |
Personnel Administration |
64% |
36% |
51% |
49% |
|
PG |
Purchasing & Supply |
82% |
18% |
73% |
27% |
|
PH |
Pharmacy |
79% |
21% |
72% |
28% |
|
PI |
Primary Products Inspection |
95% |
5% |
92% |
8% |
|
PM |
Program Administration |
72% |
28% |
63% |
37% |
|
PR |
Printing Operations |
64% |
36% |
64% |
36% |
|
PS |
Psychology |
77% |
23% |
70% |
30% |
|
PY |
Photography |
92% |
8% |
87% |
13% |
|
RO |
Radio Operations |
96% |
4% |
93% |
7% |
|
SC |
Ships Crew |
98% |
2% |
97% |
3% |
|
SE |
Scientific Research |
97% |
3% |
95% |
5% |
|
SG |
Patent Examination |
91% |
9% |
83% |
17% |
|
SI |
Social Science Support |
55% |
45% |
49% |
51% |
|
SM |
Senior Manager |
na |
na |
90% |
10% |
|
SO |
Ships Officers |
97% |
3% |
95% |
5% |
|
SR |
Ships Repair |
100% |
0% |
100% |
0% |
|
ST |
Secretarial, Stenographic, Typing |
1% |
99% |
1% |
99% |
|
SW |
Social Work |
76% |
24% |
69% |
31% |
|
SX |
Senior Manager |
96% |
4% |
na |
na |
|
TE |
RCMP Special Group |
na |
na |
na |
na |
|
TI |
Technical Inspection |
99% |
1% |
98% |
2% |
|
TR |
Translation |
51% |
49% |
49% |
51% |
|
UT |
University Teaching |
97% |
3% |
95% |
5% |
|
VS |
Veterinary Science |
93% |
7% |
88% |
12% |
|
WP |
Welfare Programs |
76% |
24% |
67% |
33% |
|
|
Grand Total |
59% |
41% |
56% |
44% |
|
Distribution of Employment Groups by Gender
|
|||||
|
|
|
1991 |
1996 |
||
|
|
Note: female dominated groups are shaded |
Male |
Female |
Male |
Female |
|
|
Employment Groups |
% |
% |
% |
% |
|
AC |
Actuarial Science |
100% |
0% |
75% |
25% |
|
AG |
Agriculture |
76% |
24% |
73% |
27% |
|
AI |
Air Traffic Control |
95% |
5% |
93% |
7% |
|
AO |
Aircraft Operations |
95% |
5% |
94% |
6% |
|
AR |
Architecture & Town Planning |
83% |
17% |
82% |
18% |
|
AS |
Administrative Services |
46% |
54% |
39% |
61% |
|
AT |
Administrative Trainee |
53% |
47% |
na |
na |
|
AU |
Auditing |
81% |
19% |
76% |
24% |
|
BI |
Biological Sciences |
74% |
26% |
67% |
33% |
|
CA |
CAP Program |
na |
na |
na |
na |
|
CH |
Chemistry |
72% |
28% |
68% |
32% |
|
CM |
Communications |
68% |
32% |
68% |
32% |
|
CO |
Commerce Officer |
78% |
22% |
72% |
28% |
|
CR |
Clerical & Regulatory |
19% |
81% |
17% |
83% |
|
CS |
Computer Systems Admin. |
74% |
26% |
72% |
28% |
|
CX |
Correctional Services |
86% |
14% |
82% |
18% |
|
DA |
Data Processing |
21% |
79% |
18% |
82% |
|
DD |
Drafting & Illustration |
81% |
19% |
74% |
26% |
|
DE |
Dentistry |
96% |
4% |
100% |
0% |
|
DS |
Defense Scientific Service |
91% |
9% |
91% |
9% |
|
ED |
Education |
50% |
50% |
48% |
52% |
|
EG |
Engineering & Scientific Support |
81% |
19% |
77% |
23% |
|
EL |
Electronics |
98% |
2% |
97% |
3% |
|
EN |
Engineering & Land Survey |
94% |
6% |
91% |
9% |
|
ES |
Economics, Sociology & Statistics |
72% |
28% |
67% |
33% |
|
EU |
Educational Support |
37% |
63% |
100% |
0% |
|
EX |
Executive Group |
86% |
14% |
79% |
21% |
|
FI |
Financial Administration |
65% |
35% |
61% |
39% |
|
FO |
Forestry |
91% |
9% |
88% |
12% |
|
FR |
Firefighters |
98% |
2% |
99% |
1% |
|
FS |
Foreign Services |
79% |
21% |
73% |
27% |
|
GL |
General Labour & Trades |
97% |
3% |
96% |
4% |
|
GS |
General Services |
66% |
34% |
68% |
32% |
|
GT |
General Technical |
80% |
20% |
75% |
25% |
|
GX |
General Executive Group |
100% |
0% |
100% |
0% |
|
HE |
Home Economics |
0% |
100% |
0% |
100% |
|
HP |
Heating Power and Stationary Plant Operation |
99% |
1% |
98% |
2% |
|
HR |
Historical Research |
67% |
33% |
63% |
37% |
|
HS |
Hospital Services |
45% |
55% |
48% |
52% |
|
IS |
Information Services |
42% |
58% |
39% |
61% |
|
LA |
Law |
62% |
38% |
56% |
44% |
|
LI |
Lightkeepers |
98% |
2% |
98% |
2% |
|
LS |
Library Science |
30% |
70% |
27% |
73% |
|
MA |
Mathematics |
67% |
33% |
64% |
36% |
|
MD |
Medicine |
79% |
21% |
75% |
25% |
|
MM |
Management Trainee Group |
na |
na |
46% |
54% |
|
MT |
Management Trainee Group |
89% |
11% |
87% |
13% |
|
ND |
Nutrition & Dietetics |
na |
na |
na |
na |
|
NU |
Nursing |
12% |
88% |
14% |
86% |
|
OE |
Office Equipment |
47% |
53% |
45% |
55% |
|
OM |
Organization & Methods |
64% |
37% |
54% |
46% |
|
OP |
Occupations & Physical Therapy |
5% |
95% |
11% |
89% |
|
PC |
Physical Sciences |
79% |
21% |
73% |
27% |
|
PE |
Personnel Administration |
40% |
60% |
34% |
66% |
|
PG |
Purchasing & Supply |
63% |
37% |
55% |
45% |
|
PH |
Pharmacy |
57% |
43% |
39% |
61% |
|
PI |
Primary Products Inspection |
88% |
12% |
85% |
15% |
|
PM |
Program Administration |
55% |
45% |
48% |
52% |
|
PR |
Printing Operations |
62% |
38% |
50% |
50% |
|
PS |
Psychology |
65% |
35% |
62% |
38% |
|
PY |
Photography |
88% |
12% |
90% |
10% |
|
RO |
Radio Operations |
90% |
10% |
87% |
13% |
|
SC |
Ships Crew |
96% |
4% |
96% |
4% |
|
SE |
Scientific Research |
91% |
9% |
88% |
12% |
|
SG |
Patent Examination |
68% |
32% |
65% |
35% |
|
SI |
Social Science Support |
45% |
55% |
43% |
57% |
|
SM |
Senior Manager |
82% |
18% |
na |
na |
|
SO |
Ships Officers |
96% |
4% |
96% |
4% |
|
SR |
Ships Repair |
99% |
1% |
98% |
2% |
|
ST |
Secretarial, Stenographic, Typing |
2% |
98% |
1% |
99% |
|
SW |
Social Work |
62% |
38% |
57% |
43% |
|
SX |
Senior Manager |
na |
na |
na |
na |
|
TE |
RCMP Special Group |
na |
na |
na |
na |
|
TI |
Technical Inspection |
96% |
4% |
94% |
6% |
|
TR |
Translation |
44% |
56% |
43% |
57% |
|
UT |
University Teaching |
97% |
3% |
95% |
5% |
|
VS |
Veterinary Science |
83% |
17% |
79% |
21% |
|
WP |
Welfare Programs |
59% |
41% |
55% |
45% |
|
|
Grand Total |
53% |
47% |
52% |
48% |
|
Distribution of Employment Groups by Gender |
|||||
|
|
|
2001 |
2002 |
||
|
|
Note: female dominated groups are shaded |
Male |
Female |
Male |
Female |
|
|
Employment Groups |
% |
% |
% |
% |
|
AC |
Actuarial Science |
100% |
0% |
75% |
25% |
|
AG |
Agriculture |
89% |
11% |
88% |
13% |
|
AI |
Air Traffic Control |
100% |
0% |
92% |
8% |
|
AO |
Aircraft Operations |
92% |
8% |
92% |
8% |
|
AR |
Architecture & Town Planning |
75% |
25% |
73% |
27% |
|
AS |
Administrative Services |
29% |
71% |
27% |
73% |
|
AT |
Administrative Trainee |
na |
na |
na |
na |
|
AU |
Auditing |
73% |
27% |
71% |
29% |
|
BI |
Biological Sciences |
60% |
40% |
59% |
41% |
|
CA |
CAP Program |
38% |
62% |
38% |
62% |
|
CH |
Chemistry |
61% |
39% |
61% |
39% |
|
CM |
Communications |
70% |
30% |
65% |
35% |
|
CO |
Commerce Officer |
62% |
38% |
60% |
40% |
|
CR |
Clerical & Regulatory |
17% |
83% |
18% |
82% |
|
CS |
Computer Systems Admin. |
70% |
30% |
70% |
30% |
|
CX |
Correctional Services |
78% |
22% |
78% |
22% |
|
DA |
Data Processing |
38% |
62% |
38% |
62% |
|
DD |
Drafting & Illustration |
64% |
36% |
62% |
38% |
|
DE |
Dentistry |
100% |
0% |
100% |
0% |
|
DS |
Defense Scientific Service |
85% |
15% |
86% |
14% |
|
ED |
Education |
44% |
56% |
41% |
59% |
|
EG |
Engineering & Scientific Support |
71% |
29% |
71% |
29% |
|
EL |
Electronics |
97% |
3% |
97% |
3% |
|
EN |
Engineering & Land Survey |
89% |
11% |
87% |
13% |
|
ES |
Economics, Sociology & Statistics |
58% |
42% |
57% |
43% |
|
EU |
Educational Support |
100% |
0% |
100% |
0% |
|
EX |
Executive Group |
70% |
30% |
68% |
32% |
|
FI |
Financial Administration |
52% |
48% |
51% |
49% |
|
FO |
Forestry |
83% |
17% |
83% |
17% |
|
FR |
Firefighters |
98% |
2% |
98% |
2% |
|
FS |
Foreign Services |
67% |
33% |
65% |
35% |
|
GL |
General Labour & Trades |
94% |
6% |
95% |
5% |
|
GS |
General Services |
66% |
34% |
66% |
34% |
|
GT |
General Technical |
72% |
28% |
73% |
27% |
|
GX |
General Executive Group |
83% |
17% |
100% |
0% |
|
HE |
Home Economics |
na |
na |
na |
na |
|
HP |
Heating Power and Stationary Plant Operation |
99% |
1% |
99% |
1% |
|
HR |
Historical Research |
62% |
38% |
59% |
41% |
|
HS |
Hospital Services |
42% |
58% |
41% |
59% |
|
IS |
Information Services |
33% |
67% |
32% |
68% |
|
LA |
Law |
50% |
50% |
50% |
50% |
|
LI |
Lightkeepers |
96% |
4% |
97% |
3% |
|
LS |
Library Science |
27% |
73% |
28% |
72% |
|
MA |
Mathematics |
64% |
36% |
65% |
35% |
|
MD |
Medicine |
72% |
28% |
69% |
31% |
|
MM |
Management Trainee Group |
45% |
55% |
44% |
56% |
|
MT |
Management Trainee Group |
85% |
15% |
85% |
15% |
|
ND |
Nutrition & Dietetics |
0% |
100% |
0% |
100% |
|
NU |
Nursing |
16% |
84% |
16% |
84% |
|
OE |
Office Equipment |
48% |
52% |
27% |
73% |
|
OM |
Organization & Methods |
44% |
56% |
41% |
59% |
|
OP |
Occupations & Physical Therapy |
20% |
80% |
20% |
80% |
|
PC |
Physical Sciences |
66% |
34% |
65% |
35% |
|
PE |
Personnel Administration |
28% |
72% |
28% |
72% |
|
PG |
Purchasing & Supply |
51% |
49% |
50% |
50% |
|
PH |
Pharmacy |
33% |
67% |
33% |
67% |
|
PI |
Primary Products Inspection |
83% |
17% |
82% |
18% |
|
PM |
Program Administration |
38% |
62% |
37% |
63% |
|
PR |
Printing Operations |
53% |
47% |
54% |
46% |
|
PS |
Psychology |
53% |
47% |
52% |
48% |
|
PY |
Photography |
78% |
22% |
79% |
21% |
|
RO |
Radio Operations |
82% |
18% |
82% |
18% |
|
SC |
Ships Crew |
95% |
5% |
95% |
5% |
|
SE |
Scientific Research |
84% |
16% |
84% |
16% |
|
SG |
Patent Examination |
57% |
43% |
56% |
44% |
|
SI |
Social Science Support |
38% |
62% |
37% |
63% |
|
SM |
Senior Manager |
na |
na |
na |
na |
|
SO |
Ships Officers |
94% |
6% |
94% |
6% |
|
SR |
Ships Repair |
98% |
2% |
98% |
2% |
|
ST |
Secretarial, Stenographic, Typing |
2% |
98% |
2% |
98% |
|
SW |
Social Work |
34% |
66% |
27% |
73% |
|
SX |
Senior Manager |
na |
na |
na |
na |
|
TE |
RCMP Special Group |
47% |
53% |
49% |
51% |
|
TI |
Technical Inspection |
91% |
9% |
91% |
9% |
|
TR |
Translation |
37% |
63% |
34% |
66% |
|
UT |
University Teaching |
92% |
8% |
85% |
15% |
|
VS |
Veterinary Science |
63% |
37% |
na |
na |
|
WP |
Welfare Programs |
47% |
53% |
46% |
54% |
|
|
Grand Total |
48% |
52% |
47% |
53% |
| Distribution of Employment Groups by Gender as of March 31 for respective year |
|||||
| 2003 | 2004 | ||||
|
Note: female dominated groups are shaded |
Male | Female | Male | Female | |
|
|
Employment Groups |
% |
% |
% |
% |
|
AC |
Actuarial Science |
75% |
25% |
80% |
20% |
|
AG |
Agriculture |
86% |
14% |
86% |
14% |
|
AI |
Air Traffic Control |
92% |
8% |
92% |
8% |
|
AO |
Aircraft Operations |
92% |
8% |
92% |
8% |
|
AR |
Architecture & Town Planning |
74% |
26% |
71% |
29% |
|
AS |
Administrative Services |
26% |
74% |
25% |
75% |
|
AT |
Administrative Trainee |
na |
na |
na |
na |
|
AU |
Auditing |
69% |
31% |
69% |
31% |
|
BI |
Biological Sciences |
58% |
42% |
57% |
43% |
|
CA |
CAP Program |
44% |
56% |
46% |
54% |
|
CH |
Chemistry |
61% |
39% |
59% |
41% |
|
CM |
Communications |
68% |
32% |
75% |
25% |
|
CO |
Commerce Officer |
59% |
41% |
59% |
41% |
|
CR |
Clerical & Regulatory |
18% |
82% |
18% |
82% |
|
CS |
Computer Systems Admin. |
70% |
30% |
70% |
30% |
|
CX |
Correctional Services |
77% |
23% |
76% |
24% |
|
DA |
Data Processing |
38% |
62% |
39% |
61% |
|
DD |
Drafting & Illustration |
62% |
38% |
62% |
38% |
|
DE |
Dentistry |
100% |
0% |
100% |
0% |
|
DS |
Defense Scientific Service |
84% |
16% |
84% |
16% |
|
ED |
Education |
40% |
60% |
38% |
62% |
|
EG |
Engineering & Scientific Support |
71% |
29% |
70% |
30% |
|
EL |
Electronics |
96% |
4% |
96% |
4% |
|
EN |
Engineering & Land Survey |
86% |
14% |
86% |
14% |
|
ES |
Economics, Sociology & Statistics |
55% |
45% |
54% |
46% |
|
EU |
Educational Support |
12% |
88% |
13% |
88% |
|
EX |
Executive Group |
66% |
34% |
65% |
35% |
|
FI |
Financial Administration |
50% |
50% |
49% |
51% |
|
FO |
Forestry |
80% |
20% |
84% |
16% |
|
FR |
Firefighters |
98% |
2% |
98% |
2% |
|
FS |
Foreign Services |
64% |
36% |
63% |
37% |
|
GL |
General Labour & Trades |
95% |
5% |
95% |
5% |
|
GS |
General Services |
64% |
36% |
63% |
37% |
|
GT |
General Technical |
71% |
29% |
72% |
28% |
|
GX |
General Executive Group |
100% |
0% |
86% |
14% |
|
HE |
Home Economics |
na |
na |
na |
na |
|
HP |
Heating Power and Stationary Plant Operation |
99% |
1% |
99% |
1% |
|
HR |
Historical Research |
60% |
40% |
61% |
39% |
|
HS |
Hospital Services |
42% |
58% |
41% |
59% |
|
IS |
Information Services |
32% |
68% |
32% |
68% |
|
LA |
Law |
49% |
51% |
49% |
51% |
|
LI |
Lightkeepers |
95% |
5% |
93% |
7% |
|
LS |
Library Science |
27% |
73% |
25% |
75% |
|
MA |
Mathematics |
63% |
37% |
64% |
36% |
|
MD |
Medicine |
67% |
33% |
65% |
35% |
|
MM |
Management Trainee Group |
38% |
62% |
37% |
63% |
|
MT |
Management Trainee Group |
83% |
17% |
83% |
17% |
|
ND |
Nutrition & Dietetics |
0% |
100% |
0% |
100% |
|
NU |
Nursing |
15% |
85% |
15% |
85% |
|
OE |
Office Equipment |
42% |
58% |
31% |
69% |
|
OM |
Organization & Methods |
39% |
61% |
40% |
60% |
|
OP |
Occupations & Physical Therapy |
20% |
80% |
24% |
76% |
|
PC |
Physical Sciences |
63% |
37% |
62% |
38% |
|
PE |
Personnel Administration |
27% |
73% |
26% |
74% |
|
PG |
Purchasing & Supply |
50% |
50% |
48% |
52% |
|
PH |
Pharmacy |
33% |
67% |
30% |
70% |
|
PI |
Primary Products Inspection |
79% |
21% |
79% |
21% |
|
PM |
Program Administration |
36% |
64% |
35% |
65% |
|
PR |
Printing Operations |
74% |
26% |
70% |
30% |
|
PS |
Psychology |
51% |
49% |
50% |
50% |
|
PY |
Photography |
79% |
21% |
82% |
18% |
|
RO |
Radio Operations |
82% |
18% |
81% |
19% |
|
SC |
Ships Crew |
94% |
6% |
94% |
6% |
|
SE |
Scientific Research |
84% |
16% |
83% |
17% |
|
SG |
Patent Examination |
52% |
48% |
51% |
49% |
|
SI |
Social Science Support |
37% |
63% |
37% |
63% |
|
SM |
Senior Manager |
na |
na |
na |
na |
|
SO |
Ships Officers |
94% |
6% |
93% |
7% |
|
SR |
Ships Repair |
97% |
3% |
97% |
3% |
|
ST |
Secretarial, Stenographic, Typing |
2% |
98% |
2% |
98% |
|
SW |
Social Work |
26% |
74% |
22% |
78% |
|
SX |
Senior Manager |
na |
na |
na |
na |
|
TE |
RCMP Special Group |
43% |
57% |
46% |
54% |
|
TI |
Technical Inspection |
90% |
10% |
89% |
11% |
|
TR |
Translation |
33% |
67% |
32% |
68% |
|
UT |
University Teaching |
86% |
14% |
84% |
16% |
|
VS |
Veterinary Science |
49% |
51% |
46% |
54% |
|
WP |
Welfare Programs |
46% |
54% |
46% |
54% |
|
|
Grand Total |
47% |
53% |
47% |
53% |
|
Distribution of Employment Groups by Gender |
|||
|
|
|
2005 |
|
|
|
Note: female dominated groups are shaded |
Male |
Female |
|
|
Employment Groups |
% |
% |
|
AC |
Actuarial Science |
75% |
25% |
|
AG |
Agriculture |
89% |
11% |
|
AI |
Air Traffic Control |
93% |
7% |
|
AO |
Aircraft Operations |
91% |
9% |
|
AR |
Architecture & Town Planning |
71% |
29% |
|
AS |
Administrative Services |
24% |
76% |
|
AT |
Administrative Trainee |
na |
na |
|
AU |
Auditing |
67% |
33% |
|
BI |
Biological Sciences |
56% |
44% |
|
CA |
CAP Program |
50% |
50% |
|
CH |
Chemistry |
58% |
42% |
|
CM |
Communications |
76% |
24% |
|
CO |
Commerce Officer |
59% |
41% |
|
CR |
Clerical & Regulatory |
18% |
82% |
|
CS |
Computer Systems Admin. |
71% |
29% |
|
CX |
Correctional Services |
75% |
25% |
|
DA |
Data Processing |
44% |
56% |
|
DD |
Drafting & Illustration |
64% |
36% |
|
DE |
Dentistry |
100% |
0% |
|
DS |
Defense Scientific Service |
83% |
17% |
|
ED |
Education |
34% |
66% |
|
EG |
Engineering & Scientific Support |
70% |
30% |
|
EL |
Electronics |
96% |
4% |
|
EN |
Engineering & Land Survey |
85% |
15% |
|
ES |
Economics, Sociology & Statistics |
53% |
47% |
|
EU |
Educational Support |
13% |
88% |
|
EX |
Executive Group |
63% |
37% |
|
FI |
Financial Administration |
48% |
52% |
|
FO |
Forestry |
82% |
18% |
|
FR |
Firefighters |
98% |
2% |
|
FS |
Foreign Services |
62% |
38% |
|
GL |
General Labour & Trades |
95% |
5% |
|
GS |
General Services |
62% |
38% |
|
GT |
General Technical |
73% |
27% |
|
GX |
General Executive Group |
100% |
0% |
|
HE |
Home Economics |
na |
na |
|
HP |
Heating Power and Stationary Plant Operation |
99% |
1% |
|
HR |
Historical Research |
58% |
42% |
|
HS |
Hospital Services |
42% |
58% |
|
IS |
Information Services |
32% |
68% |
|
LA |
Law |
48% |
52% |
|
LI |
Lightkeepers |
87% |
13% |
|
LS |
Library Science |
26% |
74% |
|
MA |
Mathematics |
61% |
39% |
|
MD |
Medicine |
64% |
36% |
|
MM |
Management Trainee Group |
42% |
58% |
|
MT |
Management Trainee Group |
82% |
18% |
|
ND |
Nutrition & Dietetics |
2% |
98% |
|
NU |
Nursing |
15% |
85% |
|
OE |
Office Equipment |
31% |
69% |
|
OM |
Organization & Methods |
41% |
59% |
|
OP |
Occupations & Physical Therapy |
27% |
73% |
|
PC |
Physical Sciences |
61% |
39% |
|
PE |
Personnel Administration |
25% |
75% |
|
PG |
Purchasing & Supply |
47% |
53% |
|
PH |
Pharmacy |
29% |
71% |
|
PI |
Primary Products Inspection |
78% |
22% |
|
PM |
Program Administration |
39% |
61% |
|
PR |
Printing Operations |
73% |
27% |
|
PS |
Psychology |
50% |
50% |
|
PY |
Photography |
91% |
9% |
|
RO |
Radio Operations |
80% |
20% |
|
SC |
Ships Crew |
93% |
7% |
|
SE |
Scientific Research |
83% |
17% |
|
SG |
Patent Examination |
49% |
51% |
|
SI |
Social Science Support |
37% |
63% |
|
SM |
Senior Manager |
na |
na |
|
SO |
Ships Officers |
93% |
7% |
|
SR |
Ships Repair |
97% |
3% |
|
ST |
Secretarial, Stenographic, Typing |
2% |
98% |
|
SW |
Social Work |
24% |
76% |
|
SX |
Senior Manager |
na |
na |
|
TE |
RCMP Special Group |
47% |
53% |
|
TI |
Technical Inspection |
89% |
11% |
|
TR |
Translation |
31% |
69% |
|
UT |
University Teaching |
88% |
12% |
|
VS |
Veterinary Science |
45% |
55% |
|
WP |
Welfare Programs |
44% |
56% |
|
|
Grand Total |
46% |
54% |
Source: Incumbent database.
Definition of female dominated group based on Cdn. Human Rights Commission equal pay guidelines
|
Total population of group |
% of females |
|
> 500 |
55% |
|
100 - 499 |
60% |
|
< 100 |
70% |
Appendix L
Summary of population changes since 1991 in classification groups with at least 2,000 members in March 2003
Administration and Foreign Service Category
|
Groups |
1991 |
1994 |
1998 |
2001 |
2003 |
Variance |
|
Program Administration |
31,767 |
34,855 |
34,698 |
37,432 |
38,297 |
+21% |
|
Administrative Services |
15,049 |
16,566 |
15,206 |
20,147 |
24,694 |
+64% |
|
Computer Systems |
5,507 |
7,153 |
9,396 |
12,436 |
15,091 |
+174% |
|
Personnel Administration |
3,214 |
3,343 |
2,890 |
3,616 |
4,204 |
+31% |
|
Financial Administration |
2,803 |
2,828 |
2,328 |
2,921 |
3,384 |
+21% |
|
Commerce |
2,252 |
2,396 |
2,183 |
2,695 |
3,328 |
+48% |
|
Information Services |
1,631 |
1,712 |
1,744 |
2,568 |
3,088 |
+89% |
|
Welfare Programs |
1,689 |
1,760 |
2,054 |
2,340 |
2,398 |
+42% |
|
Purchasing and Supply |
2,482 |
2,526 |
1,965 |
2,297 |
2,605 |
+5% |
|
Subtotal |
65,874 |
72,438 |
71,788 |
85,727 |
96,212 |
+46% |
|
% of total population |
27% |
31% |
37% |
41% |
43% |
|
Scientific and Professional Category
|
Groups |
1991 |
1994 |
1998 |
2001 |
2003 |
Variance |
|
Eco-Sociology & Stat. |
2,622 |
2,899 |
3,147 |
4,315 |
5,644 |
+115% |
|
Auditing |
4,662 |
5,354 |
5,531 |
5,618 |
5,161 |
+11% |
|
Eng & Land Survey |
2,928 |
2,987 |
2,125 |
2,142 |
2,615 |
-11% |
|
Law |
1,115 |
1,402 |
1,612 |
2,148 |
2,588 |
+132% |
|
Biological Sciences |
1,253 |
1,293 |
1,345 |
1,880 |
2,320 |
+85% |
|
Physical Sciences |
1,092 |
1,434 |
1,387 |
1,876 |
2,096 |
+92% |
|
Subtotal |
13,672 |
15,369 |
15,147 |
17,979 |
20,424 |
+49% |
|
% of total population |
6% |
7% |
8% |
8% |
9% |
|
Technical Category
|
Groups |
1991 |
1994 |
1998 |
2001 |
2003 |
Variance |
|
Eng & Scientific Support |
7,536 |
7,527 |
6,077 |
8,423 |
9,127 |
+21% |
|
Social Science Support |
2,493 |
2,561 |
2,792 |
3,407 |
3,730 |
+50% |
|
General Technical |
3,177 |
3,282 |
2,419 |
2,782 |
2,853 |
-10% |
|
Subtotal |
13,206 |
13,370 |
11,288 |
14,612 |
15,710 |
+19% |
|
% of total population |
5% |
6% |
6% |
7% |
7% |
|
Administrative Support Category
|
Groups |
1991 |
1994 |
1998 |
2001 |
2003 |
Variance |
|
Clerical and Regulatory |
59,943 |
53,927 |
42,384 |
44,186 |
43,314 |
-28% |
|
Data Processing |
4,470 |
3,518 |
2,369 |
2,589 |
2,412 |
-46% |
|
Stenographic and Typing |
13,026 |
9,977 |
5,633 |
3,981 |
2,290 |
-82% |
|
Subtotal |
77,439 |
67422 |
50,386 |
50,756 |
48,016 |
-38% |
|
% of total population |
32% |
29% |
26% |
24% |
21% |
|
Operational Category
|
Groups |
1991 |
1994 |
1998 |
2001 |
2003 |
Variance |
|
Correctional Services |
4,556 |
4,448 |
4,935 |
5,789 |
6,171 |
+35% |
|
General Labour & Trades |
14,722 |
12,922 |
8,234 |
6,639 |
6,501 |
-56% |
|
General Services |
9,770 |
7,965 |
4,290 |
3,863 |
3,865 |
-60% |
|
Subtotal |
29,048 |
25,335 |
17,459 |
16,291 |
16,537 |
-43% |
|
% of total population |
12% |
11% |
9% |
8% |
7% |
|
Appendix M
Overview of reclassification movements within and from the Clerical and Regulatory (CR) and Economist (ES) groups, 2002‑03
Reclassification of the Clerical and Regulatory (CR) Group
Reclassification of the Economics (ES) Group
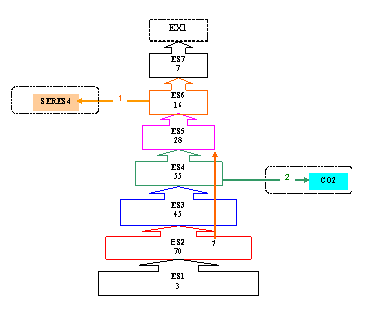
Appendix N
Summary of leave usage in the core public service domain, from 1991–92 to 2002–2003, and chart summarizing changes in annual leave entitlement applying to the Clerical and Regulatory (CR) classification group
|
Leave |
|||||
|
Paid Leave FY 02-03 |
|||||
|
Paid Leave |
Days (millions) |
Percentage |
Average Days per Capita |
Estimated Value (millions $) Current |
Estimated Value (millions $) Constant |
|
Vacation Leave |
3.25 |
42.0% |
17.3 |
$677.30 |
$677.30 |
|
Statutory Holidays |
2.07 |
26.7% |
11.0 |
$430.80 |
$430.80 |
|
Sick Leave |
1.56 |
20.2% |
8.3 |
$325.28 |
$325.28 |
|
Family Related Leave |
0.30 |
3.8% |
1.6 |
$61.70 |
$61.70 |
|
Compensatory leave |
0.20 |
2.6% |
1.1 |
$41.44 |
$41.44 |
|
Personal and Volunteer Leave |
0.17 |
2.2% |
0.9 |
$35.66 |
$35.66 |
|
Other Leave |
0.20 |
2.6% |
1.1 |
$41.26 |
$41.26 |
|
Total |
7.74 |
100.0% |
41.2 |
$1,613.44 |
$1,613.44 |
Source: Leave Reporting System FY 02-03 for all Active Employees.
|
Leave |
|||||
|
Paid Leave FY 01–02 |
|||||
|
Paid Leave |
Days (millions) |
Percentage |
Average Days per Capita |
Estimated Value (millions $) Current |
Estimated Value (millions $) Constant |
|
Vacation Leave |
3.03 |
42.6% |
16.7 |
$605.07 |
$621.85 |
|
Statutory Holidays |
1.99 |
28.0% |
11.0 |
$398.51 |
$409.55 |
|
Sick Leave |
1.41 |
19.8% |
7.8 |
$281.46 |
$289.27 |
|
Family Related Leave |
0.26 |
3.6% |
1.4 |
$51.43 |
$52.86 |
|
Compensatory leave |
0.19 |
2.6% |
1.0 |
$37.09 |
$38.12 |
|
Personal and Volunteer Leave |
0.05 |
0.7% |
0.3 |
$10.53 |
$10.82 |
|
Other Leave |
0.19 |
2.7% |
1.0 |
$37.78 |
$38.83 |
|
Total |
7.12 |
100.0% |
39.2 |
$1,421.88 |
$1,461.30 |
Source: Leave Reporting System FY 01–02 for all Active Employees.
|
Leave |
|||||
|
Paid Leave FY 00–01 |
|||||
|
|
Days (millions) |
Percentage |
Average Days per Capita |
Estimated Value (millions $) Current |
Estimated Value (millions $) Constant |
|
Vacation Leave |
2.91 |
43.3% |
17.1 |
$541.51 |
$568.96 |
|
Statutory Holidays |
1.87 |
27.9% |
11.0 |
$348.64 |
$366.31 |
|
Sick Leave |
1.33 |
19.8% |
7.8 |
$247.15 |
$259.69 |
|
Family Related Leave |
0.23 |
3.5% |
1.4 |
$43.45 |
$45.66 |
|
Compensatory leave |
0.20 |
3.0% |
1.2 |
$37.60 |
$39.50 |
|
Personal and Volunteer Leave |
0 |
0.0% |
0.0 |
$0.00 |
$0.00 |
|
Other Leave |
0.17 |
2.5% |
1.0 |
$31.43 |
$33.02 |
|
Total |
6.71 |
100.0% |
39.4 |
$1,249.77 |
$1,313.14 |
Source: Leave Reporting System FY 00–01 for all Active Employees.
|
Leave |
|||||
|
Paid Leave FY 99–00 |
|||||
|
Paid Leave |
Days (millions) |
Percentage |
Average Days per Capita |
Estimated Value (millions $) Current |
Estimated Value (millions $) Constant |
|
Vacation Leave |
3.32 |
42.9% |
16.3 |
$593.48 |
$639.49 |
|
Statutory Holidays |
2.27 |
29.3% |
11.0 |
$405.14 |
$436.56 |
|
Sick Leave |
1.47 |
19.0% |
7.2 |
$263.10 |
$283.50 |
|
Family Related Leave |
0.26 |
3.3% |
1.3 |
$45.77 |
$49.32 |
|
Compensatory leave |
0.21 |
2.7% |
1.0 |
$36.70 |
$39.55 |
|
Personal and Volunteer Leave |
0 |
0.0% |
0.0 |
$0.00 |
$0.00 |
|
Other Leave |
0.22 |
2.8% |
1.1 |
$39.20 |
$42.24 |
|
Total |
7.75 |
100.0% |
37.8 |
$1,383.39 |
$1,490.65 |
Source: Leave Reporting System FY 99–00 for all Active Employees.
|
Leave |
|||||
|
Paid Leave FY 98–99 |
|||||
|
Paid Leave |
Days (millions) |
Percentage |
Average Days per Capita |
Estimated Value (millions $) Current |
Estimated Value (millions $) Constant |
|
Vacation Leave |
3.38 |
41.9% |
16.4 |
$570.94 |
$631.88 |
|
Statutory Holidays |
2.27 |
28.2% |
11.0 |
$383.60 |
$424.55 |
|
Sick Leave |
1.63 |
20.2% |
7.9 |
$275.42 |
$304.82 |
|
Family Related Leave |
0.27 |
3.4% |
1.3 |
$45.76 |
$50.65 |
|
Compensatory leave |
0.21 |
2.6% |
1.0 |
$35.47 |
$39.26 |
|
Personal and Volunteer Leave |
0 |
0.0% |
0.0 |
$0.00 |
$0.00 |
|
Other Leave |
0.30 |
3.7% |
1.4 |
$50.04 |
$55.39 |
|
Total |
8.05 |
100.0% |
39.0 |
$1,361.24 |
$1,506.54 |
Source: Leave Reporting System FY 98–99 for all Active Employees.
|
Leave |
|||||
|
Paid Leave FY 97–98 |
|||||
|
Paid Leave |
Days (millions) |
Percentage |
Average Days per Capita |
Estimated Value (millions $) Current |
Estimated Value (millions $) Constant |
|
Vacation Leave |
3.49 |
42.6% |
16.9 |
$551.91 |
$621.52 |
|
Statutory Holidays |
2.27 |
27.7% |
11.0 |
$358.80 |
$404.06 |
|
Sick Leave |
1.69 |
20.7% |
8.2 |
$267.56 |
$301.31 |
|
Family Related Leave |
0.27 |
3.3% |
1.3 |
$42.47 |
$47.83 |
|
Compensatory leave |
0.20 |
2.5% |
1.0 |
$32.29 |
$36.36 |
|
Personal and Volunteer Leave |
0 |
0.0% |
0.0 |
$0.00 |
$0.00 |
|
Other Leave |
0.27 |
3.3% |
1.3 |
$42.63 |
$48.01 |
|
Total |
8.20 |
100.0% |
39.7 |
$1,295.66 |
$1,459.09 |
Source: Leave Reporting System FY 97–98 for all Active Employees.
|
Leave |
|||||
|
Paid Leave FY 96–97 |
|||||
|
Paid Leave |
Days (millions) |
Percentage |
Average Days per Capita |
Estimated Value (millions $) Current |
Estimated Value (millions $) Constant |
|
Vacation Leave |
3.73 |
43.1% |
17.5 |
$581.98 |
$661.47 |
|
Statutory Holidays |
2.35 |
27.1% |
11.0 |
$365.97 |
$415.96 |
|
Sick Leave |
1.85 |
21.4% |
8.7 |
$288.86 |
$328.31 |
|
Family Related Leave |
0.28 |
3.2% |
1.3 |
$43.31 |
$49.22 |
|
Compensatory leave |
0.19 |
2.2% |
0.9 |
$29.86 |
$33.94 |
|
Personal and Volunteer Leave |
0 |
0.0% |
0.0 |
$0.00 |
$0.00 |
|
Other Leave |
0.26 |
3.0% |
1.2 |
$40.27 |
$45.77 |
|
Total |
8.65 |
100.0% |
40.6 |
$1,350.25 |
$1,534.67 |
Source: Leave Reporting System FY 96–97 for all Active Employees.
|
Leave |
|||||
|
Paid Leave FY 95–96 |
|||||
|
Paid Leave |
Days (millions) |
Percentage |
Average Days per Capita |
Estimated Value (millions $) Current |
Estimated Value (millions $) Constant |
|
Vacation Leave |
4.08 |
42.8% |
17.2 |
$636.16 |
$734.69 |
|
Statutory Holidays |
2.61 |
27.4% |
11.0 |
$407.39 |
$470.48 |
|
Sick Leave |
2.06 |
21.6% |
8.7 |
$321.28 |
$371.04 |
|
Family Related Leave |
0.30 |
3.1% |
1.2 |
$46.22 |
$53.38 |
|
Compensatory leave |
0.21 |
2.2% |
0.9 |
$33.44 |
$38.62 |
|
Personal and Volunteer Leave |
0 |
0.0% |
0.0 |
$0.00 |
$0.00 |
|
Other Leave |
0.28 |
2.9% |
1.2 |
$43.14 |
$49.83 |
|
Total |
9.54 |
100.0% |
40.2 |
$1,487.64 |
$1,718.04 |
Source: Leave Reporting System FY 95–96 for all Active Employees.
|
Leave |
|||||
|
Paid Leave FY 94–95 |
|||||
|
Paid Leave |
Days (millions) |
Percentage |
Average Days per Capita |
Estimated Value (millions $) Current |
Estimated Value (millions $) Constant |
|
Vacation Leave |
4.14 |
42.2% |
17.0 |
$642.64 |
$754.26 |
|
Statutory Holidays |
2.68 |
27.3% |
11.0 |
$415.42 |
$487.57 |
|
Sick Leave |
2.16 |
22.0% |
8.9 |
$335.22 |
$393.44 |
|
Family Related Leave |
0.30 |
3.1% |
1.2 |
$46.70 |
$54.81 |
|
Compensatory leave |
0.25 |
2.5% |
1.0 |
$38.64 |
$45.35 |
|
Personal and Volunteer Leave |
0 |
0.0% |
0.0 |
$0.00 |
$0.00 |
|
Other Leave |
0.29 |
2.9% |
1.2 |
$44.53 |
$52.27 |
|
Total |
9.81 |
100.0% |
40.3 |
$1,523.16 |
$1,787.71 |
Source: Leave Reporting System FY 94–95 for all Active Employees.
|
Leave |
|||||
|
Paid Leave FY 93–94 |
|||||
|
Paid Leave |
Days (millions) |
Percentage |
Average Days per Capita |
Estimated Value (millions $) Current |
Estimated Value (millions $) Constant |
|
Vacation Leave |
4.23 |
42.1% |
17.1 |
$652.40 |
$782.26 |
|
Statutory Holidays |
2.71 |
27.0% |
11.0 |
$418.71 |
$502.05 |
|
Sick Leave |
2.12 |
21.1% |
8.6 |
$327.00 |
$392.09 |
|
Family Related Leave |
0.29 |
2.9% |
1.2 |
$45.04 |
$54.01 |
|
Compensatory leave |
0.28 |
2.8% |
1.1 |
$43.32 |
$51.94 |
|
Personal and Volunteer Leave |
0 |
0.0% |
0.0 |
$0.00 |
$0.00 |
|
Other Leave |
0.40 |
4.0% |
1.6 |
$62.26 |
$74.65 |
|
Total |
10.03 |
100.0% |
40.7 |
$1,548.74 |
$1,857.00 |
Source: Leave Reporting System FY 93–94 for all Active Employees.
|
Leave |
|||||
|
Paid Leave FY 92–93 |
|||||
|
Paid Leave |
Days (millions) |
Percentage |
Average Days per Capita |
Estimated Value (millions $) Current |
Estimated Value (millions $) Constant |
|
Vacation Leave |
4.06 |
41.9% |
16.7 |
$615.71 |
$739.67 |
|
Statutory Holidays |
2.68 |
27.6% |
11.0 |
$405.83 |
$487.53 |
|
Sick Leave |
2.09 |
21.6% |
8.6 |
$317.29 |
$381.17 |
|
Family Related Leave |
0.28 |
2.9% |
1.2 |
$43.01 |
$51.67 |
|
Compensatory leave |
0.28 |
2.9% |
1.2 |
$42.99 |
$51.65 |
|
Personal and Volunteer Leave |
0.00 |
0.0% |
0.0 |
$0.00 |
$0.00 |
|
Other Leave |
0.31 |
3.1% |
1.3 |
$46.28 |
$55.60 |
|
Total |
9.70 |
100.0% |
39.9 |
$1,471.11 |
$1,767.29 |
Source: Leave Reporting System FY 92–93 for all Active Employees.
|
Leave |
|||||
|
Paid Leave FY 91–92 |
|||||
|
Paid Leave |
Days (millions) |
Percentage |
Average Days per Capita |
Estimated Value (millions $) Current |
Estimated Value (millions $) Constant |
|
Vacation Leave |
4.01 |
41.8% |
16.8 |
$581.82 |
$711.57 |
|
Statutory Holidays |
2.63 |
27.5% |
11.0 |
$381.85 |
$467.00 |
|
Sick Leave |
2.09 |
21.8% |
8.7 |
$303.62 |
$371.33 |
|
Family Related Leave |
0.26 |
2.7% |
1.1 |
$37.52 |
$45.88 |
|
Compensatory leave |
0.28 |
2.9% |
1.2 |
$40.82 |
$49.93 |
|
Personal and Volunteer Leave |
0.00 |
0.0% |
0.0 |
$0.00 |
$0.00 |
|
Other Leave |
0.31 |
3.2% |
1.3 |
$44.64 |
$54.59 |
|
Total |
9.58 |
100.0% |
40.0 |
$1,390.26 |
$1,700.30 |
Source: Leave Reporting System FY 91–92 for all Active Employees.
|
VACATION Entitlement (years of service) |
|||||||||
|
|
|
DAYS |
|||||||
|
GROUP |
Signing/ |
15 |
20 |
22 |
23 |
25 |
27 |
28 |
30 |
|
|
|
Number of years of service |
|||||||
|
PA (includes CR) |
19 nov 01 |
0 |
8 |
16 |
17 |
18 |
27 |
|
28 |
|
PA (includes CR) |
16 may 00 |
0 |
8 |
|
17 |
18 |
|
28 |
29 |
|
PA (includes CR) |
01 apr 99 |
0 |
8 |
|
|
18 |
|
|
29 |
|
CR |
01 apr 90 |
0 |
8 |
|
|
19 |
|
|
30 |
|
CR |
01 apr 89 |
0 |
8 |
|
|
20 |
|
|
30 |
|
CR |
25 apr 86 |
0 |
9 |
|
|
20 |
|
|
|
|
CR |
01 apr 82 |
0 |
10 |
|
|
20 |
|
|
|
|
CR |
01 apr 80 |
0 |
10 |
|
|
22 |
|
|
|
|
CR |
13 nov 78 |
0 |
10 |
|
|
25 |
|
|
|
|
CR |
01 apvr 78 |
0 |
12 |
|
|
26 |
|
|
|
|
CR |
01 jan 77 |
0 |
13 |
|
|
27 |
|
|
|
|
CR |
01 apr 75 |
0 |
15 |
|
|
28 |
|
|
|
|
CR |
01 apr 74 |
0 |
15 |
|
|
29 |
|
|
|
|
CR |
04 oct 71 |
0 |
15 |
|
|
30 |
|
|
|
|
CR |
01 oct 69 |
0 |
18 |
|
|
|
|
|
|
|
CR |
30 apr 69 |
0 |
20 |
|
|
|
|
|
|
Appendix O
Details of sick leave and family‑related leave usage for the ten classification groups with the highest usage, and the three groups with the lowest usage, 1990–91 to 2002–03
|
FY: 1990–91 |
|||||
|
|
SICK LEAVE |
||||
|
Rank |
BUD |
GROUP |
# EMPLOYEES |
TOTAL DAYS |
Average per employee |
|
|
Core public service |
237,592 |
2,056,180 |
8.654 |
|
|
10 groups that have the highest usage (minimum population of 500) |
|||||
|
1 |
611 |
Ship Repair (East) |
1,304 |
17,634 |
13.523 |
|
2 |
601‑51 |
Correctional Services |
4,833 |
63,941 |
13.230 |
|
3 |
605‑55 |
Heating, Power and Stationary Plant Operation |
1,677 |
20,265 |
12.084 |
|
4 |
604‑54 |
General Services |
9,434 |
106,872 |
11.328 |
|
5 |
606‑56 |
Hospital Services |
1,337 |
15,015 |
11.230 |
|
6 |
614 |
Ship Repair (West) |
930 |
9,629 |
10.354 |
|
7 |
308 |
Program Administration |
32,904 |
295,380 |
8.977 |
|
8 |
309 |
Purchasing and Supply |
2,595 |
23,219 |
8.948 |
|
9 |
412 |
Social Science Support |
2,546 |
22,454 |
8.819 |
|
10 |
310 |
Welfare Programs |
1,732 |
12,677 |
7.319 |
|
3 groups that have the lowest usage (minimum population of 500) |
|||||
|
1 |
229 |
Defence Scientific Services |
583 |
2,231 |
3.827 |
|
2 |
225 |
Scientific Regulation |
2,215 |
8,355 |
3.772 |
|
3 |
312 |
Foreign Services |
1,213 |
3,992 |
3.291 |
|
FY: 1991–92 |
|||||
|
|
SICK LEAVE |
||||
|
Rank |
BUD |
GROUP |
# EMPLOYEES |
TOTAL DAYS |
Average per employee |
|
|
Core public service |
239,156 |
2,091,774 |
8.746 |
|
|
10 groups that have the highest usage (minimum population of 500) |
|||||
|
1 |
611 |
Ship Repair (East) |
1,340 |
18,353 |
13.696 |
|
2 |
601‑51 |
Correctional Services |
4,626 |
60,619 |
13.104 |
|
3 |
606‑56 |
Hospital Services |
1,296 |
16,544 |
12.765 |
|
4 |
605‑55 |
Heating, Power and Stationary Plant Operation |
1,576 |
19,280 |
12.234 |
|
5 |
614 |
Ship Repair (West) |
951 |
11,449 |
12.039 |
|
6 |
604‑54 |
General Services |
9,066 |
102,882 |
11.348 |
|
7 |
308 |
Program Administration |
34,165 |
313,145 |
9.166 |
|
8 |
412 |
Social Science Support |
2,638 |
22,864 |
8.667 |
|
9 |
309 |
Purchasing and Supply |
2,623 |
21,540 |
8.212 |
|
10 |
310 |
Welfare Programs |
1,768 |
14,469 |
8.184 |
|
3 groups that have the lowest usage (minimum population of 500) |
|||||
|
1 |
229 |
Defence Scientific Services |
589 |
2,277 |
3.866 |
|
2 |
225 |
Scientific Regulation |
2,193 |
7,215 |
3.290 |
|
3 |
312 |
Foreign Services |
1,210 |
3,250 |
2.686 |
|
FY: 1992–93 |
|||||
|
|
SICK LEAVE |
||||
|
Rank |
BUD |
GROUP |
# EMPLOYEES |
TOTAL DAYS |
Average per employee |
|
|
Core public service |
243,295 |
2,092,408 |
8.600 |
|
|
10 groups that have the highest usage (minimum population of 500) |
|||||
|
1 |
601‑51 |
Correctional Services |
4,683 |
62,309 |
13.305 |
|
2 |
611 |
Ship Repair (East) |
1,295 |
17,040 |
13.158 |
|
3 |
605‑55 |
Heating, Power and Stationary Plant Operation |
1,468 |
18,005 |
12.265 |
|
4 |
614 |
Ship Repair (West) |
917 |
11,094 |
12.098 |
|
5 |
604‑54 |
General Services |
8,823 |
96,594 |
10.948 |
|
6 |
606‑56 |
Hospital Services |
1,267 |
12,253 |
9.671 |
|
7 |
308 |
Program Administration |
35,833 |
322,676 |
9.005 |
|
8 |
412 |
Social Science Support |
2,728 |
23,724 |
8.696 |
|
9 |
309 |
Purchasing and Supply |
2,680 |
22,186 |
8.278 |
|
10 |
310 |
Welfare Programs |
1,839 |
14,060 |
7.645 |
|
3 groups that have the lowest usage (minimum population of 500) |
|||||
|
1 |
225 |
Scientific Regulation |
2,256 |
7,874 |
3.490 |
|
2 |
312 |
Foreign Services |
1,204 |
2,959 |
2.458 |
|
3 |
229 |
Defence Scientific Services |
576 |
918 |
1.594 |
|
FY: 1993–94 |
|||||
|
|
SICK LEAVE |
||||
|
Rank |
BUD |
GROUP |
# EMPLOYEES |
TOTAL DAYS |
Average per employee |
|
|
Core public service |
246,549 |
2,118,007 |
8.591 |
|
|
10 groups that have the highest usage (minimum population of 500) |
|||||
|
1 |
601‑51 |
Correctional Services |
4,606 |
66,088 |
14.348 |
|
2 |
611 |
Ship Repair (East) |
1,285 |
16,736 |
13.024 |
|
3 |
605‑55 |
Heating, Power and Stationary Plant Operation |
1,323 |
15,448 |
11.676 |
|
4 |
614 |
Ship Repair (West) |
950 |
11,029 |
11.609 |
|
5 |
606‑56 |
Hospital Services |
1,114 |
12,923 |
11.601 |
|
6 |
604‑54 |
General Services |
8,718 |
94,838 |
10.878 |
|
7 |
308 |
Program Administration |
36,958 |
337,909 |
9.143 |
|
8 |
412 |
Social Science Support |
2,765 |
24,547 |
8.878 |
|
9 |
309 |
Purchasing and Supply |
2,634 |
22,195 |
8.426 |
|
10 |
310 |
Welfare Programs |
1,838 |
14,015 |
7.625 |
|
3 groups that have the lowest usage (minimum population of 500) |
|||||
|
1 |
229 |
Defence Scientific Services |
2,287 |
7,552 |
3.302 |
|
2 |
312 |
Foreign Services |
1,190 |
3,049 |
2.562 |
|
3 |
225 |
Scientific Regulation |
519 |
934 |
1.800 |
|
FY: 1994–95 |
|||||
|
|
SICK LEAVE |
||||
|
Rank |
BUD |
GROUP |
# EMPLOYEES |
TOTAL DAYS |
Average per employee |
|
|
Core public service |
243,208 |
2,158,812 |
8.876 |
|
|
10 groups that have the highest usage (minimum population of 500) |
|||||
|
1 |
601‑51 |
Correctional Services |
4,841 |
69,552 |
14.367 |
|
2 |
614 |
Ship Repair (West) |
988 |
12,576 |
12.729 |
|
3 |
606‑56 |
Hospital Services |
1,087 |
13,558 |
12.473 |
|
4 |
605‑55 |
Heating, Power and Stationary Plant Operation |
1,290 |
16,066 |
12.454 |
|
5 |
611 |
Ship Repair (East) |
1,262 |
15,637 |
12.391 |
|
6 |
604‑54 |
General Services |
8,812 |
92,859 |
10.538 |
|
7 |
309 |
Purchasing and Supply |
2,600 |
24,832 |
9.551 |
|
8 |
308 |
Program Administration |
37,640 |
357,720 |
9.504 |
|
9 |
310 |
Welfare Programs |
1,777 |
15,659 |
8.812 |
|
10 |
412 |
Social Science Support |
2,825 |
24,124 |
8.539 |
|
3 groups that have the lowest usage (minimum population of 500) |
|||||
|
1 |
225 |
Scientific Regulation |
2,282 |
7,654 |
3.354 |
|
2 |
312 |
Foreign Services |
1,182 |
3,058 |
2.587 |
|
3 |
229 |
Defence Scientific Services |
560 |
1,266 |
2.261 |
|
FY: 1995–96 |
|||||
|
|
SICK LEAVE |
||||
|
Rank |
BUD |
GROUP |
# EMPLOYEES |
TOTAL DAYS |
Average per employee |
|
|
Core public service |
237,513 |
2,060,400 |
8.675 |
|
|
10 groups that have the highest usage (minimum population of 500) |
|||||
|
1 |
601‑51 |
Correctional Services |
4,975 |
70,185 |
14.108 |
|
2 |
611 |
Ship Repair (East) |
1,064 |
13,590 |
12.773 |
|
3 |
614 |
Ship Repair (West) |
897 |
11,203 |
12.489 |
|
4 |
605‑55 |
Heating, Power and Stationary Plant Operation |
1,165 |
14,378 |
12.342 |
|
5 |
606‑56 |
Hospital Services |
1,008 |
11,821 |
11.727 |
|
6 |
604‑54 |
General Services |
8,175 |
81,803 |
10.006 |
|
7 |
308 |
Program Administration |
37,750 |
363,958 |
9.641 |
|
8 |
309 |
Purchasing and Supply |
2,514 |
23,017 |
9.156 |
|
9 |
310 |
Welfare Programs |
1,976 |
16,710 |
8.456 |
|
10 |
412 |
Social Science Support |
2,839 |
23,482 |
8.271 |
|
3 groups that have the lowest usage (minimum population of 500) |
|||||
|
1 |
225 |
Scientific Regulation |
2,219 |
7,135 |
3.215 |
|
2 |
312 |
Foreign Services |
1,184 |
3,585 |
3.028 |
|
3 |
229 |
Defence Scientific Services |
489 |
1,085 |
2.219 |
|
FY: 1996–97 |
|||||
|
|
SICK LEAVE |
||||
|
Rank |
BUD |
GROUP |
# EMPLOYEES |
TOTAL DAYS |
Average per employee |
|
|
Core public service |
213,242 |
1,851,432 |
8.682 |
|
|
10 groups that have the highest usage (minimum population of 500) |
|||||
|
1 |
601‑51 |
Correctional Services |
5,176 |
69,539 |
13.435 |
|
2 |
614 |
Ship Repair (West) |
666 |
8,586 |
12.892 |
|
3 |
605‑55 |
Heating, Power and Stationary Plant Operation |
962 |
11,685 |
12.147 |
|
4 |
611 |
Ship Repair (East) |
984 |
11,928 |
12.122 |
|
5 |
606‑56 |
Hospital Services |
861 |
10,424 |
12.107 |
|
6 |
308 |
Program Administration |
36,538 |
355,745 |
9.736 |
|
7 |
604‑54 |
General Services |
6,823 |
62,361 |
9.140 |
|
8 |
309 |
Purchasing and Supply |
2,166 |
19,556 |
9.029 |
|
9 |
310 |
Welfare Programs |
2,045 |
17,225 |
8.423 |
|
10 |
412 |
Social Science Support |
2,833 |
23,396 |
8.258 |
|
3 groups that have the lowest usage (minimum population of 500) |
|||||
|
1 |
225 |
Scientific Regulation |
2,067 |
7,069 |
3.420 |
|
2 |
312 |
Foreign Services |
1,182 |
3,809 |
3.223 |
|
3 |
229 |
Defence Scientific Services |
458 |
816 |
1.782 |
|
FY: 1997–98 |
|||||
|
|
SICK LEAVE |
||||
|
Rank |
BUD |
GROUP |
# EMPLOYEES |
TOTAL DAYS |
Average per employee |
|
|
Core public service |
206,338 |
1,692,575 |
8.203 |
|
|
10 groups that have the highest usage (minimum population of 500) |
|||||
|
1 |
611 |
Ship Repair (East) |
826 |
11,155 |
13.505 |
|
2 |
601‑51 |
Correctional Services |
5,467 |
69,598 |
12.731 |
|
3 |
614 |
Ship Repair (West) |
638 |
7,952 |
12.464 |
|
4 |
606‑56 |
Hospital Services |
776 |
9,311 |
11.999 |
|
5 |
605‑55 |
Heating, Power and Stationary Plant Operation |
750 |
8,363 |
11.151 |
|
6 |
309 |
Purchasing and Supply |
2,089 |
19,642 |
9.403 |
|
7 |
604‑54 |
General Services |
5,422 |
50,794 |
9.368 |
|
8 |
308 |
Program Administration |
37,766 |
349,642 |
9.258 |
|
9 |
310 |
Welfare Programs |
2,215 |
19,090 |
8.619 |
|
10 |
412 |
Social Science Support |
3,016 |
25,317 |
8.394 |
|
3 groups that have the lowest usage (minimum population of 500) |
|||||
|
1 |
225 |
Scientific Regulation |
1,925 |
5,618 |
2.918 |
|
2 |
312 |
Foreign Services |
1,164 |
2,874 |
2.469 |
|
3 |
229 |
Defence Scientific Services |
433 |
941 |
2.173 |
|
FY: 1998–99 |
|||||
|
|
SICK LEAVE |
||||
|
Rank |
BUD |
GROUP |
# EMPLOYEES |
TOTAL DAYS |
Average per employee |
|
|
Core public service |
206,225 |
1,628,745 |
7.898 |
|
|
10 groups that have the highest usage (minimum population of 500) |
|||||
|
1 |
601‑51 |
Correctional Services |
5,587 |
71,816 |
12.854 |
|
2 |
611 |
Ship Repair (East) |
733 |
9,141 |
12.471 |
|
3 |
606‑56 |
Hospital Services |
801 |
8,448 |
10.547 |
|
4 |
614 |
Ship Repair (West) |
632 |
6,540 |
10.348 |
|
5 |
308 |
Program Administration |
36,266 |
340,633 |
9.393 |
|
6 |
309 |
Purchasing and Supply |
2,060 |
19,337 |
9.387 |
|
7 |
605‑55 |
Heating, Power and Stationary Plant Operation |
725 |
6,420 |
8.855 |
|
8 |
310 |
Welfare Programs |
2,389 |
20,321 |
8.506 |
|
9 |
412 |
Social Science Support |
3,251 |
27,583 |
8.484 |
|
10 |
604‑54 |
General Services |
5,557 |
44,275 |
7.967 |
|
3 groups that have the lowest usage (minimum population of 500) |
|||||
|
1 |
312 |
Foreign Services |
1,114 |
3,131 |
2.811 |
|
2 |
225 |
Scientific Regulation |
1,851 |
4,924 |
2.660 |
|
3 |
229 |
Defence Scientific Services |
466 |
1,160 |
2.489 |
|
FY: 1999–00 |
|||||
|
|
SICK LEAVE |
||||
|
Rank |
BUD |
GROUP |
# EMPLOYEES |
TOTAL DAYS |
Average per employee |
|
|
Core public service |
204,186 |
1,473,940 |
7.219 |
|
|
10 groups that have the highest usage (minimum population of 500) |
|||||
|
1 |
601‑51 |
Correctional Services |
6,042 |
81,985 |
13.569 |
|
2 |
611 |
Ship Repair (East) |
630 |
8,335 |
13.230 |
|
3 |
614 |
Ship Repair (West) |
636 |
7,936 |
12.478 |
|
4 |
606‑56 |
Hospital Services |
781 |
8,120 |
10.397 |
|
5 |
605‑55 |
Heating, Power and Stationary Plant Operation |
598 |
6,058 |
10.130 |
|
6 |
309 |
Purchasing and Supply |
2,156 |
19,543 |
9.064 |
|
7 |
604‑54 |
General Services |
4,472 |
38,449 |
8.598 |
|
8 |
412 |
Social Science Support |
3,263 |
27,906 |
8.552 |
|
9 |
310 |
Welfare Programs |
2,477 |
21,144 |
8.536 |
|
10 |
308 |
Program Administration |
36,070 |
248,878 |
6.900 |
|
3 groups that have the lowest usage (minimum population of 500) |
|||||
|
1 |
312 |
Foreign Services |
1,105 |
3,470 |
3.140 |
|
2 |
225 |
Scientific Regulation |
1,887 |
5,771 |
3.058 |
|
3 |
229 |
Defence Scientific Services |
478 |
880 |
1.841 |
|
FY: 2000–01 |
|||||
|
|
SICK LEAVE |
||||
|
Rank |
BUD |
GROUP |
# EMPLOYEES |
TOTAL DAYS |
Average per employee |
|
|
Core public service |
170,234 |
1,327,500 |
7.798 |
|
|
10 groups that have the highest usage (minimum population of 500) |
|||||
|
1 |
601‑51 |
Correctional Services |
6,396 |
89,470 |
13.988 |
|
2 |
611 |
Ship Repair (East) |
640 |
7,734 |
12.084 |
|
3 |
614 |
Ship Repair (West) |
636 |
7,517 |
11.819 |
|
4 |
605‑55 |
Heating, Power and Stationary Plant Operation |
563 |
5,868 |
10.423 |
|
5 |
606‑56 |
Hospital Services |
811 |
7,965 |
9.821 |
|
6 |
310 |
Welfare Programs |
2,574 |
23,535 |
9.143 |
|
7 |
309 |
Purchasing and Supply |
2,164 |
19,762 |
9.132 |
|
8 |
412 |
Social Science Support |
3,531 |
30,690 |
8.692 |
|
9 |
604‑54 |
General Services |
4,257 |
36,057 |
8.470 |
|
10 |
308 |
Program Administration |
17,082 |
143,816 |
8.419 |
|
3 groups that have the lowest usage (minimum population of 500) |
|||||
|
1 |
312 |
Foreign Services |
1,210 |
4,099 |
3.388 |
|
2 |
225 |
Scientific Regulation |
1,959 |
5,593 |
2.855 |
|
3 |
229 |
Defence Scientific Services |
515 |
831 |
1.614 |
|
FY: 2001–02 |
|||||
|
|
SICK LEAVE |
||||
|
Rank |
BUD |
GROUP |
# EMPLOYEES |
TOTAL DAYS |
Average per employee |
|
|
Core public service |
181,320 |
1,408,719 |
7.769 |
|
|
10 groups that have the highest usage (minimum population of 500) |
|||||
|
1 |
601‑51 |
Correctional Services |
6,502 |
95,735 |
14.724 |
|
2 |
611 |
Ship Repair (East) |
650 |
7,538 |
11.597 |
|
3 |
614 |
Ship Repair (West) |
639 |
6,650 |
10.407 |
|
4 |
605‑55 |
Heating, Power and Stationary Plant Operation |
561 |
5,528 |
9.854 |
|
5 |
310 |
Welfare Programs |
2,694 |
25,463 |
9.452 |
|
6 |
309 |
Purchasing and Supply |
2,414 |
22,352 |
9.259 |
|
7 |
606‑56 |
Hospital Services |
843 |
7,634 |
9.056 |
|
8 |
308 |
Program Administration |
18,568 |
161,855 |
8.717 |
|
9 |
412 |
Social Science Support |
3,766 |
31,850 |
8.457 |
|
10 |
604‑54 |
General Services |
4,337 |
34,168 |
7.878 |
|
3 groups that have the lowest usage (minimum population of 500) |
|||||
|
1 |
225 |
Scientific Regulation |
1,982 |
6,006 |
3.030 |
|
2 |
312 |
Foreign Services |
1,182 |
3,382 |
2.861 |
|
3 |
229 |
Defence Scientific Services |
546 |
918 |
1.681 |
|
FY: 2002–03 |
|||||
|
|
SICK LEAVE |
||||
|
Rank |
BUD |
GROUP |
# EMPLOYEES |
TOTAL DAYS |
Average per employee |
|
|
Core public service |
187,781 |
1,559,671 |
8.306 |
|
|
10 groups that have the highest usage (minimum population of 500) |
|||||
|
1 |
601‑651 |
Correctional Services |
6,854 |
97,507 |
14.226 |
|
2 |
611 |
Ship Repair (East) |
657 |
9,161 |
13.944 |
|
3 |
605‑55 |
Heating, Power and Stationary Plant Operation |
535 |
6,252 |
11.686 |
|
4 |
614 |
Ship Repair (West) |
664 |
7,645 |
11.514 |
|
5 |
310 |
Welfare Programs |
2,703 |
28,682 |
10.611 |
|
6 |
309 |
Purchasing and Supply |
2,511 |
25,272 |
10.065 |
|
7 |
606‑656 |
Hospital Services |
802 |
7,909 |
9.862 |
|
8 |
604‑54 |
General Services |
4,290 |
42,141 |
9.823 |
|
9 |
308 |
Program Administration |
19,057 |
180,921 |
9.494 |
|
10 |
412 |
Social Science Support |
3,909 |
36,439 |
9.322 |
|
3 groups that have the lowest usage (minimum population of 500) |
|||||
|
1 |
225 |
Scientific Regulation |
1,970 |
6,508 |
3.304 |
|
2 |
229 |
Defense Scientific Services |
602 |
1,995 |
3.314 |
|
3 |
312 |
Foreign Services |
1,235 |
4,815 |
3.899 |
|
FY: 1991–92 |
|||||
|
|
FAMILY RELATED RESPONSIBILITY LEAVE |
||||
|
Rank |
BUD |
GROUP |
# EMPLOYEES |
TOTAL DAYS |
Average per employee |
|
|
Core public service |
239,156 |
258,464 |
1.0807 |
|
|
10 groups that have the highest usage (minimum population of 500) |
|||||
|
1 |
601‑51 |
Correctional Services |
4,626 |
19,611 |
4.2393 |
|
2 |
611 |
Ship Repair (East) |
1340 |
5224 |
3.8985 |
|
3 |
614 |
Ship Repair (West) |
951 |
2389 |
2.5121 |
|
4 |
606‑56 |
Hospital Services |
1296 |
2476 |
1.9105 |
|
5 |
310 |
Welfare Programs |
1768 |
3075 |
1.7393 |
|
6 |
603‑53 |
General Labour and Trades |
14,381 |
17,651 |
1.2274 |
|
7 |
605‑55 |
Heating, Power and Stationary Plant Operation |
1,576 |
1,919 |
1.2176 |
|
8 |
503 |
Clerical and Regulatory |
53,506 |
64,791 |
1.2109 |
|
9 |
604‑54 |
General Services |
9,066 |
10,977 |
1.2108 |
|
10 |
219 |
Nursing |
1,831 |
2,079 |
1.1354 |
|
3 groups that have the lowest usage (minimum population of 500) |
|||||
|
1 |
225 |
Scientific Regulation |
2193 |
699 |
0.3187 |
|
2 |
102 |
Executive Group |
4621 |
1246 |
0.2696 |
|
3 |
312 |
Foreign Service |
1210 |
215 |
0.1777 |
|
FY: 1992–93 |
|||||
|
|
FAMILY RELATED RESPONSIBILITY LEAVE |
||||
|
Rank |
BUD |
GROUP |
# EMPLOYEES |
TOTAL DAYS |
Average per employee |
|
|
Core public service |
243,295 |
283,621 |
1.1657 |
|
|
10 groups that have the highest usage (minimum population of 500) |
|||||
|
1 |
601‑51 |
Correctional Services |
4,683 |
20,824 |
4.4467 |
|
2 |
611 |
Ship Repair (East) |
1295 |
5178 |
3.9985 |
|
3 |
614 |
Ship Repair (West) |
917 |
2555 |
2.7863 |
|
4 |
310 |
Welfare Programs |
1839 |
3444 |
1.8728 |
|
5 |
606‑56 |
Hospital Services |
1267 |
1900 |
1.4996 |
|
6 |
605‑55 |
Heating, Power and Stationary Plant Operation |
1,468 |
2,085 |
1.4203 |
|
7 |
603‑53 |
General Labour and Trades |
14,270 |
19,702 |
1.3807 |
|
8 |
604‑54 |
General Services |
8,823 |
12,022 |
1.3626 |
|
9 |
503 |
Clerical and Regulatory |
54,496 |
70,880 |
1.3006 |
|
10 |
219 |
Nursing |
1,906 |
2,179 |
1.1432 |
|
3 groups that have the lowest usage (minimum population of 500) |
|||||
|
1 |
225 |
Scientific Regulation |
2256 |
794 |
0.3520 |
|
2 |
102 |
Executive Group |
4466 |
1375 |
0.3079 |
|
3 |
312 |
Foreign Service |
1204 |
301 |
0.2500 |
|
FY: 1993–94 |
|||||
|
|
FAMILY RELATED RESPONSIBILITY LEAVE |
||||
|
Rank |
BUD |
GROUP |
# EMPLOYEES |
TOTAL DAYS |
Average per employee |
|
|
Core public service |
246,549 |
291,748 |
1.1833 |
|
|
10 groups that have the highest usage (minimum population of 500) |
|||||
|
1 |
601‑51 |
Correctional Services |
4,606 |
20,585 |
4.4692 |
|
2 |
611 |
Ship Repair (East) |
1285 |
5109 |
3.9759 |
|
3 |
614 |
Ship Repair (West) |
950 |
2834 |
2.9832 |
|
4 |
606‑56 |
Hospital Services |
1114 |
2317 |
2.0799 |
|
5 |
310 |
Welfare Programs |
1838 |
3684 |
2.0044 |
|
6 |
605‑55 |
Heating, Power and Stationary Plant Operation |
1,323 |
1,983 |
1.4989 |
|
7 |
603‑53 |
General Labour and Trades |
14,125 |
19,479 |
1.3790 |
|
8 |
604‑54 |
General Services |
8,718 |
11,846 |
1.3588 |
|
9 |
503 |
Clerical and Regulatory |
57,082 |
74,675 |
1.3082 |
|
10 |
219 |
Nursing |
1,991 |
2,409 |
1.2099 |
|
3 groups that have the lowest usage (minimum population of 500) |
|||||
|
1 |
225 |
Scientific Regulation |
2287 |
866 |
0.3787 |
|
2 |
102 |
Executive Group |
4165 |
1195 |
0.2869 |
|
3 |
312 |
Foreign Service |
1190 |
230 |
0.1933 |
|
FY: 1994–95 |
|||||
|
|
FAMILY RELATED RESPONSIBILITY LEAVE |
||||
|
Rank |
BUD |
GROUP |
# EMPLOYEES |
TOTAL DAYS |
Average per employee |
|
|
Core public service |
243,208 |
300,765 |
1.2367 |
|
|
10 groups that have the highest usage (minimum population of 500) |
|||||
|
1 |
601‑51 |
Correctional Services |
4,841 |
21,115 |
4.3617 |
|
2 |
611 |
Ship Repair (East) |
1262 |
5084 |
4.0285 |
|
3 |
614 |
Ship Repair (West) |
988 |
2903 |
2.9383 |
|
4 |
606‑56 |
Hospital Services |
1087 |
2456 |
2.2594 |
|
5 |
310 |
Welfare Programs |
1777 |
3498 |
1.9685 |
|
6 |
605‑55 |
Heating, Power and Stationary Plant Operation |
1,290 |
2,175 |
1.6860 |
|
7 |
603‑53 |
General Labour and Trades |
14,196 |
20,276 |
1.4283 |
|
8 |
604‑54 |
General Services |
8,812 |
12,109 |
1.3741 |
|
9 |
219 |
Nursing |
1,920 |
2,624 |
1.3667 |
|
10 |
503 |
Clerical and Regulatory |
54,004 |
73,577 |
1.3624 |
|
3 groups that have the lowest usage (minimum population of 500) |
|||||
|
1 |
225 |
Scientific Regulation |
2282 |
818 |
0.3585 |
|
2 |
312 |
Foreign Service |
1182 |
379 |
0.3206 |
|
3 |
102 |
Executive Group |
4022 |
1266 |
0.3148 |
|
FY: 1995–96 |
|||||
|
|
FAMILY RELATED RESPONSIBILITY LEAVE |
||||
|
Rank |
BUD |
GROUP |
# EMPLOYEES |
TOTAL DAYS |
Average per employee |
|
|
Core public service |
237,513 |
296,414 |
1.2480 |
|
|
10 groups that have the highest usage (minimum population of 500) |
|||||
|
1 |
601‑51 |
Correctional Services |
4,975 |
20,832 |
4.1873 |
|
2 |
611 |
Ship Repair (East) |
1064 |
4145 |
3.8957 |
|
3 |
614 |
Ship Repair (West) |
897 |
2575 |
2.8707 |
|
4 |
606‑56 |
Hospital Services |
1008 |
2283 |
2.2649 |
|
5 |
310 |
Welfare Programs |
1976 |
3886 |
1.9666 |
|
6 |
605‑55 |
Heating, Power and Stationary Plant Operation |
1,165 |
1,990 |
1.7082 |
|
7 |
503 |
Clerical and Regulatory |
52,826 |
73,039 |
1.3826 |
|
8 |
603‑53 |
General Labour and Trades |
13,563 |
18,739 |
1.3816 |
|
9 |
219 |
Nursing |
1,895 |
2,513 |
1.3261 |
|
10 |
604‑54 |
General Services |
8,175 |
10,699 |
1.3087 |
|
3 groups that have the lowest usage (minimum population of 500) |
|||||
|
1 |
225 |
Scientific Regulation |
2219 |
831 |
0.3745 |
|
2 |
102 |
Executive Group |
3938 |
1214 |
0.3083 |
|
3 |
312 |
Foreign Service |
1184 |
352 |
0.2973 |
|
FY: 1996–97 |
|||||
|
|
FAMILY RELATED RESPONSIBILITY LEAVE |
||||
|
Rank |
BUD |
GROUP |
# EMPLOYEES |
TOTAL DAYS |
Average per employee |
|
|
Core public service |
213,242 |
277,577 |
1.3017 |
|
|
10 groups that have the highest usage (minimum population of 500) |
|||||
|
1 |
601‑51 |
Correctional Services |
5,176 |
21,616 |
4.1762 |
|
2 |
611 |
Ship Repair (East) |
984 |
3792 |
3.8537 |
|
3 |
614 |
Ship Repair (West) |
666 |
2022 |
3.0360 |
|
4 |
606‑56 |
Hospital Services |
861 |
2045 |
2.3751 |
|
5 |
310 |
Welfare Programs |
2045 |
4081 |
1.9956 |
|
6 |
605‑55 |
Heating, Power and Stationary Plant Operation |
962 |
1,613 |
1.6767 |
|
7 |
503 |
Clerical and Regulatory |
48,123 |
68,550 |
1.4245 |
|
8 |
603‑53 |
General Labour and Trades |
11,216 |
15,897 |
1.4174 |
|
9 |
604‑54 |
General Services |
6,823 |
9,087 |
1.3318 |
|
10 |
219 |
Nursing |
1,766 |
2,346 |
1.3284 |
|
3 groups that have the lowest usage (minimum population of 500) |
|||||
|
1 |
225 |
Scientific Regulation |
2067 |
793 |
0.3836 |
|
2 |
102 |
Executive Group |
3634 |
1143 |
0.3145 |
|
3 |
312 |
Foreign Service |
1182 |
368 |
0.3113 |
|
FY: 1997–98 |
|||||
|
|
FAMILY RELATED RESPONSIBILITY LEAVE |
||||
|
Rank |
BUD |
GROUP |
# EMPLOYEES |
TOTAL DAYS |
Average per employee |
|
|
Core public service |
206,338 |
268,689 |
1.3022 |
|
|
10 groups that have the highest usage (minimum population of 500) |
|||||
|
1 |
601‑51 |
Correctional Services |
5,467 |
22,065 |
4.0360 |
|
2 |
611 |
Ship Repair (East) |
826 |
3306 |
4.0024 |
|
3 |
614 |
Ship Repair (West) |
638 |
1945 |
3.0486 |
|
4 |
606‑56 |
Hospital Services |
776 |
2001 |
2.5786 |
|
5 |
605‑55 |
Heating, Power and Stationary Plant Operation |
750 |
1440 |
1.9200 |
|
6 |
310 |
Welfare Programs |
2,215 |
4,080 |
1.8420 |
|
7 |
603‑53 |
General Labour and Trades |
10,027 |
14,581 |
1.4542 |
|
8 |
604‑54 |
General Services |
5,422 |
7,872 |
1.4519 |
|
9 |
219 |
Nursing |
1,684 |
2,406 |
1.4287 |
|
10 |
503 |
Clerical and Regulatory |
45,832 |
64,906 |
1.4162 |
|
3 groups that have the lowest usage (minimum population of 500) |
|||||
|
1 |
225 |
Scientific Regulation |
1925 |
717 |
0.3725 |
|
2 |
312 |
Foreign Service |
1164 |
405 |
0.3479 |
|
3 |
102 |
Executive Group |
3572 |
1160 |
0.3247 |
|
FY: 1998–99 |
|||||
|
|
FAMILY RELATED RESPONSIBILITY LEAVE |
||||
|
Rank |
BUD |
GROUP |
# EMPLOYEES |
TOTAL DAYS |
Average per employee |
|
|
Core public service |
206,225 |
270,620 |
1.3123 |
|
|
10 groups that have the highest usage (minimum population of 500) |
|||||
|
1 |
601‑51 |
Correctional Services |
5,587 |
23,074 |
4.1299 |
|
2 |
611 |
Ship Repair (East) |
733 |
2698 |
3.6808 |
|
3 |
614 |
Ship Repair (West) |
632 |
1817 |
2.8750 |
|
4 |
606‑56 |
Hospital Services |
801 |
1865 |
2.3283 |
|
5 |
310 |
Welfare Programs |
2389 |
4659 |
1.9502 |
|
6 |
605‑55 |
Heating, Power and Stationary Plant Operation |
725 |
1,243 |
1.7145 |
|
7 |
219 |
Nursing |
1,685 |
2,593 |
1.5389 |
|
8 |
503 |
Clerical and Regulatory |
43,945 |
62,275 |
1.4171 |
|
9 |
604‑54 |
General Services |
5,557 |
6,967 |
1.2537 |
|
10 |
603‑53 |
General Labour and Trades |
10,020 |
12,487 |
1.2462 |
|
3 groups that have the lowest usage (minimum population of 500) |
|||||
|
1 |
225 |
Scientific Regulation |
1851 |
764 |
0.4127 |
|
2 |
312 |
Foreign Service |
1114 |
411 |
0.3689 |
|
3 |
102 |
Executive Group |
3675 |
1321 |
0.3595 |
|
FY: 1999–00 |
|||||
|
|
FAMILY RELATED RESPONSIBILITY LEAVE |
||||
|
Rank |
BUD |
GROUP |
# EMPLOYEES |
TOTAL DAYS |
Average per employee |
|
|
Core public service |
204,186 |
256,401 |
1.2557 |
|
|
10 groups that have the highest usage (minimum population of 500) |
|||||
|
1 |
601‑51 |
Correctional Services |
6,042 |
26,134 |
4.3254 |
|
2 |
611 |
Ship Repair (East) |
630 |
2605 |
4.1349 |
|
3 |
614 |
Ship Repair (West) |
636 |
1987 |
3.1242 |
|
4 |
606‑56 |
Hospital Services |
781 |
1972 |
2.5250 |
|
5 |
310 |
Welfare Programs |
2477 |
5205 |
2.1013 |
|
6 |
605‑55 |
Heating, Power and Stationary Plant Operation |
598 |
1,231 |
2.0585 |
|
7 |
219 |
Nursing |
1,695 |
2,670 |
1.5752 |
|
8 |
604‑54 |
General Services |
4,472 |
6,804 |
1.5215 |
|
9 |
603‑53 |
General Labour and Trades |
7,846 |
11,610 |
1.4797 |
|
10 |
503 |
Clerical and Regulatory |
43,430 |
59,095 |
1.3607 |
|
3 groups that have the lowest usage (minimum population of 500) |
|||||
|
1 |
312 |
Foreign Service |
1105 |
671 |
0.6072 |
|
2 |
225 |
Scientific Regulation |
1887 |
822 |
0.4356 |
|
3 |
102 |
Executive Group |
3788 |
1489 |
0.3931 |
|
FY: 2000–01 |
|||||
|
|
FAMILY RELATED RESPONSIBILITY LEAVE |
||||
|
Rank |
BUD |
GROUP |
# EMPLOYEES |
TOTAL DAYS |
Average per employee |
|
|
Core public service |
170,234 |
233,393 |
1.3710 |
|
|
10 groups that have the highest usage (minimum population of 500) |
|||||
|
1 |
601‑51 |
Correctional Services |
6,396 |
27,917 |
4.3648 |
|
2 |
611 |
Ship Repair (East) |
640 |
2620 |
4.0938 |
|
3 |
614 |
Ship Repair (West) |
636 |
2101 |
3.3035 |
|
4 |
606‑56 |
Hospital Services |
811 |
2007 |
2.4747 |
|
5 |
605‑55 |
Heating, Power and Stationary Plant Operation |
563 |
1269 |
2.2540 |
|
6 |
310 |
Welfare Programs |
2,574 |
5,580 |
2.1678 |
|
7 |
219 |
Nursing |
1,692 |
2,705 |
1.5987 |
|
8 |
603‑53 |
General Labour and Trades |
7,613 |
11,977 |
1.5732 |
|
9 |
604‑54 |
General Services |
4,257 |
6,625 |
1.5563 |
|
10 |
503 |
Clerical and Regulatory |
36,568 |
53,614 |
1.4661 |
|
3 groups that have the lowest usage (minimum population of 500) |
|||||
|
1 |
225 |
Scientific Regulation |
1959 |
972 |
0.4962 |
|
2 |
312 |
Foreign Service |
1210 |
535 |
0.4421 |
|
3 |
102 |
Executive Group |
3657 |
1615 |
0.4416 |
|
FY: 2001–02 |
|||||
|
|
FAMILY RELATED RESPONSIBILITY LEAVE |
||||
|
Rank |
BUD |
GROUP |
# EMPLOYEES |
TOTAL DAYS |
Average per employee |
|
|
Core public service |
181,320 |
257,410 |
1.4196 |
|
|
10 groups that have the highest usage (minimum population of 500) |
|||||
|
1 |
601‑51 |
Correctional Services |
6,502 |
28,548 |
4.3906 |
|
2 |
611 |
Ship Repair (East) |
650 |
2676 |
4.1169 |
|
3 |
614 |
Ship Repair (West) |
639 |
2091 |
3.2723 |
|
4 |
606‑56 |
Hospital Services |
843 |
2021 |
2.3974 |
|
5 |
605‑55 |
Heating, Power and Stationary Plant Operation |
561 |
1287 |
2.2941 |
|
6 |
310 |
Welfare Programs |
2,694 |
6,042 |
2.2428 |
|
7 |
219 |
Nursing |
1,771 |
3,042 |
1.7177 |
|
8 |
603‑53 |
General Labour and Trades |
7,639 |
12,674 |
1.6591 |
|
9 |
604‑54 |
General Services |
4,337 |
6,788 |
1.5651 |
|
10 |
503 |
Clerical and Regulatory |
37,463 |
57,435 |
1.5331 |
|
3 groups that have the lowest usage (minimum population of 500) |
|||||
|
1 |
225 |
Scientific Regulation |
1982 |
1064 |
0.5368 |
|
2 |
102 |
Executive Group |
4160 |
2081 |
0.5002 |
|
3 |
312 |
Foreign Service |
1182 |
546 |
0.4619 |
|
FY: 2002–03 |
|||||
|
|
FAMILY RELATED RESPONSIBILITY LEAVE |
||||
|
Rank |
BUD |
GROUP |
# EMPLOYEES |
TOTAL DAYS |
Average per employee |
|
|
Core public service |
187,781 |
295,833 |
1.5754 |
|
|
10 groups that have the highest usage (minimum population of 500) |
|||||
|
1 |
601‑51 |
Correctional Services |
6,854 |
30,436 |
4.4406 |
|
2 |
611 |
Ship Repair (East) |
657 |
2791 |
4.2481 |
|
3 |
614 |
Ship Repair (West) |
664 |
2335 |
3.5166 |
|
4 |
606‑56 |
Hospital Services |
802 |
2077 |
2.5898 |
|
5 |
605‑55 |
Heating, Power and Stationary Plant Operation |
535 |
1357 |
2.5364 |
|
6 |
310 |
Welfare Programs |
2,703 |
6,694 |
2.4765 |
|
7 |
604‑54 |
General Services |
4,290 |
8,090 |
1.8858 |
|
8 |
219 |
Nursing |
1,868 |
3,484 |
1.8651 |
|
9 |
603‑53 |
General Labour and Trades |
7,631 |
14,009 |
1.8358 |
|
10 |
503 |
Clerical and Regulatory |
37,107 |
64,702 |
1.7437 |
|
3 groups that have the lowest usage (minimum population of 500) |
|||||
|
1 |
312 |
Foreign Service |
1235 |
570 |
0.4615 |
|
2 |
102 |
Executive |
4496 |
2383 |
0.5300 |
|
3 |
225 |
Scientific Regulation |
1970 |
1189 |
0.6036 |
Appendix P
History of employer and employee contributions to the Public Service Pension Plan, 1924-25 to 200203
Public Service Pension Plan
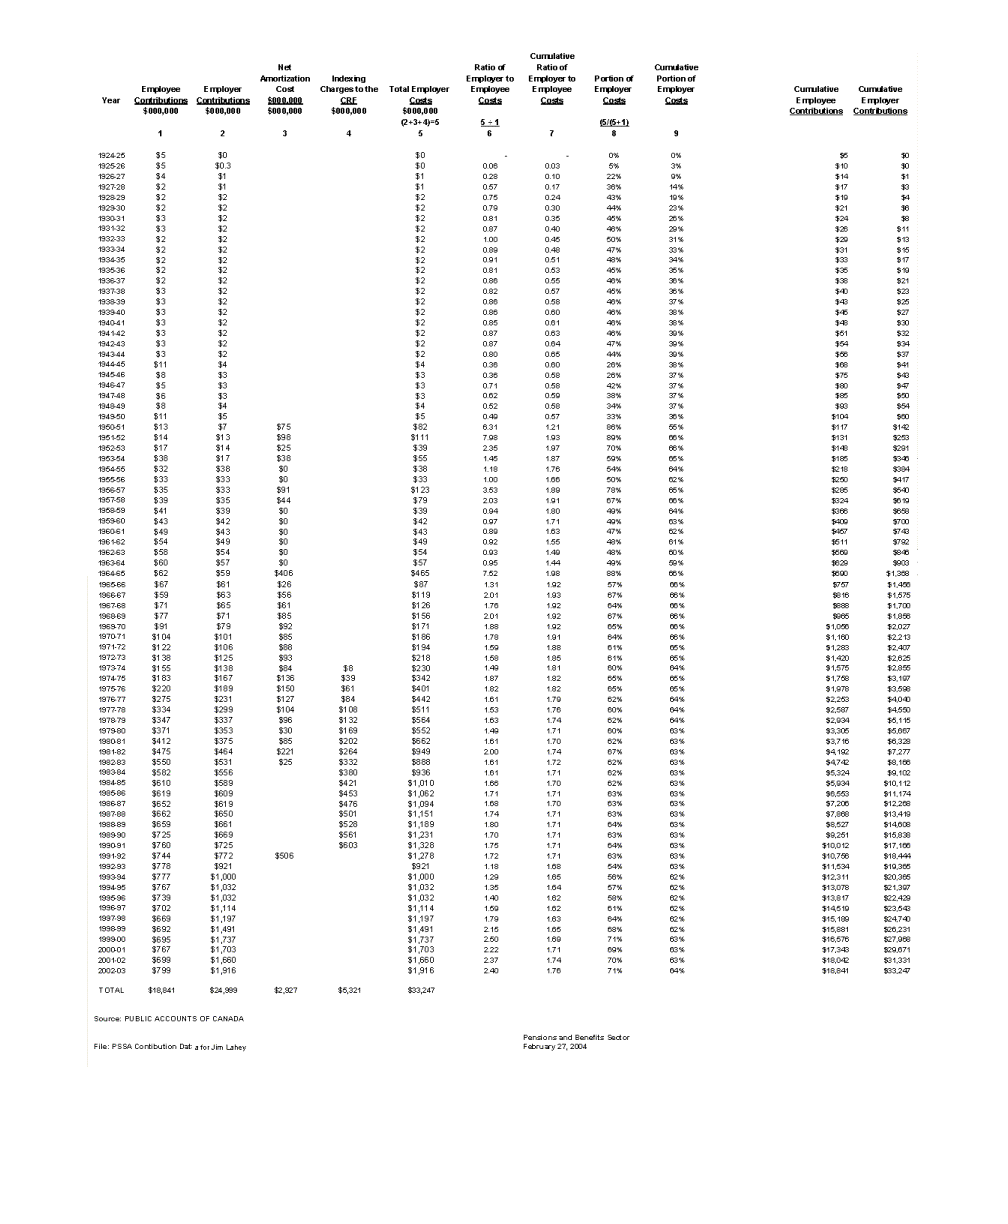
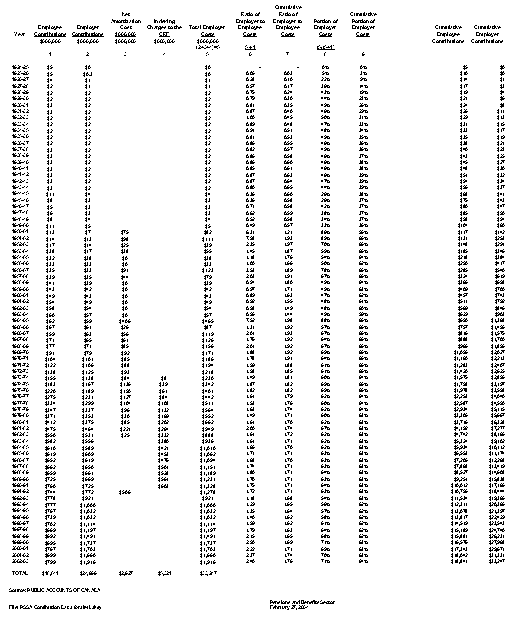
Appendix Q
History of employer and member contributions to the Canadian Forces Pension Plan, 1946-47 to 2002-03
Canadian Forces Pension Plan
|
Year |
Employee |
Employer |
Net |
Indexing |
|
|
$000,000 |
$000,000 |
$000,000 |
$000,000 |
|
|
1 |
2 |
3 |
4 |
|
|
|
|
|
|
|
1946-47 |
$1 |
|
|
|
|
1947-48 |
$6 |
$7 |
|
|
|
1948-49 |
$6 |
$7 |
|
|
|
1949-50 |
$7 |
$9 |
|
|
|
1950-51 |
$8 |
$12 |
|
|
|
1951-52 |
$12 |
$31 |
|
|
|
1952-53 |
$17 |
$30 |
|
|
|
1953-54 |
$19 |
$35 |
|
|
|
1954-55 |
$23 |
$37 |
|
|
|
1955-56 |
$24 |
$40 |
|
|
|
1956-57 |
$26 |
$46 |
|
|
|
1957-58 |
$29 |
$50 |
|
|
|
1958-59 |
$30 |
$50 |
|
|
|
1959-60 |
$30 |
$52 |
|
|
|
1960-61 |
$32 |
$41 |
|
|
|
1961-62 |
$34 |
$56 |
|
|
|
1962-63 |
$34 |
$58 |
|
|
|
1963-64 |
$36 |
$60 |
$601 |
|
|
1964-65 |
$35 |
$59 |
$13 |
|
|
1965-66 |
$34 |
$59 |
$17 |
|
|
1966-67 |
$25 |
$43 |
$73 |
|
|
1967-68 |
$33 |
$58 |
$73 |
|
|
1968-69 |
$34 |
$57 |
$105 |
$0.0 |
|
1969-70 |
$39 |
$66 |
$91 |
$0.0 |
|
1970-71 |
$39 |
$70 |
$89 |
$0.0 |
|
1971-72 |
$42 |
$74 |
$66 |
$0.0 |
|
1972-73 |
$44 |
$79 |
$90 |
$3.1 |
|
1973-74 |
$49 |
$87 |
$150 |
$13.0 |
|
1974-75 |
$52 |
$91 |
$186 |
$22.0 |
|
1975-76 |
$56 |
$99 |
$219 |
$33.0 |
|
1976-77 |
$63 |
$114 |
$198 |
$43.0 |
|
1977-78 |
$67 |
$119 |
$171 |
$65.0 |
|
1978-79 |
$71 |
$124 |
$65 |
$82.0 |
|
1979-80 |
$74 |
$133 |
$0 |
$99.6 |
|
1980-81 |
$80 |
$142 |
$0 |
$131.1 |
|
1981-82 |
$91 |
$159 |
$40 |
$167.3 |
|
1982-83 |
$104 |
$183 |
|
$195.1 |
|
1983-84 |
$113 |
$200 |
|
$219.1 |
|
1984-85 |
$120 |
$212 |
|
$247.2 |
|
1985-86 |
$125 |
$223 |
|
$270.8 |
|
1986-87 |
$131 |
$233 |
|
$304.1 |
|
1987-88 |
$139 |
$247 |
|
$327.8 |
|
1988-89 |
$142 |
$255 |
|
$359.0 |
|
1989-90 |
$152 |
$270 |
|
$395.8 |
|
1990-91 |
$161 |
$288 |
|
|
|
1991-92 |
$188 |
$401 |
|
|
|
1992-93 |
$185 |
$424 |
|
|
|
1993-94 |
$176 |
$435 |
|
|
|
1994-95 |
$168 |
$437 |
|
|
|
1995-96 |
$152 |
$410 |
|
|
|
1996-97 |
$138 |
$390 |
|
|
|
1997-98 |
$139 |
$403 |
|
|
|
1998-99 |
$137 |
$396 |
|
|
|
1999-00 |
$144 |
$562 |
|
|
|
2000-01 |
$149 |
$511 |
|
|
|
2001-02 |
$154 |
$529 |
|
|
|
2002-03 |
$162 |
$556 |
|
|
|
TOTAL |
$4,381 |
$9,819 |
$2,247 |
$2,978 |
Appendix Q (cont'd)
|
Year |
Total |
Ratio of |
Cumulative |
Portion of |
|
|
$000,000 |
|
|
|
|
|
2+3+4 = 5 |
5 � 1 |
|
(5/(5�1) |
|
|
5 |
6 |
7 |
8 |
|
|
|
|
|
|
|
1946-47 |
$0.0 |
0.00 |
0.00 |
0% |
|
1947-48 |
$7.3 |
1.30 |
1.04 |
57% |
|
1948-49 |
$7.4 |
1.21 |
1.12 |
55% |
|
1949-50 |
$9.0 |
1.29 |
1.18 |
56% |
|
1950-51 |
$12.0 |
1.48 |
1.26 |
60% |
|
1951-52 |
$30.7 |
2.48 |
1.63 |
71% |
|
1952-53 |
$30.0 |
1.78 |
1.68 |
64% |
|
1953-54 |
$35.2 |
1.84 |
1.72 |
65% |
|
1954-55 |
$36.7 |
1.62 |
1.70 |
62% |
|
1955-56 |
$40.1 |
1.69 |
1.69 |
63% |
|
1956-57 |
$46.4 |
1.77 |
1.71 |
64% |
|
1957-58 |
$49.7 |
1.74 |
1.71 |
63% |
|
1958-59 |
$49.5 |
1.66 |
1.70 |
62% |
|
1959-60 |
$51.8 |
1.71 |
1.70 |
63% |
|
1960-61 |
$40.6 |
1.27 |
1.65 |
56% |
|
1961-62 |
$56.0 |
1.66 |
1.66 |
62% |
|
1962-63 |
$58.1 |
1.69 |
1.66 |
63% |
|
1963-64 |
$660.7 |
18.32 |
3.26 |
95% |
|
1964-65 |
$72.2 |
2.05 |
3.16 |
67% |
|
1965-66 |
$75.6 |
2.22 |
3.09 |
69% |
|
1966-67 |
$115.2 |
4.59 |
3.17 |
82% |
|
1967-68 |
$131.0 |
3.96 |
3.22 |
80% |
|
1968-69 |
$161.5 |
4.77 |
3.32 |
83% |
|
1969-70 |
$156.8 |
4.05 |
3.37 |
80% |
|
1970-71 |
$159.8 |
4.08 |
3.41 |
80% |
|
1971-72 |
$140.1 |
3.38 |
3.41 |
77% |
|
1972-73 |
$172.4 |
3.91 |
3.44 |
80% |
|
1973-74 |
$250.4 |
5.14 |
3.55 |
84% |
|
1974-75 |
$298.9 |
5.75 |
3.70 |
85% |
|
1975-76 |
$350.6 |
6.22 |
3.86 |
86% |
|
1976-77 |
$355.4 |
5.64 |
3.98 |
85% |
|
1977-78 |
$354.8 |
5.29 |
4.07 |
84% |
|
1978-79 |
$271.2 |
3.84 |
4.06 |
79% |
|
1979-80 |
$232.6 |
3.14 |
4.00 |
76% |
|
1980-81 |
$273.4 |
3.41 |
3.96 |
77% |
|
1981-82 |
$366.2 |
4.01 |
3.96 |
80% |
|
1982-83 |
$378.3 |
3.63 |
3.94 |
78% |
|
1983-84 |
$419.3 |
3.71 |
3.92 |
79% |
|
1984-85 |
$459.3 |
3.83 |
3.91 |
79% |
|
1985-86 |
$493.8 |
3.94 |
3.92 |
80% |
|
1986-87 |
$536.9 |
4.10 |
3.93 |
80% |
|
1987-88 |
$575.0 |
4.14 |
3.94 |
81% |
|
1988-89 |
$614.4 |
4.32 |
3.97 |
81% |
|
1989-90 |
$665.9 |
4.39 |
4.00 |
81% |
|
1990-91 |
$287.9 |
1.79 |
3.85 |
64% |
|
1991-92 |
$400.9 |
2.13 |
3.73 |
68% |
|
1992-93 |
$423.8 |
2.29 |
3.64 |
70% |
|
1993-94 |
$434.9 |
2.47 |
3.57 |
71% |
|
1994-95 |
$437.2 |
2.61 |
3.52 |
72% |
|
1995-96 |
$409.8 |
2.70 |
3.48 |
73% |
|
1996-97 |
$389.6 |
2.83 |
3.46 |
74% |
|
1997-98 |
$402.6 |
2.90 |
3.44 |
74% |
|
1998-99 |
$396.0 |
2.90 |
3.42 |
74% |
|
1999-00 |
$562.4 |
3.90 |
3.43 |
80% |
|
2000-01 |
$511.0 |
3.43 |
3.43 |
77% |
|
2001-02 |
$529.0 |
3.44 |
3.43 |
77% |
|
2002-03 |
$556.0 |
3.43 |
3.43 |
77% |
|
TOTAL |
$15,043 |
|
|
|
Appendix Q (cont'd)
|
Year |
Cumulative |
Cumulative |
Cumulative |
|
|
|
$000,000 |
$000,000 |
|
|
9 |
|
|
|
|
|
|
|
|
1946-47 |
0% |
$1 |
$0 |
|
1947-48 |
51% |
$7 |
$7 |
|
1948-49 |
53% |
$13 |
$15 |
|
1949-50 |
54% |
$20 |
$24 |
|
1950-51 |
56% |
$28 |
$36 |
|
1951-52 |
62% |
$41 |
$66 |
|
1952-53 |
63% |
$57 |
$96 |
|
1953-54 |
63% |
$77 |
$132 |
|
1954-55 |
63% |
$99 |
$168 |
|
1955-56 |
63% |
$123 |
$209 |
|
1956-57 |
63% |
$149 |
$255 |
|
1957-58 |
63% |
$178 |
$305 |
|
1958-59 |
63% |
$208 |
$354 |
|
1959-60 |
63% |
$238 |
$406 |
|
1960-61 |
62% |
$270 |
$446 |
|
1961-62 |
62% |
$304 |
$502 |
|
1962-63 |
62% |
$338 |
$561 |
|
1963-64 |
77% |
$374 |
$1,221 |
|
1964-65 |
76% |
$409 |
$1,293 |
|
1965-66 |
76% |
$443 |
$1,369 |
|
1966-67 |
76% |
$468 |
$1,484 |
|
1967-68 |
76% |
$501 |
$1,615 |
|
1968-69 |
77% |
$535 |
$1,777 |
|
1969-70 |
77% |
$574 |
$1,934 |
|
1970-71 |
77% |
$613 |
$2,093 |
|
1971-72 |
77% |
$655 |
$2,233 |
|
1972-73 |
77% |
$699 |
$2,406 |
|
1973-74 |
78% |
$748 |
$2,656 |
|
1974-75 |
79% |
$800 |
$2,955 |
|
1975-76 |
79% |
$856 |
$3,306 |
|
1976-77 |
80% |
$919 |
$3,661 |
|
1977-78 |
80% |
$986 |
$4,016 |
|
1978-79 |
80% |
$1,057 |
$4,287 |
|
1979-80 |
80% |
$1,131 |
$4,520 |
|
1980-81 |
80% |
$1,211 |
$4,793 |
|
1981-82 |
80% |
$1,302 |
$5,159 |
|
1982-83 |
80% |
$1,406 |
$5,538 |
|
1983-84 |
80% |
$1,520 |
$5,957 |
|
1984-85 |
80% |
$1,639 |
$6,416 |
|
1985-86 |
80% |
$1,765 |
$6,910 |
|
1986-87 |
80% |
$1,896 |
$7,447 |
|
1987-88 |
80% |
$2,034 |
$8,022 |
|
1988-89 |
80% |
$2,177 |
$8,636 |
|
1989-90 |
80% |
$2,328 |
$9,302 |
|
1990-91 |
79% |
$2,489 |
$9,590 |
|
1991-92 |
79% |
$2,677 |
$9,991 |
|
1992-93 |
78% |
$2,862 |
$10,415 |
|
1993-94 |
78% |
$3,039 |
$10,850 |
|
1994-95 |
78% |
$3,207 |
$11,287 |
|
1995-96 |
78% |
$3,359 |
$11,697 |
|
1996-97 |
78% |
$3,496 |
$12,086 |
|
1997-98 |
77% |
$3,635 |
$12,489 |
|
1998-99 |
77% |
$3,772 |
$12,885 |
|
1999-00 |
77% |
$3,916 |
$13,447 |
|
2000-01 |
77% |
$4,065 |
$13,958 |
|
2001-02 |
77% |
$4,219 |
$14,487 |
|
2002-03 |
77% |
$4,381 |
$15,043 |
|
TOTAL |
|
|
|
Note: Commencing April 1, 1991 SRBA and Superannuation Accounts were combined.
Pensions and Benefits Sector, February 27, 2004
Source: PUBLIC ACCOUNTS OF CANADA
Appendix R
History of employer and member contributions to the Royal Canadian Mounted Police Pension Plan, 1949–50 to 2002–03
RCMP Pension Plan
|
|
Employee |
Employer |
Net |
Indexing |
|
|
$000,000 |
$000,000 |
$000,000 |
$000,000 |
|
|
1 |
2 |
3 |
4 |
|
|
|
|
|
|
|
1949-50 |
$0 |
$0 |
$0.0 |
|
|
1950-51 |
$0 |
$0 |
$0.0 |
|
|
1951-52 |
$0 |
$1 |
$0.0 |
|
|
1952-53 |
$0 |
$0 |
$0.0 |
|
|
1953-54 |
$0 |
$1 |
$0.0 |
|
|
1954-55 |
$1 |
$1 |
$0.0 |
|
|
1955-56 |
$1 |
$1 |
$0.0 |
|
|
1956-57 |
$1 |
$2 |
$0.0 |
|
|
1957-58 |
$1 |
$2 |
$0.0 |
|
|
1958-59 |
$1 |
$2 |
$0.0 |
|
|
1959-60 |
$1 |
$1 |
$0.0 |
|
|
1960-61 |
$1 |
$3 |
$0.0 |
|
|
1961-62 |
$2 |
$2 |
$0.0 |
|
|
1962-63 |
$2 |
$3 |
$0.0 |
|
|
1963-64 |
$2 |
$3 |
$6.3 |
|
|
1964-65 |
$2 |
$3 |
$1.0 |
|
|
1965-66 |
$2 |
$4 |
$1.0 |
|
|
1966-67 |
$2 |
$5 |
$3.3 |
|
|
1967-68 |
$3 |
$4 |
$5.3 |
|
|
1968-69 |
$3 |
$7 |
$7.8 |
|
|
1969-70 |
$4 |
$7 |
$9.6 |
|
|
1970-71 |
$6 |
$10 |
$11.1 |
|
|
1971-72 |
$7 |
$12 |
$7.9 |
|
|
1972-73 |
$8 |
$14 |
$8.2 |
|
|
1973-74 |
$9 |
$16 |
$6.9 |
$0 |
|
1974-75 |
$12 |
$20 |
$8.2 |
$1 |
|
1975-76 |
$15 |
$24 |
$11.0 |
$1 |
|
1976-77 |
$17 |
$28 |
$13.9 |
$1 |
|
1977-78 |
$20 |
$32 |
$15.0 |
$1 |
|
1978-79 |
$21 |
$39 |
$24.0 |
$2 |
|
1979-80 |
$23 |
$43 |
$15.1 |
$2 |
|
1980-81 |
$26 |
$48 |
$7.7 |
$3 |
|
1981-82 |
$32 |
$57 |
$1.1 |
$3 |
|
1982-83 |
$37 |
$66 |
$0.0 |
$4 |
|
1983-84 |
$40 |
$71 |
$0.0 |
$5 |
|
1984-85 |
$40 |
$74 |
$0.0 |
$5 |
|
1985-86 |
$41 |
$75 |
$0.0 |
$6 |
|
1986-87 |
$44 |
$79 |
$0.0 |
$7 |
|
1987-88 |
$48 |
$89 |
$0.0 |
$8 |
|
1988-89 |
$49 |
$106 |
$0.0 |
$9 |
|
1989-90 |
$52 |
$79 |
$0.0 |
$10 |
|
1990-91 |
$56 |
$102 |
$0.0 |
$12 |
|
1991-92 |
$60 |
$105 |
|
|
|
1992-93 |
$61 |
$120 |
|
|
|
1993-94 |
$60 |
$126 |
|
|
|
1994-95 |
$60 |
$126 |
|
|
|
1995-96 |
$57 |
$119 |
|
|
|
1996-97 |
$54 |
$120 |
|
|
|
1997-98 |
$54 |
$126 |
|
|
|
1998-99 |
$53 |
$140 |
|
|
|
1999-00 |
$54 |
$159 |
|
|
|
2000-01 |
$57 |
$173 |
|
|
|
2001-02 |
$62 |
$182 |
|
|
|
2002-03 |
$66 |
$192 |
|
|
|
Total |
$1,326 |
$2,821 |
$164 |
$78 |
Appendix R (cont'd)
|
|
Total |
Ratio of |
Cumulative |
Portion of |
|
|
$000,000 |
|
|
|
|
|
2+3+4 = 5 |
5 � 1 |
|
(5/(5�1) |
|
|
5 |
6 |
7 |
8 |
|
1949-50 |
$0 |
0.00 |
0.00 |
0% |
|
1950-51 |
$0 |
0.00 |
0.00 |
0% |
|
1951-52 |
$1 |
3.51 |
2.28 |
78% |
|
1952-53 |
$0 |
1.24 |
1.79 |
55% |
|
1953-54 |
$1 |
1.68 |
1.76 |
63% |
|
1954-55 |
$1 |
1.38 |
1.64 |
58% |
|
1955-56 |
$1 |
1.57 |
1.62 |
61% |
|
1956-57 |
$2 |
2.54 |
1.83 |
72% |
|
1957-58 |
$2 |
1.98 |
1.86 |
66% |
|
1958-59 |
$2 |
1.83 |
1.85 |
65% |
|
1959-60 |
$1 |
1.54 |
1.80 |
61% |
|
1960-61 |
$3 |
2.32 |
1.90 |
70% |
|
1961-62 |
$2 |
1.34 |
1.78 |
57% |
|
1962-63 |
$3 |
1.51 |
1.74 |
60% |
|
1963-64 |
$9 |
5.26 |
2.26 |
84% |
|
1964-65 |
$4 |
2.00 |
2.22 |
67% |
|
1965-66 |
$5 |
2.18 |
2.22 |
69% |
|
1966-67 |
$8 |
3.64 |
2.38 |
78% |
|
1967-68 |
$10 |
3.52 |
2.53 |
78% |
|
1968-69 |
$14 |
4.25 |
2.76 |
81% |
|
1969-70 |
$17 |
4.04 |
2.95 |
80% |
|
1970-71 |
$21 |
3.64 |
3.06 |
78% |
|
1971-72 |
$20 |
2.84 |
3.03 |
74% |
|
1972-73 |
$22 |
2.71 |
2.97 |
73% |
|
1973-74 |
$23 |
2.44 |
2.89 |
71% |
|
1974-75 |
$28 |
2.40 |
2.81 |
71% |
|
1975-76 |
$36 |
2.48 |
2.75 |
71% |
|
1976-77 |
$43 |
2.57 |
2.72 |
72% |
|
1977-78 |
$49 |
2.48 |
2.68 |
71% |
|
1978-79 |
$65 |
3.02 |
2.73 |
75% |
|
1979-80 |
$60 |
2.59 |
2.71 |
72% |
|
1980-81 |
$58 |
2.18 |
2.64 |
69% |
|
1981-82 |
$61 |
1.94 |
2.54 |
66% |
|
1982-83 |
$70 |
1.90 |
2.45 |
65% |
|
1983-84 |
$75 |
1.89 |
2.38 |
65% |
|
1984-85 |
$79 |
1.97 |
2.33 |
66% |
|
1985-86 |
$81 |
1.98 |
2.29 |
66% |
|
1986-87 |
$86 |
1.97 |
2.26 |
66% |
|
1987-88 |
$97 |
2.03 |
2.24 |
67% |
|
1988-89 |
$115 |
2.36 |
2.25 |
70% |
|
1989-90 |
$89 |
1.72 |
2.20 |
63% |
|
1990-91 |
$114 |
2.04 |
2.19 |
67% |
|
1991-92 |
$105 |
1.77 |
2.15 |
64% |
|
1992-93 |
$120 |
1.96 |
2.13 |
66% |
|
1993-94 |
$126 |
2.09 |
2.13 |
68% |
|
1994-95 |
$126 |
2.11 |
2.13 |
68% |
|
1995-96 |
$119 |
2.09 |
2.13 |
68% |
|
1996-97 |
$120 |
2.21 |
2.13 |
69% |
|
1997-98 |
$126 |
2.35 |
2.14 |
70% |
|
1998-99 |
$140 |
2.66 |
2.17 |
73% |
|
1999-00 |
$159 |
2.96 |
2.20 |
75% |
|
2000-01 |
$173 |
3.04 |
2.24 |
75% |
|
2001-02 |
$182 |
2.94 |
2.28 |
75% |
|
2002-03 |
$192 |
2.91 |
2.31 |
74% |
|
Total |
$3,064 |
|
|
|
Appendix R (cont'd)
|
|
Cumulative |
Cumulative |
Cumulative |
|
|
|
$000,000 |
$000,000 |
|
|
|
|
|
|
|
9 |
1 |
2 |
|
1949-50 |
0% |
$0 |
$0 |
|
1950-51 |
0% |
$0 |
$0 |
|
1951-52 |
70% |
$0 |
$1 |
|
1952-53 |
64% |
$1 |
$1 |
|
1953-54 |
64% |
$1 |
$2 |
|
1954-55 |
62% |
$2 |
$3 |
|
1955-56 |
62% |
$2 |
$4 |
|
1956-57 |
65% |
$3 |
$5 |
|
1957-58 |
65% |
$4 |
$7 |
|
1958-59 |
65% |
$5 |
$9 |
|
1959-60 |
64% |
$6 |
$10 |
|
1960-61 |
65% |
$7 |
$13 |
|
1961-62 |
64% |
$9 |
$15 |
|
1962-63 |
63% |
$10 |
$18 |
|
1963-64 |
69% |
$12 |
$27 |
|
1964-65 |
69% |
$14 |
$31 |
|
1965-66 |
69% |
$16 |
$36 |
|
1966-67 |
70% |
$19 |
$44 |
|
1967-68 |
72% |
$21 |
$54 |
|
1968-69 |
73% |
$25 |
$68 |
|
1969-70 |
75% |
$29 |
$85 |
|
1970-71 |
75% |
$35 |
$106 |
|
1971-72 |
75% |
$41 |
$125 |
|
1972-73 |
75% |
$50 |
$147 |
|
1973-74 |
74% |
$59 |
$170 |
|
1974-75 |
74% |
$71 |
$199 |
|
1975-76 |
73% |
$85 |
$235 |
|
1976-77 |
73% |
$102 |
$278 |
|
1977-78 |
73% |
$122 |
$327 |
|
1978-79 |
73% |
$143 |
$391 |
|
1979-80 |
73% |
$166 |
$451 |
|
1980-81 |
73% |
$193 |
$509 |
|
1981-82 |
72% |
$224 |
$570 |
|
1982-83 |
71% |
$261 |
$640 |
|
1983-84 |
70% |
$301 |
$715 |
|
1984-85 |
70% |
$341 |
$794 |
|
1985-86 |
70% |
$382 |
$875 |
|
1986-87 |
69% |
$425 |
$960 |
|
1987-88 |
69% |
$473 |
$1,057 |
|
1988-89 |
69% |
$522 |
$1,173 |
|
1989-90 |
69% |
$573 |
$1,262 |
|
1990-91 |
69% |
$629 |
$1,375 |
|
1991-92 |
68% |
$689 |
$1,481 |
|
1992-93 |
68% |
$750 |
$1,600 |
|
1993-94 |
68% |
$810 |
$1,726 |
|
1994-95 |
68% |
$870 |
$1,852 |
|
1995-96 |
68% |
$927 |
$1,972 |
|
1996-97 |
68% |
$981 |
$2,092 |
|
1997-98 |
68% |
$1,035 |
$2,218 |
|
1998-99 |
68% |
$1,088 |
$2,358 |
|
1999-00 |
69% |
$1,141 |
$2,517 |
|
2000-01 |
69% |
$1,198 |
$2,690 |
|
2001-02 |
69% |
$1,260 |
$2,872 |
|
2002-03 |
70% |
$1,326 |
$3,064 |
|
Total |
|
|
|
Source: PUBLIC ACCOUNTS OF CANADA AND SRBA ANNUAL REPORTS.
Pensions and Benefits Sector
February 27, 2004