
Treasury Board of Canada Secretariat
www.tbs-sct.gc.ca
Common menu bar links
Breadcrumb Trail
ARCHIVED - National Research Council Canada - Report
 This page has been archived.
Archived Content
Information identified as archived on the Web is for reference, research or recordkeeping purposes. It has not been altered or updated after the date of archiving. Web pages that are archived on the Web are not subject to the Government of Canada Web Standards. As per the Communications Policy of the Government of Canada, you can request alternate formats on the "Contact Us" page.
Minister's Message

Last year, the Industry Portfolio played a key role in advancing the government's agenda in Year 2 of Canada's Economic Action Plan.
Specific stimulus measures taken by the Industry Portfolio under Canada's Economic Action Plan were aimed at boosting economic development, supporting small and medium-sized enterprises, improving Canada's research and development capacity and strengthening communities. The Portfolio's stimulus measures targeted communities through the Marquee Tourism Events Program and the Broadband Canada: Connecting Rural Canadians program. Further investments in the Industrial Research Assistance Program, the Industrial Research and Development Internship Program, the Canada Graduate Scholarships Program and the Knowledge Infrastructure Program expanded Canada's research and development capacity. Investing in the Canadian space industry maintained Canadian expertise and leadership in space robotics. Through these and other stimulus initiatives, we helped create jobs, build communities and nurture the roots of economic recovery.
In 2010-11, the Government of Canada completed its two-year investment of $200 million to temporarily expand the National Research Council of Canada's Industrial Research Assistance Program's initiatives for small and medium-sized businesses. This investment helped 2,422 Canadian firms enhance their innovative capacity and enabled the placement of 1,567 post-secondary graduates in Canadian companies. The Council also updated the Model National Energy Code of Canada for Houses, which allows designers and contractors to make energy-wise decisions during the planning and construction of new houses. The Council saw an increase in its licensing and product and process transfer to industry by some 17 percent and 14 percent respectively compared to the 2009-10 levels. These revenues are expected to increase in the coming years as the Council continues to transition to a world-leading research and technology organization focused on strengthening Canadian productivity and competitiveness – areas of key priority for the government.
Cultivating an environment for job creation, growth and competitiveness, both domestically and internationally, remains a priority for the Industry Portfolio. We will work to improve cost-effectiveness and efficiency and will contribute to the Government of Canada's priority of balancing the budget and achieving real results for all Canadians.
It is my pleasure to present the National Research Council of Canada's Departmental Performance Report for 2010-11.
Christian Paradis
Minister of Industry and Minister of State (Agriculture)
President's Message

I am proud to submit for tabling in Parliament the 2010-11 Departmental Performance Report for the National Research Council of Canada. NRC's plans and priorities are well aligned with the Government of Canada's science and technology strategy, Mobilizing Science and Technology to Canada's Advantage, and as such, strongly contribute to advancements in innovative technologies and to increased innovation capacity in targeted industries and other national priority areas.
2010-11 marked the beginning of a transition period for NRC as we began a critical renewal exercise to further strengthen our role as a research and technology organization (RTO) focused on Canadian productivity and competitiveness. In fact, NRC's vision is to become the best RTO in the world.
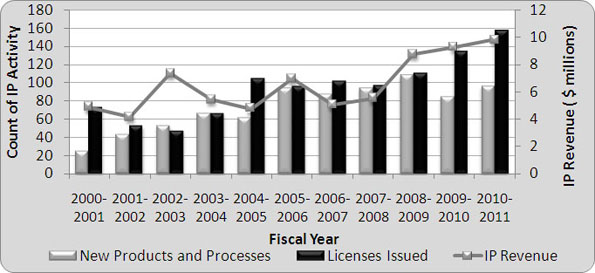
Our performance over the last year reflects this change in direction. In 2010-11, NRC led or participated in almost 1,500 collaborative research agreements to develop and advance new technologies – an increase of 18% over the previous year – with over 1,700 industrial and research collaborators. This includes over 380 international collaborations. As a direct result, NRC delivered or co-delivered 97 unique innovations (a 14% increase) and issued 158 licenses (a 17% increase) to Canadian industries to significantly improve their products, services, technologies and/or processes.
A major socio-economic study was conducted in 2010-11 by NRC, in connection with Statistics Canada, to investigate the impact of our assistance, research and technical services on clients' sales and innovation capacity. That impact was found to be strong. For every dollar of NRC science and technology (S&T) activity, over nine dollars in client sales were shown to be generated. NRC's direct contributions to business expenditures in research and development (BERD) were also shown to have generated between $1.50 and $2.00 of additional research and development (R&D) for each dollar invested.
Canada's future depends on a strong record in innovation and technology. NRC has a critical role to play in building that record through research and collaborations with industry and other partners, developing and cultivating new opportunities for Canada.
Mr. John McDougall
President
Section I: Organizational Overview
Raison d'être
The National Research Council (NRC) aims to become one of the world's leading research and technology organizations (RTO), helping Canada keep pace with the changing innovation landscape, with a focus on generating socio-economic benefits for Canadians. With a presence in every province, NRC has a strong national foundation along with international linkages to help Canada remain competitive in the transitioning global economy. NRC's expertise and unique contributions strive to develop and deploy technologies to the marketplace by: undertaking research and development (R&D) in areas critical to Canada's future; fostering industrial and community innovation and growth through technology and industry support; and providing, maintaining and advancing national infrastructure and information for the scientific and industrial community to help push innovation forward and keep Canada at the cutting-edge. NRC's approach is directly aligned to the Government of Canada's science and technology (S&T) strategy, Mobilizing Science and Technology to Canada's Advantage and its four key principles: promoting world class excellence in research; focusing on priorities for the short and long term; encouraging strong partnerships and enhancing accountability.
Responsibilities
Under the National Research Council Act, NRC is responsible for:
- Undertaking, assisting or promoting scientific and industrial research in fields of importance to Canada;
- Providing vital scientific and technological services to the research and industrial communities;
- Investigating standards and methods of measurement;
- Working on the standardization and certification of scientific and technical apparatus, instruments and materials used or usable by Canadian industry;
- Operating and administering any astronomical observatories established or maintained by the Government of Canada;
- Establishing, operating and maintaining a national science library; and
- Publishing and selling or otherwise distributing such scientific and technical information as the Council deems necessary.
NRC Accountability Framework
NRC is a departmental corporation of the Government of Canada, reporting to Parliament through the Minister of Industry. NRC works in partnership with members of the Industry Portfolio to leverage complementary resources to promote the innovation of firms, to exploit synergies in key areas of S&T, to promote the growth of small and medium-sized firms (SMEs), and to contribute to Canadian economic growth. NRC's Council provides independent strategic direction and advice to the President and reviews organizational performance. The President provides leadership and strategic management and is responsible for the achievement of NRC's long-range goals and plans within the guidance of the NRC Council. Each of six Vice Presidents is responsible for a portfolio of Program Activities composed of research institutes, initiatives, centres and/or a corporate branch. Supporting senior management, 24 Directors General, two General Managers and various committees are responsible for executing plans and priorities and ensuring successful achievement of objectives.
Strategic Outcomes and Program Activity Architecture (PAA)
- Advancements in Innovative Technologies and Increased Innovation Capacity in Targeted Canadian Industries and National Priority Areas
- Canadians have Access to Research and Development Information and Infrastructure
NRC's aim is to create a sustainable advantage for Canadians through S&T leadership, which contributes to improved economic competitiveness and social betterment for our nation. Through strategic relationships with industry, government and academia, NRC works to align the strengths and critical mass required to achieve four of Canada's Strategic Outcomes (SOs): strong economic growth; healthy Canadians; a clean and healthy environment; and an innovative and knowledge-based economy. NRC's Program Activities (PAs) directly support the delivery of NRC's Strategic Outcomes, which are aligned to deliver against these federal commitments. The approved 2010-11 NRC PAA structure, shown below, represents how activities are organized to achieve these desired results.
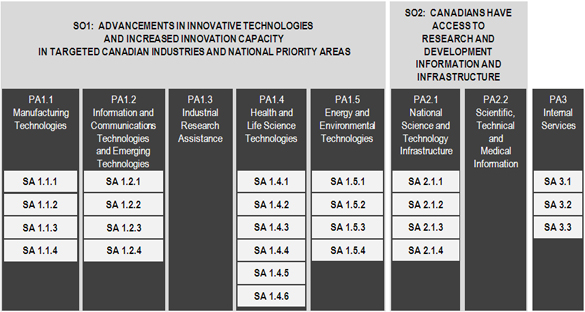
Legend
SO – Strategic Outcome
PA – Program Activity
SA – Sub-Activity
SA 1.1.1 – Aerospace Research
SA 1.1.2 – Construction Research and Support
SA 1.1.3 – Manufacturing and Materials Research
SA 1.1.4 – Surface Transportation Technology
SA 1.2.1 – Semiconductor-Based Technology Research
SA 1.2.2 – Information Technology Research
SA 1.2.3 – Nanotechnology Research
SA 1.2.4 – Molecular Sciences Research
SA 1.4.1 – Health and Environmental Biotechnology Research
SA 1.4.2 – Age-Related and Infectious Disease Research
SA 1.4.3 – Medical Diagnostic Technology Research
SA 1.4.4 – Marine Biosciences and Nutrisciences Research
SA 1.4.5 – Plant Biotechnology Research
SA 1.4.6 – Genomics and Health Technology
SA 1.5.1 – Ocean Technology Research
SA 1.5.2 – Sustainable Energy Technologies and Environmental Monitoring Research
SA 1.5.3 – Fuel Cells Technology Research
SA 1.5.4 – Hydraulics Technology Research
SA 2.1.1 – National Measurement Standards
SA 2.1.2 – Canadian Astronomical Observatories
SA 2.1.3 – Facility for Sub-Atomic Research TRIUMF
SA 2.1.4 – Canadian Neutron Beam Centre
SA 3.1 – Governance and Management Support
SA 3.2 – Resource Management Services
SA 3.3 – Asset Management Services
Organizational Priorities
Performance/Priority Status Legend
Exceeded: More than 100 per cent of the expected level of performance (as evidenced by the indicator and target or planned activities and outputs) for the expected result or priority identified in the corresponding Report on Plans and Priorities (RPP) was achieved during the fiscal year.
Met All: 100 per cent of the expected level of performance (as evidenced by the indicator and target or planned activities and expected outputs) for the expected result or priority identified in the corresponding RPP was achieved during the fiscal year.
Mostly Met: 80 to 99 per cent of the expected level of performance (as evidenced by the indicator and target or planned activities and expected outputs) for the expected result or priority identified in the corresponding RPP was achieved during the fiscal year.
Somewhat Met: 60 to 79 per cent of the expected level of performance (as evidenced by the indicator and target or planned activities and expected outputs) for the expected result or priority identified in the corresponding RPP was achieved during the fiscal year.
Not Met: Less than 60 per cent of the expected level of performance (as evidenced by the indicator and target or planned activities and expected outputs) for the expected result or priority identified in the corresponding RPP was achieved during the fiscal year.
| Priority | Type1 | Strategic Outcome 1 |
|---|---|---|
| To contribute to the global competitiveness of key industrial sectors and to support the economic growth and development of communities across Canada. | Ongoing | Advancements in Innovative Technologies and Increased Innovation Capacity in Targeted Canadian Industries and National Priority Areas |
| Status | ||
Met all (100%)
|
||
In 2010-11 NRC licensing activity continued on an upward trend, one NRC has generally witnessed over the past decade. Revenue from Intellectual Property (IP) increased to a high of $9.8M.
| Priority | Type | Strategic Outcome 1 |
|---|---|---|
| To support and conduct R&D in areas of national importance such as healthy Canadians, sustainable energy and a clean environment. | Ongoing | Advancements in Innovative Technologies and Increased Innovation Capacity in Targeted Canadian Industries and National Priority Areas |
| Status | ||
Met all (100%)
|
||
| Priority | Type | Strategic Outcome 2 |
|---|---|---|
| To provide integrated support that engages key players across government, academia, and industry | Ongoing | Canadians have Access to Research and Development Information and Infrastructure |
| Status | ||
Met all (100%)
|
||
| Priority | Type | Strategic Outcomes 1 and 2 |
|---|---|---|
| To ensure effective program management for a sustainable organization | Ongoing | Advancements in Innovative Technologies and Increased Innovation Capacity in Targeted Canadian Industries and National Priority Areas, and, Canadians have Access to Research and Development Information and Infrastructure |
| Status | ||
Met all (100%)
|
||
Risk Analysis
In 2010-11, Canada approached the end of stimulus spending for economic recovery through Canada's Economic Action Plan with future budget reductions now anticipated, aimed at reducing the deficit in the near term. Continued attention was given to the innovation and productivity lag in Canada through studies, such as the federal government's R&D Review, in which NRC participated. With recognition of the growing strength of emerging economies such as India and China, Canada needs to focus its R&D resources where it can have the greatest impact to enhance industry competitiveness, and leverage international S&T through collaborations and capital/resources. NRC plays an important role as a research and technology organization in this regard.
Changes in NRC's senior executive members and a new President put in motion a renewal exercise on the organization's strategy, direction and culture. A new vision and mission for the organization were adopted, and NRC is examining its activities to ensure that they are in the right direction and delivered with a clear value proposition for Canada.
NRC's risk management priorities in 2010-11 focused on addressing the highest risks identified in the Corporate Risk Profile, including:
Strategic leadership/governance: The risk of ineffective decision-making around critical strategic issues with increased senior executive time dedicated to addressing operational issues, and a broad focus on research and development at a time of financial pressures. Potential consequences include NRC not delivering its full value and impact, and the potential inability to generate future organizational sustainability.
- The risk management strategy focused on Strategic Leadership: Strengthening decision-making and priority-setting mechanisms and structures, adjusting to changes resulting from the economic downturn, and ensuring alignment of investments with objectives through the business planning process. Progress was made to lay the foundation for new strategic directions and focus. This included the development of new program-based selection and planning processes to begin transitioning NRC from an institute-based to a program-based management structure for greater focus and critical mass. Progress also included implementation of the new investment planning and project management process.
Promotion, image and understanding of NRC: The risk of lack of awareness and understanding of the organization due to: low visibility of its role and contributions to Canada; lack of a clearly defined unique, differentiated position for itself that is understood and strongly supported; and weak coordination and communications of NRC's successes and value-added. Potential consequences include the inability to attract collaborators and technical expertise and generate a sufficient level of external sources of funding to fulfill NRC's role.
- The risk management strategy focused on Stakeholder Relationships: Developing and implementing an effective communications, marketing and stakeholder relations strategy that will result in coordinated action across NRC at multiple levels. Aligned with NRC's new strategic orientation, progress has been made to enhance stakeholder relations and client management through increased dialogue with current and future potential public and private sector collaborators in Canada and abroad, as well as new initiatives to raise awareness of NRC offerings, such as NRC branding. Such initiatives will continue to take shape as NRC's new strategy unfolds.
Funding and financial pressures: The risk of a reduction in NRC's ability to carry out its activities and deliver on its expected outcomes due to financial constraints arising from such issues as growing operations and maintenance costs, sunsetting funds, and the inability to address shortfalls without increased external sources of funding. Potential consequences include NRC not delivering its full value and impact, and the potential inability to attract and retain high quality scientific and technical personnel and generate future organizational sustainability.
- The risk management strategy focused on Financial Sustainability: Establishing sustainability through various short and longer term strategies focused on reducing and streamlining activities, achieving greater efficiencies and enhancing revenue. Several initiatives were undertaken to address financial sustainability, including a review of corporate overhead efficiencies, the development of revenue generation plans with higher revenue targets, and new financial reporting practices. As part of NRC's strategy, further work is being done on funding models for financial sustainability and creating greater focus and critical mass by moving towards a program-based management model.
From a positive risk perspective, NRC has benefited from opportunities associated with greater visibility from media coverage and outreach activities, and enhanced communications with other government groups. This has allowed for a better understanding of how and where NRC contributes to Canada, and provides future opportunities to better link to collaborators and service clients.
Summary of Performance
2010-11 Financial Resources ($ millions)
| Planned Spending | Total Authorities* | Actual Spending** |
|---|---|---|
| 749.0 | 963.6 | 903.3 |
* The Total Authorities includes Planned Spending, amounts from Budget 2010, amounts from Supplementary Estimates, and other statutory authorities.↑
** Except where noted otherwise, all financial results are reported on a cash accounting basis for historical comparability.↑
The Planned Spending amount is the best estimate of spending, is prepared prior to the budget and prior to the start of the fiscal year. The Total Authorities includes the Planned Spending plus all items approved subsequent to the Planned Spending number being prepared and reflects authorities available at the end of the fiscal year. There is a $214.6M difference between the two numbers and this amount is from items approved over the course of the fiscal year. The major items that made up this increase were $68.4M for the Clusters Initiative, $45.0M transferred from the Federal Economic Development Agency for Southern Ontario, $45.8M in other statutory authorities, $30.2M for personnel costs, $25.7M for TRIUMF, $3.6M for the Youth Employment Strategy and a combined reduction of $4.5M for several smaller items. There is $60.3M less in Actual Spending when compared to Total Authorities. Of this amount, $48.0M is statutory revenues that are carried forward to the next fiscal year, $7.9M is frozen and to be used for employee benefit plan costs and other items, and the balance is unspent and returned.
2010-11 Human Resources (Full Time Equivalents (FTEs))
| Planned | Actual | Difference |
|---|---|---|
| 3,675 | 4,365 | 690* |
| Performance Indicators | Targets | 2010-11 Performance2 |
|---|---|---|
| Average incremental number of new and improved client products as a result of NRC's R&D activities compared to non-clients | 0.6 by March 2012 | Total attributable private sector client sales, as a result of NRC's activities, were estimated to have increased from $2.53B in 2006-07 to $3.45B in 2010-11.3 |
| Average incremental client R&D expenditures as a result of NRC's R&D activities compared to non-clients | $75K by March 2012 | Based on study results, it is estimated that total attributable private sector client R&D expenditures increased from $285M in 2006-07 to $430M in 2010-11.4 |
| Average incremental client R&D full-time equivalents employed as a result of NRC's R&D activities compared to non-clients | 1.2 by March 2012 | Based on study results, it is estimated that total attributable private sector client R&D employment increased from 2,325 in 2006-07 to 3,735 in 2010-11.5 |
| Program Activity | 2009-10 Actual Spending ($ millions) |
2010-116 ($ millions) | Alignment to Government of Canada Outcomes | |||
|---|---|---|---|---|---|---|
| Main Estimates |
Planned Spending |
Total Authorities |
Actual Spending |
|||
| Manufacturing Technologies | 144.6 | 115.0 | 115.0 | 146.5 | 128.6 | Strong Economic Growth |
| Information and Communications Technologies and Emerging Technologies | 83.7 | 44.8 | 44.8 | 76.8 | 77.2 | Strong Economic Growth |
| Industrial Research Assistance | 285.7 | 237.6 | 237.6 | 293.3 | 286.2 | Strong Economic Growth |
| Health and Life Science Technologies | 122.4 | 102.3 | 102.3 | 104.1 | 115.1 | Healthy Canadians |
| Energy and Environmental Technologies | 48.7 | 28.2 | 28.2 | 41.5 | 36.5 | A Clean and Healthy Environment |
| Total | 685.1 | 527.9 | 527.9 | 662.2 | 643.6* | |
* NRC spent less than total voted Parliamentary authorities. The majority of the unspent balance relates to revenues carried forward to FY 2011-12. Note that at the program activity level, actual spending may be higher than Total Authorities as spending priorities shifted to meet program needs.↑
Note: Due to rounding, figures may not add to total shown.
| Performance Indicator | Target | 2010-11 Performance |
|---|---|---|
| Proportion of surveyed S&T infrastructure users who report positively on the value of the NRC infrastructure used | 85% by March 2012 | 93% |
| Program Activity | 2009-10 Actual Spending ($ millions) |
2010-11 ($ millions) | Alignment to Government of Canada Outcomes | |||
|---|---|---|---|---|---|---|
| Main Estimates |
Planned Spending |
Total Authorities |
Actual Spending |
|||
| National Science and Technology Infrastructure | 100.6 | 49.7 | 49.7 | 98.8 | 98.6 | An Innovative and Knowledge-based Economy |
| Scientific, Technical and Medical Information | 27.7 | 39.0 | 39.0 | 48.6 | 33.6 | An Innovative and Knowledge-based Economy |
| Total | 128.3 | 88.7 | 88.7 | 147.4 | 132.2* | |
* NRC did not spend its full Authorities, most of which relates to revenues carried forward to FY 2011-12.↑
Note: Due to rounding, figures may not add to total shown.
| Program Activity | 2009-10 Actual Spending ($ millions) |
2010-11 ($ millions) | |||
|---|---|---|---|---|---|
| Main Estimates |
Planned Spending |
Total Authorities |
Actual Spending |
||
| Internal Services | 117.7 | 132.3 | 132.3 | 153.9 | 127.6 |
Expenditure Profile
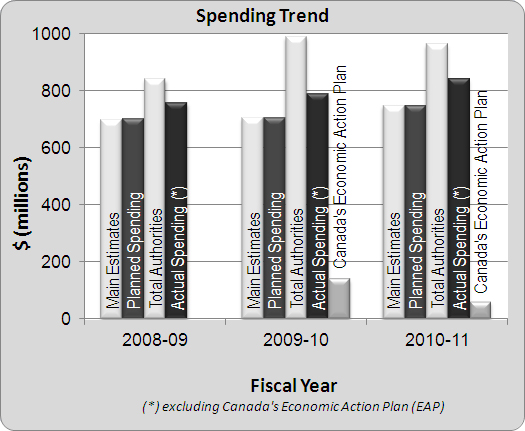
Departmental Spending Trend
NRC's actual spending for 2010-11 was $903.3M. Over the past three years (FY 2008-09 to FY 2010-11), actual spending averaged $864.1M. The average spending increased by $44.0M (or 5.4%) when compared to last year's average. The increase is due primarily to additional TRIUMF funding and a transfer from the Federal Department for Economic Development in Southern Ontario.
Estimates by Vote
For information on NRC's organizational votes and/or statutory expenditures, please see the 2010-11 Public Accounts of Canada (Volume II) publication. An electronic version of the Public Accounts is available on the Public Works and Government Services Canada (PWGSC) web site.