
Treasury Board of Canada Secretariat
www.tbs-sct.gc.ca
Common menu bar links
Breadcrumb Trail
ARCHIVED - Public Health Agency of Canada
 This page has been archived.
Archived Content
Information identified as archived on the Web is for reference, research or recordkeeping purposes. It has not been altered or updated after the date of archiving. Web pages that are archived on the Web are not subject to the Government of Canada Web Standards. As per the Communications Policy of the Government of Canada, you can request alternate formats on the "Contact Us" page.
SECTION III – SUPPLEMENTARY INFORMATION
Financial Highlights
The financial highlights presented are intended to serve as a general overview of the Agency’s financial position and operations. Financial statements can be found on the Agency’s website at: ![]() http://www.phac-aspc.gc.ca/dpr-rmr/2007-2008/index-eng.php.
http://www.phac-aspc.gc.ca/dpr-rmr/2007-2008/index-eng.php.
| FINANCIAL HIGHLIGHTS | |||||||
| (in dollars) | % Change | 2008 | 2007 | ||||
| Condensed Statement of Financial Position | |||||||
| At March 31 | |||||||
| ASSETS | 6% | 76,150,383 | 71,585,543 | ||||
| LIABILITIES | 36% | 181,365,470 | 133,743,601 | ||||
| EQUITY OF CANADA | 69% | (105,215,087) | (62,158,058) | ||||
| TOTAL | 6% | 76,150,383 | 71,585,543 | ||||
| Condensed Statement of Operations | |||||||
| At March 31 | |||||||
| EXPENSES | 13% | 607,098,260 | 536,098,033 | ||||
| REVENUES | 54% | 525,261 | 341,495 | ||||
| NET COST OF OPERATIONS | 13% | 606,572,999 | 535,756,538 | ||||
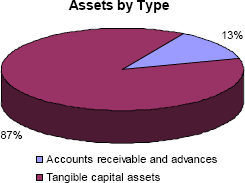 |
Total assets were $76.2 million at the end of 2007-08; an increase of $4.6 million (6%) over the previous year’s total assets of $71.6 million. Tangible capital assets represented $66.6 million (87%) while accounts receivable and advances represented $9.5 million (13%) of total assets. |
| Total liabilities were $181.4 million at the end of 2007-08, an increase of $47.6 million (36%) over the previous year’s total liabilities of $133.7 million. Accounts payable represents the largest portion of liabilities at $138.5 million or 76% of total liabilities. | 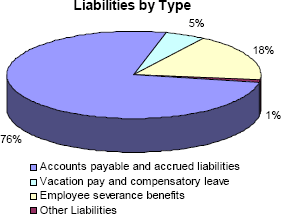 |
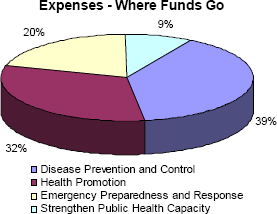 |
Total expenses for the Agency were $607.1 million in 2007-08. The Agency spent $239.7 million (39%) on disease prevention and control, $192.2 million (32%) on health promotion, $122.6 million (20%) on emergency preparedness and response and $52.5 million (9%) on strengthening public health capacity. As detailed in Sections I and II, expected results were partially met for disease prevention and control and successfully met for health promotion, emergency preparedness and response, and strengthening public health capacity. |
Table 1: Comparison of Planned to Actual Spending (including Full-Time Equivalents)
| ($ millions) | 2005–06 Actual |
2006–07 Actual |
2007–08 | |||
| Main Estimates |
Planned Spending |
Total Authorities |
Actual | |||
| Health Promotion | 199.2 | 202.7 | 186.4 | 186.5 | 200.2 | 192.1 |
| Disease Prevention and Control | 211.5 | 242.4 | 300.5 | 311.8 | 290.3 | 240.5 |
| Emergency Preparedness and Response | 41.1 | 31.5 | 115.8 | 115.9 | 137.8 | 121.3 |
| Strengthen Public Health Capacity | 25.4 | 34.2 | 55.6 | 55.6 | 55.8 | 53.0 |
| Total | 477.2 | 510.8 | 658.3 | 669.8 | 684.1 | 606.9 |
| Less: Non‑respendable revenue | 0.2 | 0.3 | 0.0 | 0.0 | 0.0 | 0.5 |
| Plus: Cost of services received without charge | 17.6 | 21.0 | N/A | 22.7 | 22.7 | 17.7 |
| Total Spending | 494.6 | 531.5 | 658.3 | 692.5 | 706.8 | 624.1 |
| Full-Time Equivalents* | 1801 | 2050 | 2376 | 2376 | 2410 | 2165 |
* Full-Time Equivalents (FTE) are a measure of human resource consumption based on average levels of employment.
Table 2: Voted and Statutory Items
($ millions)
Vote or Statutory Item |
Truncated Vote or Statutory Wording |
2007–08 | |||
| Main Estimates |
Planned Spending |
Total Authorities |
Total Actual | ||
| 35 | Operating expenditures | 438.4 | 446.1 | 457.4 | 393.3 |
| 40 | Grants and contributions | 189.3 | 192.5 | 201.8 | 188.7 |
| (S) | Contributions to employee benefit plans | 30.6 | 31.2 | 24.9 | 24.9 |
| Total | 658.3 | 669.8* | 684.1** | 606.9*** | |
* The $11.5 million increase from Main Estimates to Planned Spending is mainly due to increased funding for renewed public health response to address hepatitis C.
** Please refer to Section I, Table entitled "Financial Resources" for explanations of the $14.3 million increase from Planned Spending to Total Authorities.
*** Please refer to Section I, Table entitled "Financial Resources" for explanations of the $77.2 million decrease from Total Authorities to Total Actual.
The following tables are available online:
Table 3: Sources of Respendable and Non-Respendable Revenue
For supplementary information on the Agency’s sources of Respendable and Non-respendable Revenue, please visit: ![]() http://www.tbs-sct.gc.ca/dpr-rmr/st-ts-eng.asp
http://www.tbs-sct.gc.ca/dpr-rmr/st-ts-eng.asp
Table 4–A: User Fees Act
For supplementary information on the Agency’s User Fees, please visit: ![]() http://www.tbs-sct.gc.ca/dpr-rmr/st-ts-eng.asp
http://www.tbs-sct.gc.ca/dpr-rmr/st-ts-eng.asp
Table 4–B: Service Standards for External Fees
For supplementary information on the Agency’s Service Standards for External Fees, please visit: ![]() http://www.tbs-sct.gc.ca/dpr-rmr/st-ts-eng.asp
http://www.tbs-sct.gc.ca/dpr-rmr/st-ts-eng.asp
Table 5: Details on Project Spending
For supplementary information on the Agency’s Details on Project Spending, please visit: ![]() http://www.tbs-sct.gc.ca/dpr-rmr/st-ts-eng.asp
http://www.tbs-sct.gc.ca/dpr-rmr/st-ts-eng.asp
Table 6: Details on Transfer Payment Programs
For supplementary information on the Agency’s Details on Transfer Payment Programs, please visit: ![]() http://www.tbs-sct.gc.ca/dpr-rmr/st-ts-eng.asp
http://www.tbs-sct.gc.ca/dpr-rmr/st-ts-eng.asp
Table 7: Foundations (Conditional Grants)
The Agency provided a one-time conditional grant of $100 million in 2004-05 for the Public Health Surveillance aspects of Canada Health Infoway's electronic health information work. The Agency's progress report is combined with Health Canada's report on other aspects of Infoway's work, and can be found in Health Canada's Departmental Performance Report. For further information, please visit the Health Canada supplementary information at: ![]() http://www.tbs-sct.gc.ca/dpr-rmr/st-ts-eng.asp
http://www.tbs-sct.gc.ca/dpr-rmr/st-ts-eng.asp
Table 8: Horizontal Initiatives
For supplementary information on the Agency’s Horizontal Initiatives, please visit: ![]() http://www.tbs-sct.gc.ca/dpr-rmr/st-ts-eng.asp
http://www.tbs-sct.gc.ca/dpr-rmr/st-ts-eng.asp
Table 9: Sustainable Development Strategy
For supplementary information on the Agency’s Sustainable Development Strategy, please visit: ![]() http://www.tbs-sct.gc.ca/dpr-rmr/st-ts-eng.asp
http://www.tbs-sct.gc.ca/dpr-rmr/st-ts-eng.asp
Table 10: Response to Parliamentary Committees and External Audits
For supplementary information on the Agency’s Response to Parliamentary Committees and External Audits, please visit: ![]() http://www.tbs-sct.gc.ca/dpr-rmr/st-ts-eng.asp
http://www.tbs-sct.gc.ca/dpr-rmr/st-ts-eng.asp
Table 11: Internal Audits and Evaluations
For supplementary information on the Agency’s Internal Audits and Evaluations, please visit: ![]() http://www.tbs-sct.gc.ca/dpr-rmr/st-ts-eng.asp
http://www.tbs-sct.gc.ca/dpr-rmr/st-ts-eng.asp
Table 12: Travel Policies
For supplementary information on the Agency’s Travel Policies, please visit: ![]() http://www.tbs-sct.gc.ca/dpr-rmr/st-ts-eng.asp
http://www.tbs-sct.gc.ca/dpr-rmr/st-ts-eng.asp