Common menu bar links
Breadcrumb Trail
ARCHIVED - Western Economic Diversification Canada - Report
 This page has been archived.
Archived Content
Information identified as archived on the Web is for reference, research or recordkeeping purposes. It has not been altered or updated after the date of archiving. Web pages that are archived on the Web are not subject to the Government of Canada Web Standards. As per the Communications Policy of the Government of Canada, you can request alternate formats on the "Contact Us" page.
Section III: Supplementary Information
Financial Highlights
| % Change | 2009-10 (restated)11 |
2010-11 | |
|---|---|---|---|
| Total Assets | 24% | 219,242 | 271,286 |
| Total Liabilities | 26% | 195,522 | 246,957 |
| Equity of Canada | 2% | 23,720 | 24,329 |
| Total | 24% | 219,242 | 271,286 |
| % Change | 2009-10 | 2010-11 | |
|---|---|---|---|
| Total Expenses | 12% | 415,074 | 464,509 |
| Total Revenues | -74% | 2,720 | 712 |
| Net Cost of Operations | 12% | 412,354 | 463,797 |
Financial Highlights Charts/Graphs

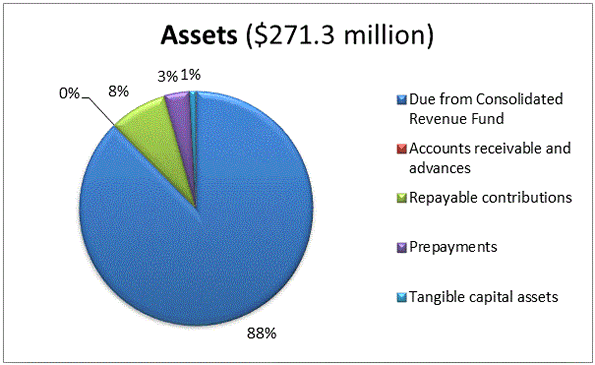
Total Assets were $271.3 million at the end of 2010–11, an increase of $52.1 million (24 percent) over the previous year’s total assets of $219.2 million. The increase can be attributed to the changes in accounting policy which stipulates that total assets include amounts due from the Consolidated Revenue Fund.

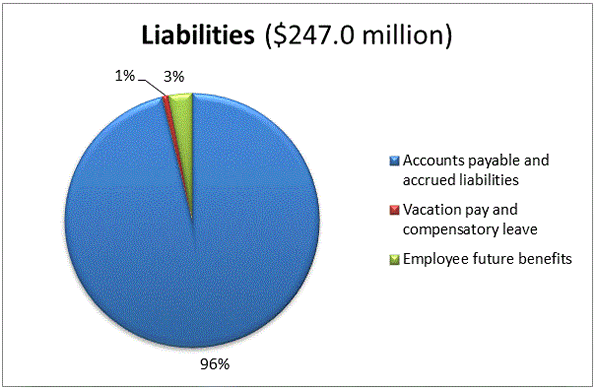
Total Liabilities were $247.0 million at the end of 2010–11, an increase of $51.5 million (26 percent) over the previous year’s total liabilities of $195.5 million. This increase is primarily related to the incremental infrastructure programs, for which WD establishes accounts payable at the end of the fiscal year in anticipation of project claims.

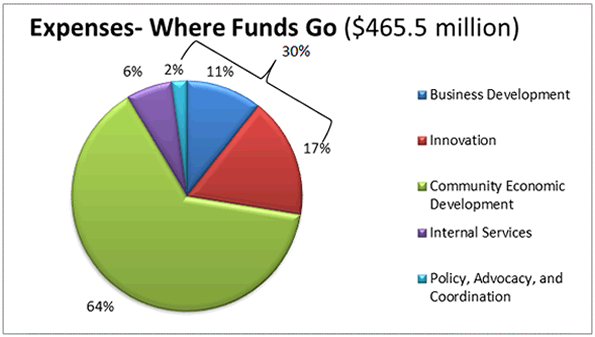
Total Expenses for WD were $464.5 million in 2010–11, an increase of $49.4 million. The increase year over year is attributed to an increase in transfer payments, primarily related to the EAP. Community Economic Development reflects 64 percent of expenses ($296.7 million), most of which can be attributed to the EAP. Thirty percent of total expenses ($137.9 million) contributed towards Business Development; Innovation; and Policy, Advocacy and Coordination. The remaining six percent ($29.9 million) relates to Internal Services.
Financial Statements
Financial statements are prepared on an accrual basis and updated Treasury Board Secretariat accounting policies. WD’s unaudited financial statements can be found on its website.
List of Supplementary Information Tables
All electronic supplementary information tables found in the 2010–11 Departmental Performance Report can be found on the Treasury Board of Canada Secretariat’s website.
- Sources of Respendable and Non-Respendable Revenue
- User Fees Reporting
- Details on Transfer Payment Programs
- Up-Front Multi-Year Funding
- Horizontal Initiatives
- Green Procurement
- Response to Parliamentary Committees and External Audits
- Internal Audits and Evaluations
|
|
Business Development | Innovation | Community Economic Development | Policy, Advocacy and Coordination | TOTAL |
|---|---|---|---|---|---|
| Western Diversification Program | |||||
| Alberta/Saskatchewan Centenaries | – | – | 6,200 | – | 6,200 |
| Community Adjustment Fund* | – | – | 154,906 | – | 154,906 |
| Regina Development Agreement | – | – | 1,332 | – | 1,332 |
| Saskatoon Development Agreement | – | – | 252 | – | 252 |
| Vancouver Development Agreement | – | – | 54 | – | 54 |
| Economic Development Initiative | – | – | 696 | – | 696 |
| Entrepreneurs with Disabilities Program | 1,496 | – | – | – | 1,496 |
| Francophone Economic Development Organizations | 1,079 | – | 1,101 | – | 2,180 |
| Francophone Economic Development | – | – | 31 | – | 31 |
| Mountain Pine Beetle | – | – | 7,234 | – | 7,234 |
| Conference Support Payments | 30 | – | 6 | – | 36 |
| Women's Enterprise Initiative | 4,468 | – | – | – | 4,468 |
| Rick Hansen Foundation | – | 4,500 | – | – | 4,500 |
| Intervac – Western Diversification Program | – | 10,242 | – | – | 10,242 |
| Western Diversification Program | 6,397 | 41,005 | 14,833 | 317 | 62,552 |
| Western Economic Partnership Agreement Round III | 9,902 | 17,523 | 97 | – | 27,522 |
| Winnipeg Partnership Agreement | – | – | – | – | – |
| Total Western Diversification Program | 23,372 | 73,270 | 186,742 | 317 | 283,701 |
| Loan and Investment Program | 1,159 | – | – | – | 1,159 |
| Community Futures – Operating | 14,194 | – | 14,156 | – | 28,350 |
| Community Futures – Capitalization | 20 | – | – | – | 20 |
| Community Futures – Networking Organizations | 437 | – | 438 | – | 875 |
| Total Community Futures Program | 14,651 | – | 14,594 | – | 29,245 |
| Recreational Infrastructure Canada Program* | – | – | 91,086 | – | 91,086 |
| Infrastructure Canada Program | – | – | 167 | – | 167 |
| TOTAL G&C | 39,183 | 73,270 | 292,588 | 317 | 405,358 |
Note: Total differences are due to rounding.
* These programs were components of Canada's Economic Action Plan.
Section IV: Other Items of Interest
Organizational Contact Information
E-mail Address: info@wd-deo.gc.ca
Mailing Address: Suite 1500, 9700 Jasper Avenue, Edmonton, Alberta T5J 4H7
Telephone: 780-495-4164
Toll Free: 1-888-338-WEST (9378)
Teletypewriter (TTY): 1-877-303-3388
Fax: 780-495-4557
Section 41, Official Languages Act
In 2010–11, WD continued to work with other federal departments to deliver EDI, as part of the federal “Roadmap for Canada's Linguistic Duality 2008–2013: Acting for the Future”. For more information about EDI, and WD’s other efforts related to the Official Languages Act, please see: Status Reports on the Implementation of Section 41 of the Official Languages Act.List of Acronyms
- ASC
- Alberta Saskatchewan Centenaries
- ATIC
- Alberta Terrestrial Imaging Centre
- BCF
- Building Canada Fund
- BCF-CC
- Building Canada Fund-Communities Component
- BERD
- Business expenditure on research and development
- CAF
- Community Adjustment Fund
- CBN
- Canada Business Network
- CDEM
- Le Conseil de d�veloppement �conomique des municipalit�s bilingues du Manitoba
- CED
- Community Economic Development
- CEDI
- Community Economic Development Initiative
- CF
- Community Futures
- CSIF
- Canada Strategic Infrastructure Fund
- DES
- Digital Economy Strategy
- DPR
- Departmental Performance Report
- EAP
- Economic Action Plan
- EDI
- Economic Development Initiative
- EDP
- Entrepreneurs with Disabilities Program
- FTE
- Full-time equivalent (jobs)
- FEDO
- Francophone Economic Development Organizations
- G&C
- Grants and contributions
- GDP
- Gross Domestic Product
- GERD
- Gross Domestic Expenditures on Research and Development
- GRAND
- Graphics, Animation and New Media Network of Centres of Excellence
- ICP
- Infrastructure Canada Program
- ICT
- Information and Communications Technologies
- INFC
- Infrastructure Canada
- IP
- Intellectual property
- IRB
- Industrial and Regional Benefits
- LIP
- Loan and Investment Program
- MPB
- Mountain Pine Beetle
- MRIF
- Municipal Rural Infrastructure Fund
- NAIT
- Northern Alberta Institute of Technology
- NAPP
- North American Platform Program
- PAA
- Program Activity Architecture
- R&D
- Research and development
- RInC
- Recreational Infrastructure Canada program
- RPP
- Report on Plans and Priorities
- SME
- Small and medium enterprises
- US
- United States
- WCBSN
- Western Canada Business Service Network
- WD
- Western Economic Diversification Canada
- WDP
- Western Diversification Program
- WEPA
- Western Economic Partnership Agreements
[Footnotes]
[1] Type is defined as follows: Previously committed to—committed to in the first or second fiscal year before the subject year of the report; Ongoing—committed to at least three fiscal years prior to the subject year of the report; and New—newly committed to in the reporting year of the DPR.
[2] Commencing in the 2009–10 Estimates cycle, the resources for Internal Service are displayed separately; they are no longer distributed among the remaining program activities. In 2010–11, an exercise was conducted at the regional level on direct coding of salaries to program activity. The resulting change affects the comparability of spending and FTE information by program activity between fiscal years.
[3] Total Authorities are greater than Planned Spending as new funding was received through Supplementary Estimates. This consists of $19.6 million carry-forward for the Recreational Infrastructure Canada (RInC) program, $14.4 million for Western Diversification Program renewal, $13.5 million carry-forward for Community Adjustment Fund, $4.5 million for Rick Hansen Foundation, $3.6 million for Community Futures, $2.1 million operating carry‑forward, $1.9 million Building Canada Fund operating funding and $1.7 million for various other items.
[4] Actual Spending is lower than Total Authorities, primarily due to the transfer of $14.9 million contractual commitments under RInC to 2011–12 as well as a surplus from unspent EAP operating and contribution funding.
[5] Based upon preliminary data for 2010.
[6] Preliminary data.
[7] Based upon preliminary data for 2010
[8] The GERD figures for 2006 and 2007 reported here are based upon revised Statistics Canada tables, and therefore do not agree with the figures reported in DPR 2009–10.
[9] Bridging the Valley of Death: Lessons Learned From 14 Years of Commercialization of Technology Education, Barr, Barker, Markam & Kingon, September 2009. (http://aomarticles.metapress.com/content/648161621u33x2q1)
[10]Details on the results can be found in INFC’s Departmental Performance Report.
[11] Treasury Board Secretariat now requires WD to record amounts due from the Consolidated Revenue Fund as an asset on the Statement of Financial Position. This change in policy reflects an increase year-over-year in both financial assets and the equity of Canada. Fiscal year 2009–10 has been restated accordingly.
