
Treasury Board of Canada Secretariat
www.tbs-sct.gc.ca
Common menu bar links
Breadcrumb Trail
ARCHIVED - Public Safety Canada - Report
 This page has been archived.
Archived Content
Information identified as archived on the Web is for reference, research or recordkeeping purposes. It has not been altered or updated after the date of archiving. Web pages that are archived on the Web are not subject to the Government of Canada Web Standards. As per the Communications Policy of the Government of Canada, you can request alternate formats on the "Contact Us" page.
Section III: Supplementary Information
Financial Highlights
| % Change | 2010-11 | 2009-10 | |
|---|---|---|---|
| Total assets | 18.1% | 297,125 | 251,687 |
| Total liabilities | 29.4% | 916,574 | 708,120 |
| Equity of Canada | 35.7% | (619,449) | (456,433) |
| Total Liabilities and Equity | 18.1% | 297,125 | 251,687 |
| % Change | 2010-11 | 2009-10 | |
|---|---|---|---|
| Total expenses | 98.0% | 675,386 | 341,080 |
| Total revenues | 24.9% | 110 | 85 |
| Net cost of operations | 98.0% | 675,276 | 340,995 |
Note: The above information is presented in a full cost, accrued basis and does not, therefore, agree with actual spending charged to the appropriations.
The following chart presents the Statement of Operations by showing expenses by category as a percentage of total departmental accrual accounting expenses. Transfer payments represent 74% of the total $675M Department expenses. Major variances with information previously presented on an appropriation/cash basis in this document are attributed to the factoring of accruals in respect of grants and contributions liabilities, capitalization of assets as well as services received without charge [13].
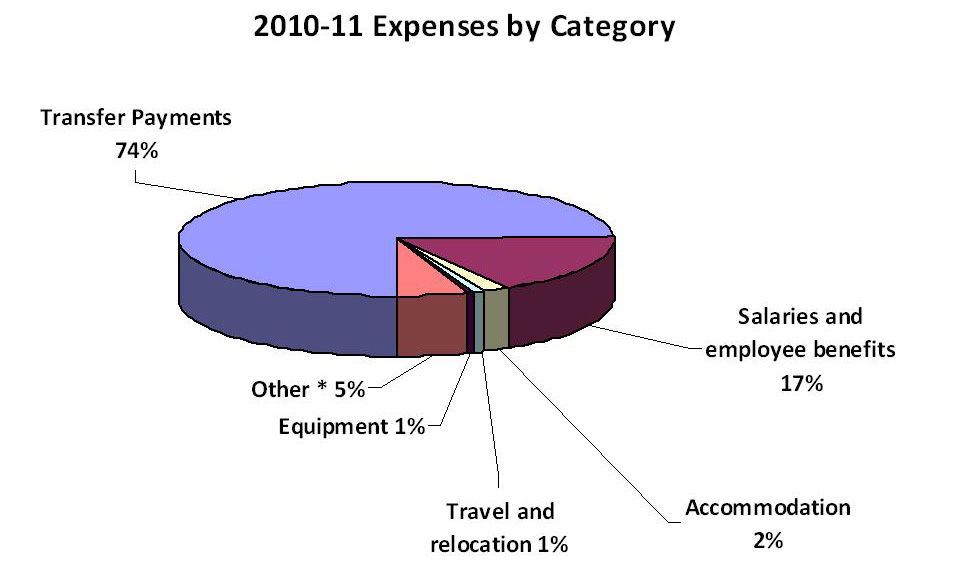
This chart presents the Statement of Operations by showing expenses by category as a percentage of total departmental accrual accounting expenses. Transfer payments represent 74 per cent of the total 675 million dollars of Departmental expenses; salaries and employee benefits 17 per cent; accommodations 2 per cent; travel and relocation 1 per cent; equipment 1 per cent; and other expenses which include communication, amortization, equipment rentals, utilities, material and supplies, information and repairs 5 per cent.
Financial Statements
The 2010-11 Public Safety Canada financial statements.
List of Supplementary Information Tables
All electronic supplementary information tables found in the 2010–11 Departmental Performance Report can be found on the Treasury Board of Canada Secretariat's website.
- Details on Transfer Payment Programs
- Green Procurement
- Horizontal Initiatives
- G8/G20 Horizontal Initiative
- Upcoming Internal Audits
- Evaluations
- Sources of Non-Respendable Revenue
- User Fees
- Status Report on Projects operating with specific Treasury Board Approval
- Response to Parliamentary Committees
Additional Information
As per the Directive on Management of Expenditures on Travel, Hospitality and Conferences, effective January 1, 2011, departments are required to "disclose the total annual expenditures for each of travel, hospitality and conferences for the department, through its website, including a brief description of the main variances from the previous year's actual expenditures. The timing of this disclosure is to coincide with the tabling of the Departmental Performance Report".
More information can be found on Public Safety Canada's website.
Footnotes
[1] We exercise national leadership to ensure the safety and security of Canada and Canadians. We contribute to Canada's resiliency through the development and implementation of innovative policies and programs and the effective engagement of domestic and international partners.
[2] Type is defined as follows:
- Previously committed to
- committed to in the first or second fiscal year before the subject year of the report;
- Ongoing
- committed to at least three fiscal years before the subject year of the report;
- New
- newly committed to in the reporting year of the DPR.
[3] Priority Status Legend as follows:
- Exceeded
- more than 100 per cent of the expected level of performance for the priority identified in the corresponding RPP was achieved during the fiscal year;
- Met All
- 100 per cent of the expected level of performance for the priority identified in the corresponding RPP was achieved during the fiscal year;
- Mostly Met
- 80 to 99 per cent of the expected level of performance for the priority identified in the corresponding RPP was achieved during the fiscal year;
- Somewhat Met
- 60 to 79 per cent of the expected level of performance for the priority identified in the corresponding RPP was achieved during the fiscal year;
- Not Met
- less than 60 per cent of the expected level of performance for the priority identified in the corresponding RPP was achieved during the fiscal year.
[4] The calculation of full-time equivalent (FTE) differs from the actual number of employees in that the former combines part-time employment, term employment, job sharing, etc., to indicate the total aggregate use of the equivalent to a full-time employee. For instance, two-half time employees constitute a single FTE. Figures presented above include Students and Executive Interchange.
[5] The difference of $15.2M between Total Authorities and Actual Spending is due to the following: DFAA ($11.2M) as this funding is provided for specific purposes and the Department is not at liberty to reallocate to other programs, as well as reprofiles of funds to secure the movement of funding from 2010-11 to 2011-12 for the following: Haiti ($1.5M), EM Core ($1.5M) and Urban Transit ($0.7M). Finally, a lapse of $0.3M occurred in the Joint Emergency Preparedness Program.
[6] The 10 critical infrastructure sectors are:
- Energy & Utilities,
- Health,
- Finance,
- Government,
- Food,
- Information & Communication Technology,
- Transportation,
- Water,
- Safety,
- Manufacturing.
[7] The Crimes Stoppers “Blue Blindfold" Campaign, delivered through a partnership between the Canadian Crime Stoppers Association (CCSA), the RCMP Human Trafficking National Coordination Centre (HTNCC) and Public Safety Canada, will serve to inform the public of the prevalence of human trafficking in Canada and how to identify and report suspicious cases.
[8] The difference of $127M between Total Authorities and Actual Spending is primarily due to lower than projected costs for the G8/G20 Summit in June 2010 ($115.8M). As well, $10.4M was lapsed in the First Nations Policing Program as this amount represents additional funding received which was short-term in nature and partners could not commit their proportionate share, as identified in the Transfer Payment Tables attached to this report. Finally, $0.8M was lapsed in Other Operating Expenditures.
[9] The NOMI was an initiative which focused on developing processes to work collaboratively with communities and other federal, provincial or territorial governments involved in community safety or wellness and reducing the administrative burden associated with federal requirements of the grants and contributions process.
[10] Shiprider is a joint law enforcement initiative with the U.S. and aims to tackle organized criminal activity, such as smuggling, drug crime and gun trade, on shared waters at the Canada-U.S. border.
[11] A bill was introduced in Parliament in November 2009 and again in October 2010. In both instances, the legislative process was terminated when Parliament was either prorogued or dissolved.
[12] The increase in Actual compared to Planned FTEs is mainly attributable to an internal realignment of resources to address critical shortfalls in the Department's Internal Services. In addition to the standard services, Internal Services also provides coordination and support for the Portfolio. Funding received for the implementation of Canada's Cyber Security Strategy and funding to manage immigration cases involving classified information under Division 9 of the Immigration and Refugee Protection Act (Security Certificate) also contributed to the increase in FTEs from the initially planned figure.
[13] *Other expenses consist of communication, amortization, equipment rentals, utilities, material and supplies, information and repairs.