
Treasury Board of Canada Secretariat
www.tbs-sct.gc.ca
Common menu bar links
Breadcrumb Trail
ARCHIVED - Economic Development Agency of Canada for the Regions of Quebec - Report
 This page has been archived.
Archived Content
Information identified as archived on the Web is for reference, research or recordkeeping purposes. It has not been altered or updated after the date of archiving. Web pages that are archived on the Web are not subject to the Government of Canada Web Standards. As per the Communications Policy of the Government of Canada, you can request alternate formats on the "Contact Us" page.
3 Supplementary Information
3.1 Financial highlights
The financial highlights presented in this report are intended to provide an overview of the Agency’s operations and financial situation. The unaudited financial statements are prepared in accordance with accrual accounting principles.
The actual expenditures presented in the preceding tables were prepared on a cash basis, while the financial highlights that follow were prepared on an accrual basis. Tables reconciling these two accounting methods are presented in the Notes to the Agency’s Financial Statements (Note 3).
Summary financial information as at March 31, 2011
| Percentage variance | 2010-2011 | 2009-2010 (Restated) | |
|---|---|---|---|
| Total assets | 73% | 437,676 | 252,569 |
| Total liabilities | 158% | 229,041 | 88,802 |
| Equity of Canada | 27% | 208,635 | 163,767 |
| 73% | 437,676 | 252,569 |
| Percentage variance | 2010-2011 | 2009-2010 (Restated) | |
|---|---|---|---|
| Total expenditures | 17% | 403,814 | 346,605 |
| Total revenues | (22%) | 700 | 895 |
| Net operating cost | 17% | 403,114 | 345,710 |
3.2 Financial highlights charts/graphs
For the period ending March 31, 2011
3.2.1 Assets
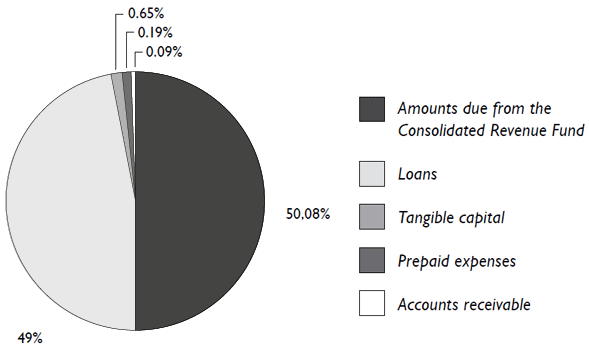
- As of March 31, 2011, assets stood at $437.7 million, up 73% from the previous year.
- Amounts due from the Consolidated Revenue Fund (CRF) and loans constitute the largest components of Agency assets, representing 50% and 49%, respectively, or $219.2 million for loans and $214.5 million in amounts due from the CRF. This increase is attributable to the increase in loans issued and the increase in amounts due from the CRF from accounts payable at year-end for which the Agency will be receiving funds in another fiscal year.
- Accounts receivable represented 0.1%, prepaid expenses 0.2% and tangible capital assets 0.7% of total assets.
- During 2010-2011, the Agency adopted the revised Treasury Board accounting policy TBAS 1.2: Departmental and Agency Financial Statements. Under this policy, the Agency is required to record amounts due from the Consolidated Revenue Fund as an asset on the Statement of Financial Position. With a view to complying with this policy, amounts due for 2009-2010 were also restated so as to facilitate comparison of data from one year to the next.
3.2.2 Liabilities
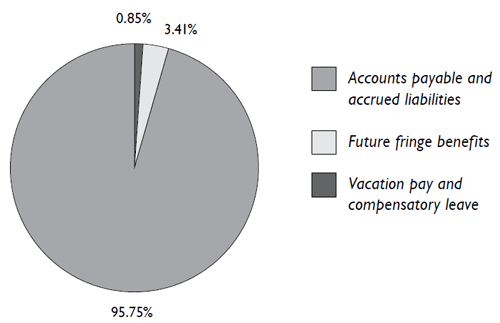
- Total liabilities amounted to $229 million at the close of 2010-2011, up 158% from 2009-2010. The increase is largely attributable to accounts payable at year-end, which rose by 173%, from $80.3 million in 2009-2010 to $219.3 million in 2010-2011. This increase stems from the marked rise in accounts payable under agreements with Infrastructure Canada, for which the Agency administers and delivers programs.
- Accounts payable and accrued liabilities accounted for the majority (95.8%) of liabilities, at $219.3 million.
- Vacation pay and compensatory leave stood at $1.9 million, and fringe benefits at $7.8 million.
3.2.3 Revenues
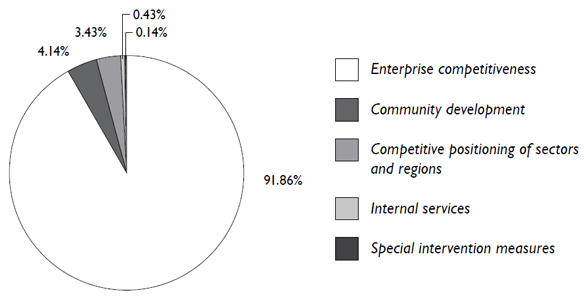
- Total revenues amounted to $700,000 in 2010-2011, down $195,000 dollars (22%) compared with the previous year.
- Agency revenues come mainly from interest collected and fees within the framework of transfer payments, which vary from year to year. Of revenues, 91.9% come under the Enterprise Competitivess program activity.
3.2.4 Expenses
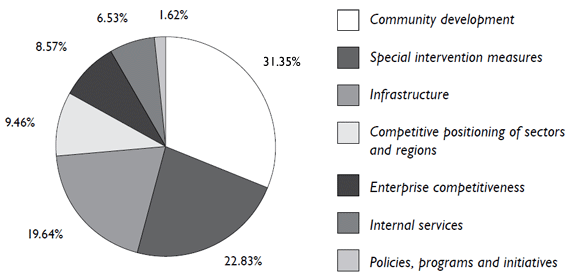
- Total expenses amounted to $403.8 million in 2010-2011, up $57.2 million (17%) compared with the previous year.
- Expenses consist primarily of non-repayable and conditionally repayable contributions (totalling $310.6 million). The majority of funds ($126.7 million) were used for development of Canada’s communities.
- The remaining funds broke down as follows:
- Special intervention measures: $92.3 million
- Infrastructure: $79.4 million
- Competitive positioning of sectors and regions: $38.2 million
- Enterprise competitiveness (SMEs): $34.6 million
- Internal services: $26.2 million
- Policies, programs and initiatives: $6.5 million
- Operating expenses rose by $1.6 million compared with 2009-2010. This increase is primarily attributable to a variation in salary expenses.
3.3 Financial statements
The Agency’s unaudited financial statements for the year ended March 31, 2011 and the appendix containing the statement of management responsibility are available on the Agency’s Web site.
3.4 Supplementary information tables
Electronic versions of all additional information tables featured in the DPR for 2010-2011 are available on the Treasury Board of Canada Secretariat Web site.
Table: Sources of Non-respendable Revenue
The table illustrates revenue and provides a historical perspective. Revenue consists primarily of repayments of the repayable contributions awarded by the Agency.
Table: User Fees
The table presents user fee revenue and costs.
Table: Details of Transfer Payment Programs (TPPs)
The table illustrates the results of TPPs in relation to commitments and planned results as set out in the 2010-2011 RPP where the amount of the transfer exceeds $5 million.
Table: Green Procurement
The table summarizes the initiatives and results attained by the Agency with respect to the integration of environmental performance considerations in procurement decision-making processes. Green procurement goals and results attained are also presented.
Table: Response to Parliamentary Committees and to External Audits
The table lists responses given to Parliamentary Committee reports, Auditor General of Canada reports and external audits concerning Agency activities in 2010-2011.
Table: Internal Audits and Evaluations
The table lists internal audit and evaluation reports.
4 Other Items of Interest
List of appendices
The appendices may be consulted on the Agency’s Web site.
Appendix 1: Agency performance measurement methodology
Appendix 2: Technical notes on performance data and performance status rating
4.1 Contact information for the Agency resource-person
Marie Lemieux
Director General
Departmental Performance Branch
Economy Development Agency of Canada for the Regions of Quebec
Dominion Square Building
1255 Peel Street, Suite 900
Montreal, Quebec H3B 2T9
Telephone: 514-496-2482
Fax: 514-283-8080
Email: marie.lemieux@dec-ced.gc.ca
Notes:
1 These are the two main CEAP initiatives implemented by the Agency. Under CEAP, the Agency has also implemented the following initiatives: the Contribution program to supply the Municipality of Shannon with drinking water, the Business Canada Network and Université Laval’s Pavillon de l’éducation physique et des sports (sports and physical education facility).
2 In 2010-2011, the Special infrastructure-dedicated programs subactivity comprised CEAP-related measures. These included RInC and the Contribution program to supply the Municipality of Shannon with drinking water.
3 In 2010-2011, the CAF came under the Community adjustment to economic shocks program subactivity.
4 In this Departmental Performance Report (DPR), a performance index is associated with each priority and with each performance indicator linked to program activities. The performance rating, defined by the Treasury Board of Canada Secretariat, consists of the following levels: Exceeded expectations; Met all expectations; Mostly met expectations; Somewhat met expectations; and Not met expectations. The definitions are presented in Appendix 2 of the DPR.
5 These risks are associated with attainment of the results of PAA program activities.
6 This is based on performance information available in 2010-2011. Thus, the leverage effect is calculated on the basis of projects in progress in 2010-2011, that is, projects for which an expenditure was made during the year. As to data on SMEs’ survival rate and sales, since these are results observable after projects are completed, they are calculated on the basis of projects supported by the Agency between 2002 and 2008, under the old IDEA-SME program and the Business and Regional Growth program.
7 The leverage effect presented in this Report, as calculated by the Agency, compares financial assistance approved by the Agency with funding from the promoter and other funding sources. The leverage effect excludes funding associated with CEAP and the Infrastructure program activity.
8 The data presented on enterprises’ survival rate and sales come from the study: Agence de développement économique du Canada pour les régions du Québec, Étude d’impact économique (Economic impact study) 2002-2008, Statistics Canada, May 2011.
9 Main Estimates are tabled in Parliament prior to the start of the fiscal year. Planned spending comprises the Main Estimates as well as additional authorities at the time of publication of the Report on Plans and Priorities. Total authorities therefore represent Main Estimates plus Supplementary Estimates for the year ending March 31, 2011. The Agency’s total actual expenditures correspond to actual expenditures as indicated in the Public Accounts.
10 Parliamentary authorities are awarded by global votes. So authorities by program activity are estimates, and are presented as a guide only.
11 Since the 2009-2010 Estimates cycle, resources allocated to the Internal services program activity have been shown separately from those for other program activities, and are no longer broken down among other program activities, as was the case in previous Main Estimates. This measure has an impact on the comparability of expenditures and information concerning FTEs for each program activity between different fiscal years.
12 A sum of $35 million from the authority received for RInC was converted in order to set up the TISQFE. This new measure, which is not part of CEAP, was launched on June 17, 2010 to strengthen and increase economic activity in forest communities in order to create and maintain employment there, paying special attention to SMEs established in those communities. In all, $22.8 million was spent in 2010-2011 for this initiative, which will be in effect until March 31, 2013. This amount is included in total actual CEAP expenditures for 2010-2011, in view of the funding source.
13 Expenditures associated with the CAF are included in expenditures for the Special intervention measures program activity.
14 Expenditures associated with RInC and the Contribution program to supply the Municipality of Shannon with drinking water are included in expenditures for the Infrastructure program activity.
15 Info Entrepreneurs Web site
16 Ressources Entreprises Web site
17 Public Accounts of Canada 2010
18 The formative evaluation report on the Community Diversification and Business and Regional Growth programs is available on the Agency’s Web site.
19 Parliamentary authorities are awarded by global votes. So authorities by program activity are estimates, and are presented as a guide only.
20 CFP performance targets are not included.
21 In this DPR, a performance index is associated with each priority and with each performance indicator linked to program activities. The performance rating is defined by the Treasury Board of Canada Secretariat and consists of the following levels: Exceeded expectations; Met all expectations; Mostly met expectations; Somewhat met expectations; and Not met expectations. The definitions are presented in Appendix 2 of the DPR.
22 The total value of projects includes financial assistance awarded, on a multiyear basis, by the Agency and other partners, as well as other funding sources.
23 This is an example of a project used in the case studies conducted for the summative evaluation of the Community Diversification program. The evaluation report will be completed in 2011-2012.
24 Temporary Initiative for the Strengthening of Quebec’s Forest Economies
25 Linguistic Duality Economic Development Initiative
26 These are 2010-2011 financial resources for the entire Infrastructure program activity, and therefore include financial resources for RInC and the Shannon program.
27 Parliamentary authorities are awarded by global votes. So authorities by program activity are estimates, and are presented as a guide only.
28 Parliamentary authorities are awarded by global votes. So authorities by program activity are estimates, and are presented as a guide only.
29 This table contains information relating solely to CEAP.
30 In the RPP 2010-11, RInC-related performance targets were established on the basis of the results expected at the end of the RInC program, initially scheduled for March 2011. As RInC was extended to October 31, 2011, the results presented in this Report constitute preliminary results for RInC since they are the results attained as at March 31, 2011. The results obtained met expectations, and show that the targets are in the process of being met.
31 Parliamentary authorities are awarded by global votes. So authorities by program activity are estimates, and are presented as a guide only.
32 This table contains information relating solely to CEAP.
33 As RInC will be continuing until October 31, 2011, it is possible that the amount of financial contributions and end-of-program results may vary from what is reported in this DPR. A summary of RInC presenting the program’s final performance status may be presented in the DPR 2011-2012.
34 Refer to the Infrastructure Canada Web site.
35 Parliamentary authorities are awarded by global votes. So authorities by program activity are estimates, and are presented as a guide only.
36 This table contains information referring solely to CEAP.
37 Under CEAP, employment data are calculated by the Department of Finance Canada.
38 Since no target was established in the RPP 2010-11 for the performance of the Community Adjustment Fund, the performance status cannot be rated.
39 These data are taken from Canada’s Economic Action Plan, Year 2, Built to keep our economy growing: A Seventh Report to Canadians, January 2011. There are no employment data specifically for the CAF and for each province.
40 Parliamentary authorities are awarded by global votes. So authorities by program activity are estimates, and are presented as a guide only.
41 This is an example of a project used in case studies conducted for the summative evaluation of the Business and Regional Growth program. The evaluation report will be completed in 2011-2012.
42 Parliamentary authorities are awarded by global votes. So authorities by program activity are estimates, and are presented as a guide only.
43 When the targets for 2010-2011 were established, two projects each generating an average of 100 technology transfers per year were not taken into consideration. This partly explains the variance between the target and the result obtained.
44 This is an example of a project used in case studies conducted for the summative evaluation of the Business and Regional Growth program. The evaluation report will be completed in 2011-2012.
45 The study Attractiveness Indicators 2010-2011 – Greater Montreal is available at the Montreal International Web site.
46 SECOR Conseil, Les retombées économiques associées aux activités des organisations internationales – une réactualisation pour l’an 2007 (Economic spinoffs associated with international organizations: update for 2007), submitted to Montreal International, February 2009.
47 Parliamentary authorities are awarded by global votes. So authorities by program activity are estimates, and are presented as a guide only.
48 Available at The Conference Board of Canada Web site
49 Available at the Quebec Metropolis Centre - Immigration and Metropolis (QMC-IM) Web site
50 Available at Smart Practices Innovation Network
51 Minutes of these meetings are available at the Regional development roundtables.
52 You are an international cruise industry development project promoter?
53 Parliamentary authorities are awarded by global votes. So authorities by program activity are estimates, and are presented as a guide only.
54 Parliamentary authorities are awarded by global votes. So authorities by program activity are estimates, and are presented as a guide only.
55 Parliamentary authorities are awarded by global votes. So authorities by program activity are estimates, and are presented as a guide only.