Common menu bar links
Breadcrumb Trail
ARCHIVED - Financial Transactions and Reports Analysis Centre of Canada - Report
 This page has been archived.
Archived Content
Information identified as archived on the Web is for reference, research or recordkeeping purposes. It has not been altered or updated after the date of archiving. Web pages that are archived on the Web are not subject to the Government of Canada Web Standards. As per the Communications Policy of the Government of Canada, you can request alternate formats on the "Contact Us" page.
Section III: Supplementary Information
Financial Highlights
($ Thousands)
| Condensed Statement of Financial Position At end of Fiscal Year (March 31, 2011) |
% Change | 2010-11 | 2009-10 |
|---|---|---|---|
| ASSETS | |||
| Accounts Receivables and Advances2 | 339.87% | 1,368 | 311 |
| Prepaid Expenses3 | 78.75% | 976 | 546 |
| Tangible Capital Assets | -13.61% | 14,621 | 16,924 |
| Amount due from the Consolidated Revenue Fund | 11.74% | 4,159 | 3,722 |
| Total Assets | -1.76% | 21,124 | 21,503 |
| TOTAL | -1.76% | 21,124 | 21,503 |
| LIABILITIES | |||
| Accounts Payables and accrued liabilities | 9.25% | 4,369 | 3,999 |
| Vacation pay and compensatory leave | 15.28% | 1,147 | 995 |
| Employee severance benefits | -2.27% | 6,126 | 6,268 |
| Total Liabilities | 3.37% | 11,643 | 11,263 |
| EQUITY | -7.40% | 9,482 | 10,240 |
| Total Equity | -7.40% | 9,482 | 10,240 |
| TOTAL | -1.76% | 21,124 | 21,503 |
($ Thousands)
| Condensed Statement of Financial Operation At end of Fiscal Year (March 31, 2011) |
% Change | 2010-11 | 2009-10 |
|---|---|---|---|
| EXPENSES | |||
| Contribution4 | -42.86% | 800 | 1,400 |
| Operating Expenses | 2.72% | 54,358 | 52,919 |
| Total Expenses | 1.54% | 55,158 | 54,319 |
| REVENUES | |||
| Revenues not available for spending5 | -48.31% | 92 | 178 |
| Total Revenues | -48.31% | 92 | 178 |
| NET COST OF OPERATIONS | 1.71% | 55,066 | 54,141 |
Financial Highlights Charts/Graphs
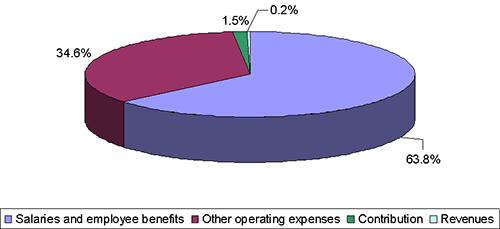
2010-2011 Net Cost of Operations

View the text equivalent for 2010-2011 Net Cost of Operations
The net cost of operations for fiscal year 2010-11 was $55.0M, an increase of 1.5% over the previous year's net cost of operation of $54.1M. Salaries and employee benefits, in the amount of $35.2M, represent the largest portion with 63.8% of the total cost. Other operating expenses, in the amount of $19.1M detailed in the chart entitled "2010-11 Operating Expenses (excluding salaries and employee benefits)" on the following page, represent 34.6% of the total cost. The Contribution for the establishment of the Egmont Group Secretariat totalling $0.8M in 2010-11, represents 1.5% of the net cost of operations. Finally, Revenues not available for spending in the amount of $91,786 represents a minimal percentage of total net cost of operations.
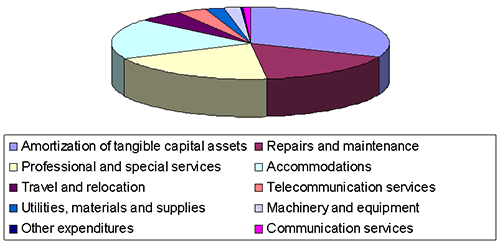
2010-2011 Operating Expenses
(excluding salaries and employee benefits)

View the text equivalent for Operating Expenses excluding salaries and employee benefits
Operating expenses, excluding salaries and employee benefits, totalled $19.1M in fiscal year 2010-2011. The largest share of expenses were the amortization of tangible capital assets ($6.0M), professional and special services ($3.8M), accommodations ($3.5M), and repair and maintenance ($3.2M). Other significant costs were travel and relocation, telecommunication services, utilities, material and supplies, machinery and equipment, communication services and other expenditures.
Financial Statements
http://www.fintrac-canafe.gc.ca/publications/reports-rapports-eng.asp#s4
List of Supplementary Information Tables
All electronic supplementary information tables found in the 2010–11 Departmental Performance Report can be found on the Treasury Board of Canada Secretariat's Web site.
- Sources of Respendable and Non-Respendable Revenue
- Horizontal Initiatives
- Response to Parliamentary Committees and External Audits
- Internal Audits and Evaluations
Section IV: Other Items of Interest
Organizational Contact Information
Mail
FINTRAC
24th floor, 234 Laurier Avenue West
Ottawa, ON
K1P 1H7
CANADA
Email
guidelines-lignesdirectrices@fintrac-canafe.gc.ca
Telephone
1-866-346-8722 (toll free)
Facsimile
613-943-7931
1. Budget 2010 committed $8 million in on-going funding to FINTRAC to enhance the organization's ability to ensure compliance with the PCMLTFA, as well as additional capacity to meet responsibilities related to tax evasion becoming a predicate offence to money laundering. In order to effectively manage these funds, FINTRAC sought a funding profile wherein $4.5M was moved to future years; therefore, the organization will be receiving $3.5 million, rather than $8 million, in 2011-12.
2. The increase in accounts receivable is due to outstanding GST refundable amounts from Canada Revenue Agency (CRA).
3. The increase in prepaid expenses is due to purchases at year-end for assets with associated maintenance expenses. (In 2010-11, the cost of maintenance expenses also increased.)
4. The decrease in contribution expenses reflects the decline in funding requirements for the set-up and initial operations of a permanent Secretariat for the Egmont Group of Financial Intelligence Units (FIUs). FINTRAC's contributions to the Egmont Group sunsetted at the end of fiscal year 2010-11.
5. The decrease in revenues not available for spending is due to Administrative Monetary Penalties (AMPs) that have been issued, but have been requested to be reviewed or appealed to the Federal Court.
