
Treasury Board of Canada Secretariat
www.tbs-sct.gc.ca
Common menu bar links
Breadcrumb Trail
ARCHIVED - Western Economic Diversification Canada - Report
 This page has been archived.
Archived Content
Information identified as archived on the Web is for reference, research or recordkeeping purposes. It has not been altered or updated after the date of archiving. Web pages that are archived on the Web are not subject to the Government of Canada Web Standards. As per the Communications Policy of the Government of Canada, you can request alternate formats on the "Contact Us" page.
Section III: Supplementary Information
Financial Highlights
The financial highlights presented within this Departmental Performance Report (DPR) are intended to serve as a general overview of Western Economic Diversification Canada’s (WD) financial position and operations. WD’s financial statements can be found on its website at: http://www.wd-deo.gc.ca/eng/12246.asp.
| Condensed Statement of Financial Position At end of Fiscal Year (March 31, 2010) |
% Change | 2008–09 | 2009–10 |
|---|---|---|---|
| Assets | |||
| Total Assets | 58% | 22,137 | 35,082 |
| Total | 58% | 22,137 | 35,082 |
| Liabilities | |||
| Total Liabilities | 70% | 114,683 | 195,522 |
| Equity | |||
| Total Equity | 73% | (92,546) | (160,440) |
| Total | 58% | 22,137 | 35,082 |
| Condensed Statement of Financial Operations At end of Fiscal Year (March 31, 2010) |
% Change | 2008–09 | 2009–10 |
|---|---|---|---|
| Expenses | |||
| Total Expenses | 72% | 242,539 | 416,178 |
| Revenues | |||
| Total Revenues | 144% | 1,569 | 3,824 |
| Net Cost of Operations | 71% | 240,970 | 412,354 |
Total Assets were $35.08M at the end of 2009-2010, an increase of $12.95M (58 per cent) over the previous year’s total assets of $22.14M. Repayable contributions and prepayments (Loan and Investment Program) represent the largest portion of assets at $31.77M or 90 per cent of total assets.
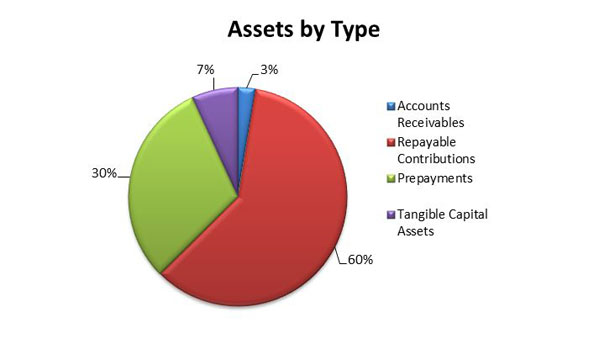
Figure 3
Total Liabilities were $195.52M at the end of 2009-2010, an increase of $80.84M (70 per cent) over the previous year’s total liabilities of $114.68M. Transfer payments represent the largest portion of liabilities at $179.95M or 92 per cent of total liabilities.
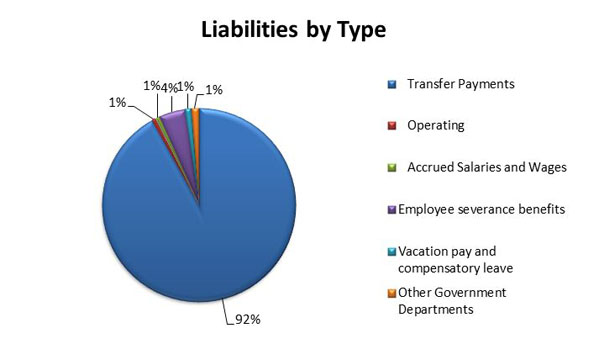
Figure 4
Total Expenses for WD were $416.18M in 2009-2010. The majority of these funds, $241.01M or 58 per cent, were spent in contributing towards the Community Economic Development strategic outcome. Thirty-seven per cent of total expenses ($155.50M ) contributed towards the Entrepreneurship and Innovation strategic outcome.
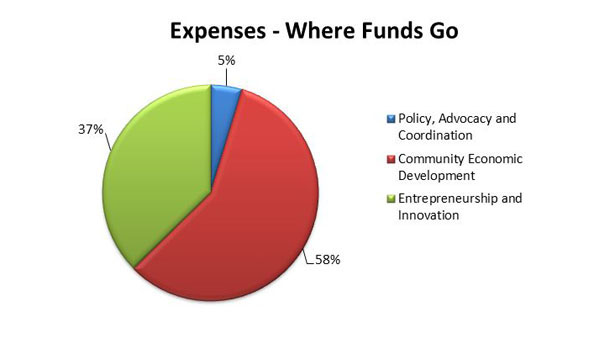
Figure 5
List of Supplementary Information Tables
All electronic supplementary information tables found in the 2009-2010 DPR can be found on the Treasury Board of Canada Secretariat’s website at: http://www.tbs-sct.gc.ca/dpr-rmr/st-ts-eng.asp.
Sources of Respendable and Non-Respendable Revenue
User Fees/External Fees
Details on Transfer Payment Programs (TPPs)
Up-Front Multi-Year Funding (formerly Foundations (Conditional Grants))
Horizontal Initiatives
Green Procurement
Response to Parliamentary Committees and External Audits
Internal Audits and Evaluations
| 2009-2010 (000s) |
Collaboration and Coordination | Research and Analysis | Advocacy | Community Economic Planning, Development and Adjustment | Infrastructure | Business Development and Entrepreneurship | Innovation | TOTAL |
|---|---|---|---|---|---|---|---|---|
| Western Diversification Program | ||||||||
| Alberta / Sask Centenaries | - | - | - | 41 | - | - | - | 41 |
| Community Adjustment Fund* | - | - | - | 133,437 | - | - | - | 133,437 |
| Regina Development Agreement | - | - | - | 1,747 | - | - | - | 1,747 |
| Saskatoon Development Agreement | - | - | - | 157 | - | - | - | 157 |
| Vancouver Development Agreement | - | - | - | 674 | - | - | - | 674 |
| Economic Development initiative | - | - | - | 145 | - | - | - | 145 |
| Entrepreneurs with Disabilities Program | - | - | - | - | - | 1,493 | - | 1,493 |
| Francophone Economic Development Organizations | - | - | - | 1,072 | - | 1,071 | - | 2,143 |
| Francophone Economic Development | - | - | - | 23 | - | - | - | 23 |
| Mountain Pine Beetle-Airport Improvements Initiative | - | - | - | 2,211 | - | - | - | 2,211 |
| Mountain Pine Beetle | - | - | - | 18,816 | - | - | - | 18,816 |
| Conference Support Payments | - | - | - | 20 | - | 88 | - | 108 |
| Urban Aboriginal Strategy | - | - | - | - | - | - | 277 | 277 |
| Women's Enterprise Initiative | - | - | - | - | - | 3,905 | - | 3,905 |
| Intervac/VIDO | - | - | - | - | - | - | 20,855 | 20,855 |
| Western Diversification Program | 173 | 196 | - | 10,701 | - | 9,554 | 43,625 | 64,249 |
| Women's Enterprise Initiative Loan Funding | - | - | - | - | - | 700 | - | 700 |
| Western Economic Partnership Agreement | - | - | - | 3,137 | - | 534 | 2,376 | 6,047 |
| Western Economic Partnership Agreement Round III | - | - | - | 400 | - | 4,114 | 13,967 | 18,481 |
| Winnipeg Partnership Agreement | - | - | - | 1,135 | - | - | 1,587 | 2,722 |
| TOTAL Western Diversification Program | 173 | 196 | - | 173,716 | - | 21,459 | 82,687 | 278,231 |
| Loan Investment Program | - | - | - | - | - | 2,446 | - | 2,446 |
| Community Futures - Operating | - | - | - | 13,912 | - | 13,698 | - | 27,610 |
| Community Futures - Capitalization | - | - | - | - | - | 3,500 | - | 3,500 |
| Community Futures - Networking Organizations | - | - | - | 242 | - | 602 | - | 844 |
| Total Community Futures Program | - | - | - | 14,154 | - | 17,800 | - | 31,954 |
| Recreational Infrastructure Canada Program* | - | - | - | - | 43,228 | - | - | 43,228 |
| Infrastructure Canada Program | - | - | - | - | 3,725 | - | - | 3,725 |
| TOTAL G&C | 173 | 196 | - | 187,870 | 46,953 | 41,705 | 82,687 | 359,584 |
Note - Totals may not add due to rounding
* These programs were components of Canada's Economic Action Plan.
| Business Development and Entrepreneurship | ||||
|---|---|---|---|---|
| Sub-Activity | Goal | Performance Indicator | Number of Projects Reporting | Outcome Reported |
|
1.1.1 Improved Business Productivity |
Increase in SME competitiveness and productivity | % of client satisfaction with business services provided through funded projects | 27 | 72.80% |
| Number of jobs created or maintained | 17 | 504 | ||
| Increase in sales | 1 | $50,000 | ||
| Number of businesses created/maintained/expanded | 32 | 2977 | ||
|
1.1.2 Market/Trade Development |
Increased participation in international markets | Number of industry association partnerships created | 6 | 44 |
| Number of companies participating in export and market development initiatives | 22 | 2951 | ||
| Number of projects promoting participation in major international events | 7 | 23 | ||
| Dollars in trade financing | 1 | 0 | ||
| Number of export-ready companies | 3 | 707 | ||
|
1.1.3 Industry Collaboration |
Increase in number of successful partnerships and strategic alliances | Participant satisfaction | 2 | 80% |
| Number of partnerships/strategic alliances | 16 | 118 | ||
|
1.1.4 Foreign Direct Investment |
Increase in foreign investment in Western Canada | Dollars in direct investment facilitated by WD | 1 | S1,000,000 |
|
1.1.5 Access To Capital |
Increased investment to targeted western Canadian firms | Capital funds provided | 1 | $250,000 |
| Dollars leveraged | 4 | $3,375,221 | ||
| Number of businesses created/maintained/expanded | 5 | 43 | ||
| Innovation | ||||
| Sub-Activity | Goal | Performance Indicator | Number of Projects Reporting | Outcome Reported |
|
1.2.1 TechnologyAdoption and Commercialization |
Increase in the number of technologies developed in research institutions with commercialization potential and increase in the number of technologies adopted by existing firms | Number of patents files/issued | 7 | 36 |
| Number of technology demonstrations | 17 | 222 | ||
| Number of technologies adopted | 9 | 21 | ||
| Number of licenses executed | 4 | 10 | ||
| Number of spin-off companies formed | 5 | 19 | ||
| Number of prototypes developed | 13 | 59 | ||
| Number of technologies to market | 9 | 53 | ||
| Venture capital $ invested | 3 | $11,000,000 | ||
|
1.2.2 Technology Linkages |
Increased connections and synergies among innovation system members | Number of partnerships/networks formed | 14 | 138 |
| Number of attendees at funded conferences | 18 | 60,660 | ||
| Number of new or incremental members of innovation associations | 10 | 159 | ||
|
1.2.3 Technology Research and Development |
Applied R&D leading to technologies with commercialization potential | Number of products or processes that are identified for further R&D | 7 | 80 |
| Number of publications in recognized science journals | 4 | 48 | ||
| Number of skilled personnel | 5 | 112 | ||
| Number of demonstrations of viability of technology | 8 | 27 | ||
| Number of patents filed/issued | 3 | 5 | ||
|
1.2.4 Community Innovation |
Increased technological capacity in a community | Number of community planning studies that focus on building innovation capacity | 6 | 5 |
| Number of individuals with enhanced skills | 9 | 3116 | ||
| Number of people trained | 1 | 210 | ||
| Number of technology demonstrations | 1 | 1 | ||
| Number of training courses | 1 | 27 | ||
| Dollars invested in knowledge infrastructure or technology communication facilities | 1 | $447,400 | ||
| Number of skilled personnel engaged in R&D through funded projects | 8 | 3078 | ||
|
1.2.5 Technology Skills Development |
Increase in training, education, and skills building of highly qualified people | Number of people trained through training events | 5 | 768 |
| Number of studies | 3 | 11 | ||
| Number of individuals with enhanced skills | 1 | 132 | ||
|
1.2.6 Knowledge Infrastructure |
Increase in physical assets for R&D or training | Number of square meters dedicated to R&D and skills training | 8 | 6655 |
| Value of R&D undertaken for a 3-year period following completion of the new facility or equipment set-up | 7 | $8,181,898 | ||
| Number of physical assets (buildings and equipment) | 31 | 96 | ||
|
Community Economic Planning Development and Adjustment |
||||
| Sub-Activity | Goal | Performance Indicator | Number of Projects Reporting | Outcome Reported |
|
2.1.1 Community Planning |
Enhanced community planning | Number of activities providing planning leadership and expertise | 25 | 145 |
| Number of instances facilitating community involvement | 18 | 281 | ||
| Number of partnerships developed/maintained | 15 | 207 | ||
|
2.1.2 Community Development |
Increased viability and diversification of local economies | Number of instances of increased capacity in community organizations | 49 | 1214 |
| Number of enhanced community services or facilities | 71 | 252 | ||
| Number of instances of increased community stability | 87 | 141 | ||
| Number of people trained | 50 | 3337 | ||
| Number of jobs created or maintained | 24 | 821 | ||
| Number of activities producing planning leadership and expertise | 1 | 1 | ||
| Number of public private partnerships | 2 | 5 | ||
| Number of enhanced community services or facilities | 71 | 252 | ||
| Number of participants trained | 3 | 143 | ||
| Number of training courses developed | 1 | 9 | ||
| Client satisfaction | 1 | 96% | ||
| Number of businesses created/maintain/expanded | 17 | 686 | ||
|
2.1.3 Community Economic Adjustment |
Successful community adjustment to mitigate economic crises | Number of public private partnerships | 12 | 24 |
| Number of person months of employment created or maintained | 201 | 9136 | ||
| Number of training courses developed | 3 | 5 | ||
| Number of businesses created/maintained/expanded | 21 | 532 | ||
| Number of participants trained | 13 | 345 | ||
|
Policy, Advocacy and Coordination |
||||
| Program Activity | Goal | Performance Indicator | Number of Projects Reporting | Outcome Reported |
| Collaboration and Coordination | Better coordinated economic development activities and programs in the West | Improvement in geographic or target group program coverage | 1 | 0 |
| Number of coordinated services offered | 1 | 1 | ||
| Advocacy | An improved understanding and awareness of western issues by federal policy makers and increased access to and participation in federal programs by the region | Number of western priorities accounted for in federal trade and investment policies | 2 | 6 |
| Research and Analysis | An enhanced dialogue around and understanding of western issues, challenges, opportunities and priorities | Number of opinion editorials based on WD sponsored research | 4 | 59 |
| Number of program or policy decisions influenced by WD research | 5 | 4 | ||
| Number of spokesperson and media references to reports | 7 | 112 | ||
Table 2b: Cumulative Impact of Infrastructure Canada Program by Sub-Activity[11]
| Infrastructure Canada Program (cumulative outcomes) | |||
|---|---|---|---|
| Sub-Activity | Goal | Performance Indicator | Outcome Reported |
|
2.2.1 Green Infrastructure |
Improved green infrastructure | Increase in number of households with improved potable water quality | 630,600 |
| Increase in number of households with improved wastewater treatment (includes new connections to wastewater systems) | 291,438 | ||
| Increased composting and recycling of solid waste (number of metric tonnes per annum) | 41,756 | ||
| Improved energy efficiency of municipal buildings resulting in a reduction in electricity used (kWh per cubic meter) | 4,325,876 | ||
| Improved energy efficiency of municipal buildings resulting in a reduction in heating fuel used (BTU per cubic meter) | 1,879,312 | ||
|
2.2.2 Local Transportation Infrastructure |
Better local transportation | Number of road and local transportation infrastructure improvements | 277 |
| Number of communities benefiting from safer roads and new or improved public transportation (sum of unique provinicial electoral districts impacted)[12] | 338 | ||
|
2.2.3 Other Infrastructure Priorities |
Improved infrastructure such as recreation facilities, tourism, and rural telecommunications | Number of visits to cultural and recreation facilities improved through funded projects[13] | 8,442,492 |
| Number of new tourism infrastructure | 14 | ||
| Number of communities benefiting from cultural, recreation, and tourism facilities (sum of unique provinicial electoral districts impacted)[14] | 329 | ||
| Increase in number of affordable house units | 270 | ||
| Increase in number of high-speed Internet access for local public institutions | 174 | ||
Other Items of Interest
In 2009-2010, WD continued to work with other federal departments to deliver the Economic Development Initiative (EDI), as part of the federal Road Map for Canada's Linguistic Duality 2008-2013: Acting for the Future. One EDI project supported in 2009-2010 was Place de la Francophonie. For more information about EDI, and WD’s other efforts related to the Official Languages Act, please see:
Status Reports on the Implementation of Section 41 of the Official Languages Act
List of acronyms
ASC Initiative - Alberta Saskatchewan Centenaries Initiative
BC - British Columbia
BCF - Building Canada Fund
BERD - Business expenditure on research and development
CAF - Community Adjustment Fund
CB - Canada Business
CBN - Canada Business Network
CCS - carbon capture and storage
CEDI - Community Economic Development Initiative
CF Program - Community Futures Program
CIC - Composites Innovation Centre
CSIF - Canada Strategic Infrastructure Fund
DPR - Departmental Performance Report
EAP - Canada’s Economic Action Plan
EDI - Economic Development Initiative
FEDO - Francophone Economic Development Organizations
G&C - grants and contributions
GDP - Gross Domestic Product
GERD - Gross Domestic Expenditures on Research and Development
HR - human resources
ICP - Infrastructure Canada Program
ICT - Information and Communications Technologies
IPAC-CO2 - International Performance Assessment Centre for Geologic Storage of Carbon Dioxide
IRBs - Industrial and Regional Benefits
LI Program - Loan and Investment Program
MAF - Management Accountability Framework
MPB - Mountain Pine Beetle
MRIF - Municipal Rural Infrastructure Fund
NAPP - North American Platform Program
OECD - Organization for Economic Cooperation and Development
OGD - Other Government Department
ORIC- Okanagan Research and Innovation Centre
PA - Program Activity
PAA- Program Activity Architecture
PMF - Performance Measurement Framework
R&D - Research and Development
RDA - Regional Development Agencies
RInC - Recreational Infrastructure Canada program
RPP - Report on Plans and Priorities
S&T - science and technology
SIMSI - Shared Information Management System for Infrastructure
UDA - Urban Development Agreements
WCBSN - Western Canada Business Service Network
WD - Western Economic Diversification Canada
WDP - Western Diversification Program
WEI - Women Enterprise Initiative
WEPA - Western Economic Partnership Agreements
[1] Other new funding included $12.4M carried forward for MPB Initiatives, $3.9M for Canada Business Network, $3.8M excess collections, $2.4M operating carry forward, $2.1M Building Canada Fund operating funding, $1.8M carried forward for WEPA, $1.8M contracted salary increase, $0.7M carry forward for the Infrastructure Canada Program, and $2.3M for various other items.
[2] Authority to transfer $25.2M related to Alberta and Saskatchewan Centenaries to future years was sought through the 2010-2011 Annual Reference Level Update process.
[3] Type is defined as follows: previously committed to—committed to in the first or second fiscal year prior to 2009-2010; ongoing—committed to at least three fiscal years prior to 2009-2010; and new—newly committed to in 2009-2010.
[4] Performance status is a five-point scale ranging from Exceeded to Not met. The assessment of status identified for each priority is based on guidelines provided by the Treasury Board of Canada, taking into consideration two factors: anticipated impact of projects approved, and performance against planning highlights identified in RPP 2009-2010. (Only the second factor was considered in rating management priorities.)
[5] ICP National Evaluation, p. 14. Note a regional breakdown of data is not available.
[6] A suspense account is an account to which a transaction is posted on a temporary basis until its ultimate disposition is determined. As such, OGD suspense accounts do not represent a Parliamentary authority and therefore cannot be used per se to authorize payment out of the Consolidated Revenue Fund. At year-end, unspent funds in an OGD suspense account must be returned to the funding department.
[7] A person-month of employment is one person working for one month, for 40 hours per week.
[8] A FTE job is a job for 12 months, for 40 hours per week. To convert FTEs to person-months of employment, multiply the number of FTEs by 12.
[9] Contributions to Recipients are made on a reimbursement basis. Therefore, number of projects completed and expenditures by year end were low as the programs were ramping up during Year One of the EAP.
[10] Includes all outcomes reported from April 1, 2005 to March 31, 2010, through Project Gateway. Excludes Unexpected Benefits, outcomes reported in draft stage, as well as outcomes of core funding of Western Canada Business Service Network (WCBSN) members.
[11] Includes cumulative outcomes from October 2000 to March 31, 2010.
[12] The methodology used to derive number of communities changed from DPR 2008-2009; therefore, the cumulative value is in fact lower as of March 31, 2010.
[13] Number of visits reported in DPR 2008-2009 was incremental only, therefore, the cumulative value as of March 31, 2010 appears to be much greater.
[14] The methodology used to derive number of communities changed from DPR 2008-2009.