
Treasury Board of Canada Secretariat
www.tbs-sct.gc.ca
Common menu bar links
Breadcrumb Trail
ARCHIVED - Human Resources and Skills Development Canada - Report
 This page has been archived.
Archived Content
Information identified as archived on the Web is for reference, research or recordkeeping purposes. It has not been altered or updated after the date of archiving. Web pages that are archived on the Web are not subject to the Government of Canada Web Standards. As per the Communications Policy of the Government of Canada, you can request alternate formats on the "Contact Us" page.
Section III - Supplementary Information
3.1 Electronic Tables
All electronic supplementary information tables listed in the 2009–10 Departmental Performance Report can be found on the Treasury Board of Canada Secretariat’s website at http://www.tbs-sct.gc.ca/dpr-rmr/st-ts-eng.asp
Supplementary Information Tables
- Sources of Respendable and Non-Respendable Revenue
- User Fees / External Fees
- Details of Transfer Payment Programs
- Up-Front Multi-Year Funding
- Horizontal Initiatives
- Green Procurement
- Response to Parliamentary Committees and External Audits
- Internal Audits & Evaluations
3.2 Financial Highlights
The financial highlights presented within this Departmental Performance Report are intended to serve as a general overview of HRSDC's financial position and operations. The Department's unaudited consolidated financial statements are available online at: http://www.rhdcc-hrsdc.gc.ca/eng/publications_resources/dpr/dpr/financial_statement/dpr_09-10_financial_e.shtml.
HRSDC is financed by the Government of Canada through Parliamentary authorities. Financial reporting of authorities provided to HRSDC do not parallel financial reporting according to generally accepted accounting principles since authorities are primarily based on cash flow requirements. Consequently, items recognized in the Consolidated Statement of Operations and the Consolidated Statement of Financial Position are not necessarily the same as those provided through authorities from Parliament. A reconciliation between authorities used and the net cost of operations is set out in Note 3 of the Department’s consolidated financial statements.
These consolidated financial statements include the transactions of the Employment Insurance Operating (EIO) Account, a sub-entity under the control of HRSDC. The accounts of this sub-entity have been consolidated with those of HRSDC and all inter-organizational balances and transactions have been eliminated. The balance of the Canada Pension Plan (CPP) deposit in the Consolidated Revenue Fund is presented as a liability in the departmental statements. The actuarial value of the Government Annuities Account (GAA) is presented as a liability in the departmental statements.
The purpose of this section is to explain the Department's 2009-2010 financial highlights, based on the Department's consolidated financial statements. The charts below illustrate the ending balances, as of March 31, for each major financial statement grouping, along with the corresponding change from the previous fiscal year. In summary, between 2008-2009 and 2009-2010, the Department’s assets increased by 2%, its liabilities decreased by 5%, its expenses increased by 13%, and its revenues decreased by 6%. Below the charts are explanations for the variances in each major grouping based on the most significant factors that affected each grouping during the fiscal year.
| Condensed Statement of Financial Position At End of Year (March 31, 2010) |
% Change | 2010 | 2009 |
|---|---|---|---|
| Total Assets | 2.4% | 14,341.1 | 13,999.0 |
| Total Liabilities | -4.6% | 2,777.4 | 2,912.8 |
| Total Equity | 4.3% | 11,563.7 | 11,086.2 |
Assets by type
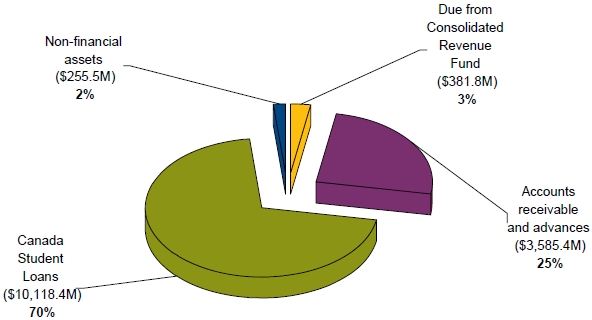
Text description of Assets by type
Total assets amounted to $14,341.1 million as at March 31, 2010, an increase of $342.1 million (2.4%) over the previous year's total assets of $13,999.0 million. The increase in assets is mainly due to an increase of $771.9 million in Canada Student Loans caused by an excess of new loans disbursed over the total amount of repayments, which was partially offset by a decrease of $394.1 million in the amount due from the Consolidated Revenue Fund.
Liabilities by type
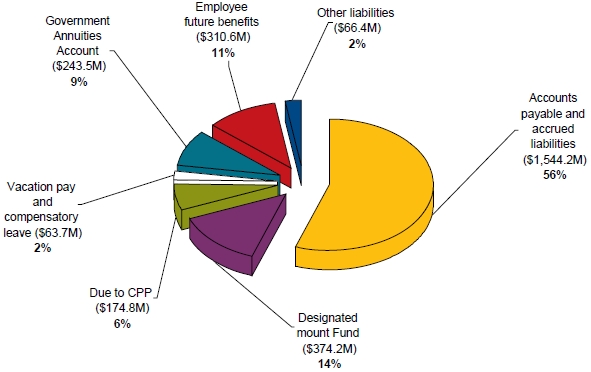
Text description of Liabilities by type
Total liabilities amounted to $2,777.4 million as at March 31, 2010, a decrease of $135.4 million (4.6%) over the previous year's total liabilities of $2,912.8 million. The decrease in liabilities is mainly due to a decrease in accounts payable and accrued liabilities due to the timing of the payments at year-end.
| Condensed Statement of Financial Position At End of Year (March 31, 2010) |
% Change | 2010 | 2009 |
|---|---|---|---|
| Expenses | |||
| Transfer payments | 14.1% | 62,466.0 | 54,741.2 |
| Operating expenses | 1.4% | 3,605.1 | 3,557.0 |
| Total Expenses | 13.3% | 66,071.1 | 58,298.2 |
| Revenues | |||
| EI revenues | -5.8% | 17,177.0 | 18,231.8 |
| Other | -15.5% | 720.9 | 853.3 |
| Total Revenues | -6.2% | 17,897.9 | 19,085.1 |
| Net Cost of Operations | 22.8% | 48,173.2 | 39,213.1 |
Expenses by major program activity
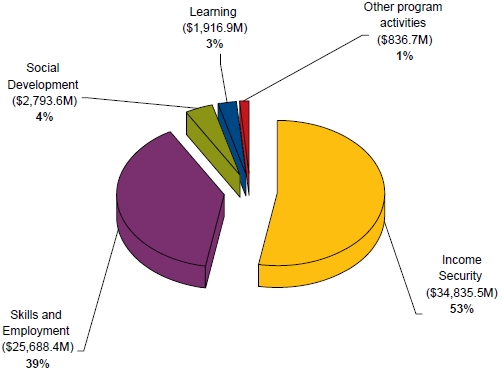
Text description of Expenses by major program activity
Total expenses for the 2009-2010 year amounted to $66,071.1 million, an increase of $7,772.9 million (13.3 percent) over the previous year’s total expenses of $58,298.2 million. The increase in total expenses is mostly attributable to:
- an increase of $6,025.4 million in Skills and Employment expenses due to the impacts of the global economic downturn and the Government’s response as part of Canada Economic Action Plan;
- an increase of $1,404.1 million in Income Security expenses due to an increase in the eligible Old Age Security / Guaranteed Income Supplement population, and an increase in the monthly benefit amount, due to an aging population; and,
- an increase of $418.4 million in Learning expenses due to the introduction of the new enhanced measures of the Canada Student Loans program.
Revenues by major program activity
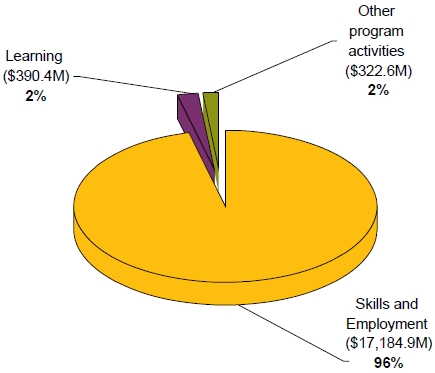
Text description of Revenues by major program activity
Total revenues for the 2009-2010 year amounted to $17,897.9 million, a decrease of $1,187.2 million (6.2%) over the previous year's total revenues of $19,085.1 million. The majority of this decrease can be explained by a decrease of $950.2 million in interest revenue related to Employment Insurance. In fact, as part of the amendments to the Employment Insurance Act, which came into force on January 1, 2009, the new EIO Account does not earn interest on the balance of the deposit in the Consolidated Revenue Fund in the same manner as the EI Account.
3.3 Specified Purpose Accounts
Introduction
Specified Purpose Accounts consist of special categories of revenues and expenditures. They report transactions of certain accounts where enabling legislation requires that revenues be earmarked and that related payments and expenditures be charged against such revenues. The transactions of these accounts are to be accounted for separately.
HRSDC is responsible for the stewardship of five such accounts:
- the Employment Insurance Account;
- the Canada Pension Plan;
- the Government Annuities Account;
- the Civil Service Insurance Fund; and
- the Canada Millennium Scholarship Foundation Excellence Awards Fund.
The Employment Insurance Account is a consolidated Specified Purpose Account and is included in the financial reporting of the Government of Canada. Consolidated Specified Purpose Accounts are used principally where the activities are similar in nature to departmental activities and the transactions do not represent liabilities to third parties but, in essence, constitute government revenues and expenditures.
The Canada Pension Plan is a Specified Purpose Account but is not consolidated as part of the Government of Canada financial statements. It is under joint control of the government and the participating provinces. As administrator, the government’s authority to spend is limited to the balance in the Plan.
The Government Annuities Account is not a consolidated Specified Purpose Account. It was established by the Government Annuities Act, and modified by the Government Annuities Improvement Act, which discontinued sales of annuities in 1975. The account is valued on an actuarial basis each year, with the deficit or surplus charged or credited to the Consolidated Revenue Fund.
The Civil Service Insurance Fund is not a consolidated Specified Purpose Account. It was established by the Civil Service Insurance Act. Pursuant to subsection 16(3) of the Civil Service Insurance Regulations, the amount of actuarial deficits is transferred from the Consolidated Revenue Fund to the Civil Service Insurance Account in order to balance the assets and liabilities of the program.
The Canada Millennium Scholarship Foundation Excellence Awards Fund is not a consolidated Specified Purpose Account. It was established in order for HRSDC to administer the remaining Excellence Awards payments to eligible students upon the dissolution of the Canada Millennium Scholarship Foundation, which was ending after its ten-year mandate. HRSDC will administer the remaining Excellence Awards disbursements from January 1, 2010 until December 31, 2013. After this date, HRSDC will transfer any funds remaining in the account to the Consolidated Revenue Fund.
The following information updates forecasted data on the Employment Insurance Account and the Canada Pension Plan that the Department provided in the 2009-2010 Report on Plans and Priorities10. That report presented multi-year financial data and general information. Additional information about performance and year-end data is available at the Internet addresses provided in this section.
Employment Insurance Account
The table below summarizes the financial results for the Employment Insurance Account from 2007-2008 to 2009-2010.
| Actual | |||
|---|---|---|---|
| (millions of dollars) | 2007-2008 | 2008-2009 | 2009-2010 |
| Expenditures | |||
| Benefits | 14,293 | 16,308 | 21,586 |
| Administrative Costs | 1,689 | 1,801 | 2,031 |
| Doubtful Accountsb | 81 | 27 | 50 |
| Sub-Total | 16,063 | 18,137 | 23,667 |
| EI Premiums and Penalties | |||
| Premiums | 16,877 | 17,217 | 17,121 |
| Penalties | 58 | 41 | 42 |
| Sub-Total | 16,935 | 17,258 | 17,163 |
| Variance | 872 | (879) | (6,504) |
| Premium Rate(% of Insurable Earnings) | 2008 | 2009 | 2010 |
| Employee | 1.73% | 1.73% | 1.73% |
| Employer | 2.42% | 2.42% | 2.42% |
|
a The EI Account is a consolidated Specified Purpose Account and is included in the financial reporting of the Government of Canada. Consolidated Specified Purpose Accounts are used principally where the activities are similar in nature to departmental activities and the transactions do not represent
liabilities to third parties but, in essence, constitute government revenues and expenditures. Note: Totals may not add due to rounding. |
|||
Revenues from Employment Insurance premiums decreased in 2009-2010 due to lower insurable earnings resulting from a decrease in employment. Employment Insurance benefit payments increased due to an increase in the number of beneficiaries and higher weekly benefits. As a result, expenditures exceeded revenues by $6.5 billion. The revenue shortfall was partially offset by $0.1 billion in interest earned and $1.5 billion in additional funding for measures introduced in Budget 2009.
More detailed information is reported in the 2009-2010 audited Employment Insurance Account financial statements that are included in the 2010 Public Accounts of Canada, Volume 1, Section 4.11 HRSDC also offers information about Employment Insurance on its website.12 It provides information about the authority, objectives and details of the program as well as links to Actuarial Reports and the Employment Insurance Commission’s annual Monitoring and Assessment Reports.
Canada Pension Plan
The following table summarizes the financial results for the Canada Pension Plan (CPP) from 2007-2008 to 2009-2010.
More information relating to 2009-2010 is reported in the Canada Pension Plan financial statements which can be found in the 2010 Public Accounts of Canada, Volume 1, Section 6.
| 2007-2008 | 2008-2009 | 2009-2010 | ||
|---|---|---|---|---|
| ($ millions) | Actual | Forecast | Actual | |
| Revenue | ||||
| Contributions | 35,346 | 36,506 | 34,287 | 36,276 |
| Investment Income | ||||
| Canada Pension Plan | 11 | 6 | 1 | 1 |
| CPP Investment Boarda | (268) | (23,576) | - | 16,218 |
| Total Investment Income | (257) | (23,570) | 1 | 16,219 |
| Total Revenue | 35,089 | 12,936 | 34,288 | 52,495 |
| Expenditures | ||||
| Benefit Payments | 27,536 | 29,005 | 30,502 | 30,363 |
| Administrative Expensesb | 599 | 694 | 742 | 734 |
| Total Expenditures | 28,135 | 29,699 | 31,244 | 31,097 |
| Increase / Decrease | 6,954 | (16,763) | 3,044 | 21,398 |
| Year-end Balance | 126,785 | 110,022 | 113,066 | 131,420 |
|
a Canada Pension Plan Investment Board actual amounts are based on their audited financial statements. The Canada Pension Plan Investment Board invests mainly in equities and fixed income securities. The investment income is composed of realized gains and losses from investments, unrealized gains and losses on investments held at the end of the period (change in fair value) and foreign exchange gains and losses. For 2009-2010, there was a net investment gain. b Administrative expenses include Canada Pension Plan administrative expenses as well as Canada Pension Plan Investment Board administrative expenses. Note: All amounts from this table for 2007-2008 and 2008-2009 are the consolidated amounts found in the audited Canada Pension Plan annual financial statements. |
||||
Government Annuities Account
The table below summarizes the financial results for the Government Annuities Account from 2007-2008 to 2009-2010. Source of the figures is the Report of the Chief Actuary on the Government Annuities as at March 31, 2010.
| Actual | |||
|---|---|---|---|
| (millions of dollars) | 2007-2008 | 2008-2009 | 2009-2010 |
| Actuarial Liabilities – | |||
| Balance at Beginning of Year | 319.4 | 292.9 | 267.2 |
| Income | 21.1 | 19.4 | 17.5 |
| Payments and Other Charges | 45.0 | 42.0 | 38.7 |
| Excess of Payments and Other Charges Over Income for the Year | 23.9 | 22.6 | 21.2 |
| Actuarial Surplus | 2.6 | 3.1 | 2.5 |
| Actuarial Liabilities – | |||
| Balance at End of the Year | 292.9 | 267.2 | 243.5 |
The annual report and financial statements for Government Annuities are available in the 2010 Public Accounts of Canada, Volume 1, Section 6.13
Civil Service Insurance Fund
The table below summarizes the financial results for the Civil Service Insurance Fund from 2007-2008 to 2009-2010
| Actual | |||
|---|---|---|---|
| (millions of dollars) | 2007-2008 | 2008-2009 | 2009-2010 |
| Opening Balance | 6.0 | 5.9 | 5.6 |
| Receipts and Other Credits | 0.1 | 0.0 | 0.1 |
| Payments and Other Charges | 0.2 | 0.3 | 0.3 |
| Excess of Payments and Other Charges Over Income for the Year | 0.1 | 0.3 | 0.2 |
| Balance at End of the Year | 5.9 | 5.6 | 5.5 |
The annual report and financial statements for the Civil Service Insurance Fund are available in the 2010 Public Accounts of Canada, Volume 1, Section 6.14
Canada Millennium Scholarship Foundation Excellence Awards Fund
In accordance with Budget Implementation Act 2008, the Canada Millennium Scholarship Foundation is ending after its ten-year mandate. This Specified Purpose Account was established by way of an agreement between Canada Millennium Scholarship Foundation and Human Resources and Skills Development Canada (HRSDC) in order for HRSDC to administer the remaining Excellence Awards payments to eligible students upon the dissolution of the Canada Millennium Scholarship Foundation. The transfer of funds also includes the costs of administering this program on behalf of the Canada Millennium Scholarship Foundation.
HRSDC will administer the remaining Excellence Awards disbursements from January 1, 2010 until December 31, 2013. After this date, HRSDC will transfer any funds remaining in the account to the Consolidated Revenue Fund.
| Actual | |||
|---|---|---|---|
| (millions of dollars) | 2007-2008 | 2008-2009 | 2009-2010 |
| Opening Balance | - | - | - |
| Receipts and other credits | - | - | 14.8 |
| Payments and other charges | - | - | 0.4 |
| Excess of payments and other charges over receipts for the year | - | - | (14.4) |
| Closing Balance | - | - | 14.4 |
| 1 Receipts and other credits include a one-time payment of $14.8 million from the Canada Millennium Scholarship Foundation to the Specified Purpose Account for the purpose of administering remaining Excellence Awards between January 1, 2010 and December 31, 2013. | |||
3.4 Statutory Annual Reports
Old Age Security
The Old Age Security program is one of the cornerstones of Canada's retirement income system. Benefits include the basic Old Age Security pension, the Guaranteed Income Supplement and the Allowance. The Old Age Security program is financed from Government of Canada general tax revenues.
The following tables present information about monthly benefits, beneficiaries and payments by province or territory.
| (dollars) | Basic Pension | Income Supplement | Allowance | |||
|---|---|---|---|---|---|---|
| Fiscal Year | Single | Married | Regular | Survivor | Increase | |
| Monthly benefit by fiscal year | ||||||
| 2009-2010 Actuals | ||||||
| January 1, 2010 | 516.96 | 652.51 | 430.90 | 947.86 | 1,050.68 | 0.0% |
| October 1, 2009 | 516.96 | 652.51 | 430.90 | 947.86 | 1,050.68 | 0.0% |
| July 1, 2009 | 516.96 | 652.51 | 430.90 | 947.86 | 1,050.68 | 0.0% |
| April 1, 2009 | 516.96 | 652.51 | 430.90 | 947.86 | 1,050.68 | 0.0% |
| 2009-2010 Estimates | ||||||
| January 1, 2010 | 522.66 | 659.70 | 435.65 | 958.31 | 1,062.26 | 0.3% |
| October 1, 2009 | 521.10 | 657.73 | 434.35 | 955.45 | 1,059.09 | 0.7% |
| July 1, 2009 | 517.48 | 653.16 | 431.33 | 948.81 | 1,051.73 | 0.1% |
| April 1, 2009 | 516.96 | 652.51 | 430.90 | 947.86 | 1,050.68 | 0.0% |
| 2008-2009 Actuals | ||||||
| January 1, 2009 | 516.96 | 652.51 | 430.90 | 947.86 | 1,050.68 | 0.0% |
| October 1, 2008 | 516.96 | 652.51 | 430.90 | 947.86 | 1,050.68 | 2.2% |
| July 1, 2008 | 505.83 | 638.46 | 421.62 | 927.45 | 1,028.06 | 0.7% |
| April 1, 2008 | 502.31 | 634.02 | 418.69 | 921.00 | 1,020.91 | 0.0% |
| Maximum amount paid (annual benefits) | ||||||
| 2009-2010 Actuals | 6,203.52 | 7,830.12 | 5,170.80 | 11,374.32 | 12,608.16 | 1.3% |
| 2009-2010 Estimates | 6,234.60 | 7,869.30 | 5,196.69 | 11,431.29 | 12,671.28 | 1.8% |
| 2008-2009 Actuals | 6,126.18 | 7,732.50 | 5,106.33 | 11,232.51 | 12,450.99 | 3.4% |
| March 2009 | March 2010 | |||||||
|---|---|---|---|---|---|---|---|---|
| Province or Territory | Old Age Security (OAS) Pension | Guarantee Income Supplement (GIS) | Allowance | GIS as % of OAS | Old Age Security (OAS) Pension | Guarantee Income Supplement (GIS) | Allowance | GIS as % of OAS |
| Newfoundland and Labrador | 74,884 | 45,766 | 4,360 | 61.12 | 77,362 | 46,025 | 4,376 | 59.49 |
| Prince Edward Island | 20,645 | 9,320 | 556 | 45.14 | 21,189 | 9,369 | 585 | 44.22 |
| Nova Scotia | 142,077 | 59,515 | 4,120 | 41.89 | 145,682 | 60,206 | 4,037 | 41.33 |
| New Brunswick | 112,962 | 54,434 | 4,194 | 48.19 | 115,916 | 55,074 | 4,021 | 47.51 |
| Quebec | 1,142,879 | 518,355 | 30,353 | 45.36 | 1,181,774 | 533,717 | 30,246 | 45.16 |
| Ontario | 1,690,561 | 479,751 | 26,741 | 28.38 | 1,737,000 | 493,407 | 27,070 | 28.41 |
| Manitoba | 163,581 | 58,026 | 3,299 | 35.47 | 166,245 | 56,934 | 3,101 | 34.25 |
| Saskatchewan | 147,341 | 55,326 | 3,144 | 37.55 | 148,590 | 53,167 | 2,879 | 35.78 |
| Alberta | 365,759 | 117,370 | 5,497 | 32.09 | 375,679 | 116,782 | 5,633 | 31.09 |
| British Columbia | 603,784 | 194,667 | 11,009 | 32.24 | 622,655 | 200,248 | 11,501 | 32.16 |
| Yukon | 2,638 | 806 | 55 | 30.55 | 2,828 | 859 | 42 | 30.37 |
| Northwest Territoriesa | 3,098 | 1,613 | 118 | 52.07 | 3,209 | 1,628 | 120 | 50.73 |
| Internationalb | 90,885 | 8,546 | 62 | 9.40 | 93,755 | 8,371 | 57 | 8.93 |
| Total | 4,561,094 | 1,603,495 | 93,508 | 35.16 | 4,691,884 | 1,635,787 | 93,668 | 34.86 |
| a. Data for Nunavut are included. b. Persons receiving Canadian Old Age Security benefits under International Social Security Agreements. |
||||||||
| (dollars) | ||||
|---|---|---|---|---|
| Province or Territory | Old Age Security (OAS) Pension | Guaranteed Income Supplement (GIS) | Allowance | Total |
| Newfoundland and Labrador | 472,649,035 | 197,318,079 | 26,300,993 | 696,268,107 |
| Prince Edward Island | 129,197,975 | 39,859,709 | 2,764,100 | 171,821,783 |
| Nova Scotia | 891,153,171 | 241,598,237 | 21,686,738 | 1,154,438,146 |
| New Brunswick | 708,901,231 | 231,599,758 | 22,976,187 | 963,477,176 |
| Quebec | 7,129,132,040 | 2,336,537,562 | 159,494,901 | 9,625,164,503 |
| Ontario | 10,118,967,492 | 2,542,272,691 | 164,559,895 | 12,825,800,077 |
| Manitoba | 1,010,754,263 | 242,152,127 | 17,824,747 | 1,270,731,137 |
| Saskatchewan | 916,236,051 | 224,516,699 | 17,066,693 | 1,157,819,443 |
| Alberta | 2,222,165,224 | 558,603,566 | 33,070,445 | 2,813,839,234 |
| British Columbia | 3,576,618,544 | 1,025,495,171 | 67,458,903 | 4,669,572,618 |
| Yukon | 16,966,723 | 3,863,515 | 261,951 | 21,092,190 |
| Northwest Territoriesa | 19,540,889 | 8,743,201 | 941,810 | 29,225,901 |
| Internationalb | 133,203,903 | 84,072,993 | 450,104 | 217,727,000 |
| Total | 27,345,486,541 | 7,736,633,308 | 534,857,467 | 35,616,977,316 |
| Recovery tax portion of OAS | (954,145,701) | - | - | (954,145,701) |
| Total including recovery tax | 26,391,340,840 | 7,736,633,308 | 534,857,467 | 34,662,831,615 |
| a. Data for Nunavut are included. b. Persons receiving Canadian Old Age Security benefits under International Social Security Agreements. |
||||
Consolidated Report on Canada Student Loans
| Actual | 2009-2010 | |||
|---|---|---|---|---|
| (millions of dollars) | 2007-2008 | 2008-2009 | Planned | Actual |
| Revenues | ||||
| Interest Revenue on Direct Loans | 537.1 | 472.8 | 532.1 | 369.8 |
| Recoveries on Guaranteed Loans | 46.6 | 38.5 | 24.7 | 27.4 |
| Recoveries on Put-Back Loans (RS) | 13.5 | 13.1 | 7.4 | 11.0 |
| Total Loan Revenue | 597.2 | 524.4 | 564.2 | 408.2 |
| Expenses | ||||
| Transfer payment | ||||
| Canada Study Grants, Canada Access Grants and Canada Student Grants Program | 161.5 | 143.2 | 511.5 | 533.7 |
| Loan Administration | ||||
| Collection Costs (All regimes)a | 14.4 | 10.7 | 3.8 | 5.2 |
| Program Delivery Costs (DL) | 70.8 | 76.0 | 60.9 | 61.7 |
| Risk Premium to Financial Institutions (RS) | 1.3 | 0.7 | 1.0 | 0.6 |
| Put-Back to Financial Institutions (RS) | 3.8 | 3.8 | 3.3 | 3.6 |
| Administrative Fees to Provinces and Territories and SIF (DL ) | 13.7 | 14.7 | 20.1 | 19.3 |
| Total Loan Administration Expenses | 104.0 | 105.9 | 89.1 | 90.4 |
| Cost of Government Benefits to Students | ||||
| In-Study Interest Borrowing Expense (Class A - DL)b | 196.4 | 166.9 | 184.7 | 177.4 |
| In Repayment Interest Borrowing Expense (Class B - DL)b | 173.6 | 160.7 | 210.4 | 180.0 |
| In-Study Interest Subsidy (RS & GL) | 8.0 | 4.0 | 3.5 | 1.4 |
| Repayment Assistance Programse | 107.5 | 93.2 | 128.9 | 74.9 |
| Claims Paid & Loans Forgiven (All regimes) | 17.0 | 23.2 | 11.8 | 22.5 |
| Total Cost of Govt Benefits to Students | 502.5 | 448.0 | 539.3 | 456.2 |
| Bad Debt Expensec | ||||
| Debt Reduction in Repayment Expense (DL) | 12.4 | 53.2 | 12.8 | 133.4 |
| Bad Debt Expense (DL) | 293.5 | 293.6 | 326.6 | 129.1 |
| Total Bad Debt Expense | 305.9 | 346.8 | 339.4 | 262.5 |
| Total Loan Expenses | 1,073.9 | 1,043.9 | 1,479.3 | 1,342.8 |
| Net Operating Results | 476.7 | 519.5 | 915.1 | 934.6 |
| Alternative Payments to Non-Participating Provinces (DL)d | 113.9 | 111.0 | 90.5 | 223.1 |
| Final Net Operating Results | 590.6 | 630.5 | 1,005.6 | 1,157.7 |
|
(DL) = Direct Loans a. These costs are related to collection activities performed by the Canada Revenue Agency. Figures for 2008-2009 have been adjusted by CRA and the new collection costs have been reflected. |
||||
For further information about the Consolidated Report on Canada Student Loans, refer to http://www.hrsdc.gc.ca/eng/publications_resources/dpr/dpr/index.shtml website.
1 See Education at a Glance 2009 at www.oecd.org.
2 These numbers are not mutually exclusive, as the same person may have both withdrawn funds from an RESP and received a federal loan. For more information about the Access and Support to Education and Training Survey, see www.statcan.gc.ca/pub/81-595-m/81-595-m2009079-eng.htm.
3 This percentage is based on the number of full-time students forecasted by the Office of the Chief Actuary for the Canada Student Loans Program (1,059,000) and does not include Quebec, the Northwest Territories or Nunavut, as these jurisdictions do not participate in the CSLP.
4 Quebec, the Northwest Territories and Nunavut do not participate in the CSLP but do receive alternative payments.
5 This percentage is based on the number of full-time and part-time students participating in post-secondary education according to the Labour Force Survey (1,949,390).
6 These two percentages are not mutually exclusive, as the same person may have both received a loan, grant or in-study interest subsidy and withdrawn funds from an RESP.
7 $533 million in grants includes the new Canada Student Grants as well as Canada Access Grants, Canada Study Grants and Canadian Millennium Scholarship Foundation transitional grants.
8 Based on Statistics Canada's Low-Income Cut-Off (LICO) which estimates the threshold at which families spend 20% more of their income on necessities than the average family. The exact income cut-off varies by family size and size of the population centre where they reside. See: http://www.statcan.gc.ca/pub/75f0002m/2010005/tbl/tbl01-eng.htm
9 Although technically not an internal service according to the definition of Internal Services provided by the Treasury Board Secretariat, the management of grants and contributions is a cross-cutting function that affects every grant and contribution program within the entire Department. For this reason, it was deemed appropriate to place it under internal services, which are also supportive of the whole Department.
10 For further information, see http://www.tbs-sct.gc.ca/rpp/2009-2010/index-eng.asp?acr=1383.
11 For further information, see http://www.tpsgc-pwgsc.gc.ca/recgen/txt/72-eng.html.
12 For further information, see http://www.hrsdc.gc.ca/en/ei/legislation/ei_act_tofprov_1.shtml.
13 For further information, see http://www.tpsgc-pwgsc.gc.ca/recgen/txt/index-eng.html.
14 For further information, see http://www.tpsgc-pwgsc.gc.ca/recgen/txt/index-eng.html.