Common menu bar links
Breadcrumb Trail
ARCHIVED - Indian and Northern Affairs Canada and Canadian Polar Commission
 This page has been archived.
Archived Content
Information identified as archived on the Web is for reference, research or recordkeeping purposes. It has not been altered or updated after the date of archiving. Web pages that are archived on the Web are not subject to the Government of Canada Web Standards. As per the Communications Policy of the Government of Canada, you can request alternate formats on the "Contact Us" page.
Section 3 — Supplementary Information
Financial Highlights
The financial highlights presented within this Departmental Performance Report are intended to serve as a general overview of INAC’s financial position and operations. A more detailed financial statement can be found on INAC’s website.
| (Dollars in thousands) | |||
| % Change | 2008 | 2007 | |
|---|---|---|---|
| At end of Year (March 31) | |||
| Condensed Statement of Financial Position | |||
| Total Assets | -2% | 909,619 | 925,882 |
| Total Liabilities | +8% | 14,688,518 | 13,637,210 |
| Total Equity | -8% | 13,778,899 | 12,711,328 |
| TOTAL | -2% | 909,619 | 925,882 |
| For the Year Ending March 31 | |||
| Condensed Statement of Operations | |||
| Total Expenses | +25% | 8,241,680 | 6,583,901 |
| Total Revenues | +20% | 249,115 | 208,120 |
| NET COST OF OPERATIONS | +25% | 7,992,565 | 6,375,781 |
The year-over-year increase of 8% in total liabilities is due mainly to the increase in the allowance for claims and litigation. The allowance for claims and litigation increased by $833.1 million (8.5%) in 2007–2008 as a result of an increase in the number of comprehensive land claims and an increase in the number of legal proceedings for claims being pursued through the courts.
The year-over-year increase of 25% in expenses is due in large part to a payment in the amount of $1.1 billion made to the Cree of Quebec regarding matters arising from the implementation of the James Bay and Northern Quebec agreements, as well as an accrual of $833.1 million for the increase in the allowance for claims and litigation as described above.
The year-over-year increase of 20% in revenues is due mainly to an increase of $45.7 million (29%) in resource royalties as a result of an increase in amounts received pursuant to contracts or regulations administered by the Department, such as the Northwest Territories and Nunavut Mining Regulations and the Frontier Lands Petroleum Royalty Regulations. Resource royalties also increased as a result of amounts received from assessments of prior years, undertaken to ensure compliance with the various regulations administered by the Department.
Supplementary Information
 Assets by Type
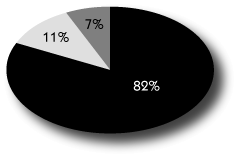
Total assets were $909.6 million at the end of 2007–2008, a decrease of $16.3 million (2%) over the previous year’s total assets of $925.9 million. Loans comprised 82% of total assets at $742.3 million. Accounts receivable of $103.2 million represented 11% of total assets, while non-financial assets of $64.1 million represented approximately 7% of total assets.
 Liability by Type
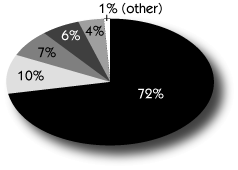
Total liabilities were $14.69 billion at the end of 2007–2008, an increase of $1.05 billion (8%) over the previous year’s total liabilities of $13.64 billion. The allowance for claims and litigation represents the largest portion of liabilities at $10.63 billion or 72% of total liabilities. Other significant liabilities include environmental liabilities of $1.497 billion
(10%), trust accounts of $1.034 billion (7%), accounts payable of $855.6 million (6%), and settled claims in the amount of $546.5 million (4%).
 Revenues — Where Funds Come From
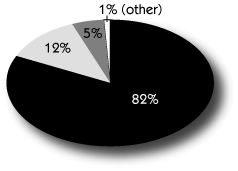
Total revenues amounted to $249.1 million for 2007–2008, representing a 20% increase over the previous year’s revenue of $208.1 million. Resource royalties, earned pursuant to contracts or regulations such as the Northwest Territories and Nunavut Mining Regulations and the Frontier Lands Petroleum Royalty Regulations, represent the most significant source
of revenue, accounting for $203.3 million or 82% of total revenues. Other sources of revenue include miscellaneous receipts of $29.7 million (12%) and interest on loans in the amount of $11.8 million (5%).
 Expenses — Where Funds Go
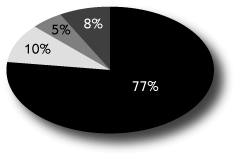
Total expenses were $8.24 billion in 2007–2008, representing a 25% increase over the previous year’s expenses of $6.58 billion. Transfer payments, the majority to Aboriginal people and Aboriginal organizations, amounted to $6.37 billion or 77% of total expenses. Expenses related to claims and litigation totalled $833.1 million in 2007–2008, accounting for 10% of
total expenses, while salaries and employee benefits amounted to $399.1 million, accounting for 5% of total expenses. Other miscellaneous operating expenses of $640 million accounted for the remaining 8% of total expenses.
List of Tables
The Voted and Statutory Items table can be found on the departmental website.
The following tables are located on the Treasury Board Secretariat website.
Loans, Investments and Advances
Sources of Non-Respendable Revenue
User Fees/External Fees
Details on Transfer Payments Programs
Sustainable Development Strategy
Response to Parliamentary Committees and External Audits
Internal Audits and Evaluations
Travel Policies
Horizontal Initiatives can be found on the Treasury Board Secretariat website.
Urban Aboriginal Strategy
Mackenzie Gas Project and Induced Exploration
First Nations Water Management Strategy
Labrador Innu Comprehensive Healing Strategy
International Polar Year
Internal Services
Internal Services, formerly known as Departmental Management and Administration, supports each of INAC’s strategic outcomes. For information on the Department’s Internal Services, please see the online extended Departmental Performance Report.
Allocation Methodology
Within the government planning and budgeting process, financial human resources for Internal Services are not identified separately. These resources are attributed to strategic outcomes and program activities. This presents a challenge for INAC to provide a useful presentation of resources, given that it is primarily in the business of transferring funds to third parties for the delivery of programs and services meeting its objectives and mandate. As such, it has to ensure the proper administration of these transfers, undertake monitoring and accountability activities, and provide policy advice and other services (e.g., litigation management). It should be noted, however, that the proportion of INAC’s total budget allocated to Internal Services amounts to less than 5 percent, which is comparable to other departments.
Contacts for Further Information
Indian and Northern Affairs Canada
Terrasses de la Chaudičre
10 Wellington Street, North Tower
Gatineau, Quebec
Mailing Address: Ottawa, Ontario K1A 0H4
E-mail: webmaster@ainc-inac.gc.ca
General and Statistical Inquiries, and Publication Distribution
Tel. (toll-free): 1-800-567-9604
TTY (toll-free): 1-866-553-0554
E-mail: InfoPubs@ainc-inac.gc.ca
Departmental Library
Tel.: 819-997-0811
E-mail: Reference@ainc-inac.gc.ca
Media Inquiries — Communications
Tel.: 819-953-1160
Canadian Polar Commission
Constitution Square
360 Albert Street, Suite 1710
Ottawa, Ontario K1R 7X7
Tel.: 613-943-8605 or (toll-free) 1-888-POLAR01 (1-888-765-2701)
E-mail: mail@polarcom.gc.ca
International Polar Year
