Demographic Snapshot of the Federal Public Service, 2013
Archived information
Archived information is provided for reference, research or recordkeeping purposes. It is not subject à to the Government of Canada Web Standards and has not been altered or updated since it was archived. Please contact us to request a format other than those available.
The information presented includes key demographics for the Federal Public Service, comparing the current workforce to that from previous years (e.g. 1983).
The Federal Public Service consists of two population segments: the Core Public Administration and separate agencies.
The term "Core Public Administration" refers to more than 80 departments and agencies for which the Treasury Board is the employer. These organizations are named in Schedules I and IV of the Financial Administration Act.
The term "separate agencies" refers to those listed in Schedule V of the Act. Separate agencies conduct their own negotiations or set their own classification and compensation levels for their employees.
The demographic information below supplements the Clerk of the Privy Council's Annual Report to the Prime Minister on the Public Service of Canada: Twenty-First Annual Report.
The data is current as of March 31st, 2013, unless otherwise indicated.
Table of Contents
- Introduction
- Part I – Demographic Profile of the Federal Public Service
- Part II – Demographic Profile of Executives
Introduction
This document presents key demographics for the Federal Public Service (FPS), See footnote 1 in keeping with information provided in previous Annual Reports to the Prime Minister on the Public Service of Canada. At times, current information is compared to other years. See footnote 2 Part I covers the entire FPS, while Part II focuses on executives.
Demographic Profile of the Federal Public Service of Canada
March 31st, 2013
- 262,817 employees (250,882 in 1983)
- 55.0% women (41.8% in 1983)
- 45.0% of executives are women (5.2% in 1983)
- 58.7% of employees in the regions and 41.3% in the National Capital Region
- 87.6% indeterminate employees; 8.1% term employees; 4.3% casuals and students
- 71.1% declared English their first official language; 28.9% declared French
- Average age: 44.8 years (39.3 in 1983)
- Average age of executives: 50.3 years (48.1 in 1983)
- The Federal Public Service represents 0.75% of the Canadian population (0.99% in 1983)
Part I – Demographic Profile of the Federal Public Service
1. Context – Relative Size and Spending
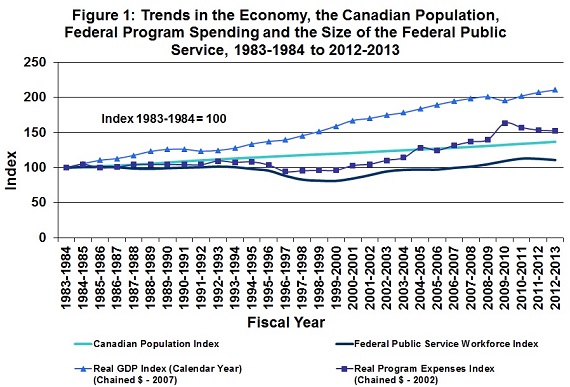
Between 1983 and 2013, the population of Canada grew from 25.3 million to 35.0 million (38.4%), See footnote 3 while the number of federal public servants increased from 250,882 to 262,817 (4.8%). The FPS currently comprises 0.75% of the Canadian population. This is still well below the ratios from the 1980s and early 1990s, which were very close to one percent.
Government priorities have had a significant influence on the size of the FPS workforce over the years. The focus in recent years has been on reducing the size and cost of the FPS workforce. As a result the FPS workforce decreased by approximately 5.5% over the last fiscal year (2012-2013).
For comparison purposes, the real Gross Domestic Product (GDP) increased by 110.6% and real federal program spending increased by 52.4% (in constant dollars) between 1983 and 2013. As seen in Figure 1, there has been an increase of 1.7% in real GDP and a decrease of 0.6% in federal program spending over the last year.
Sources: Office of the Chief Human Resources Officer, Treasury Board Secretariat; Statistics Canada; Department of Finance (Fiscal Reference Tables).
Notes:
Canadian Population Index is based on April 1st data of each year. The Federal Public Service Index is for active employees and is based on March 31st data at the start of each fiscal year.
Real Program Expenses Index is based on Fiscal Year Data while Real GDP is based on Calendar Year.
Program expenses include transfers and were deflated using the Consumer Price Index.
2. Federal Public Service Diversity
a) Gender
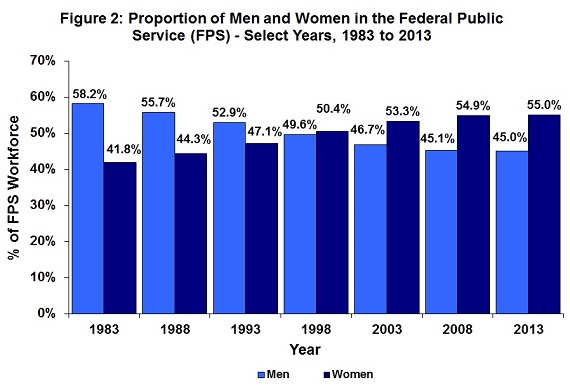
In 2013, 55.0% of federal public servants were women, a significant increase since 1983, when they comprised only 41.8% of the workforce.
Source: Office of the Chief Human Resources Officer, Treasury Board Secretariat.
Note: The figure includes all employment tenures and active employees only (i.e. employees on Leave without Pay are excluded). The information provided is based on March 31st data.
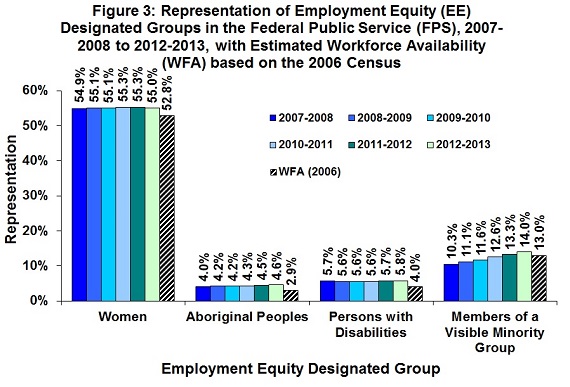
Current figures reflect the availability of women in the labour market and their levels of educational attainment. Even though women in the FPS accounted for 10.0% more of the population than men, the representation of women was only 2.2 percentage points above their workforce availability in 2013 (See Figure 3).
b) Employment Equity Designated Groups
Figure 3 shows that there have been modest increases in the representation levels of the four employment equity (EE) designated groups within the FPS since 2007-2008. The representation rates for Aboriginal peoples, persons with disabilities and visible minority employees were higher than the previous year and these groups continue to exceed their respective workforce availability (WFA) See footnote 4. However, the representation of women in the FPS decreased slightly from 55.3% in 2011-2012 to 55.0% in 2012-2013, but still remains above its workforce availability of 52.8%.
Source: Office of the Chief Human Resources Officer, Treasury Board Secretariat.
Population: Indeterminate population and term population of three months or more, excluding employees on Leave without Pay, in the Core Public Administration (CPA) and employees of separate agencies. Some small separate agencies were not included because of missing information.
Notes:
Workforce availability estimates for the Federal Public Service are based on the 2006 Census.
The source of the representation data is the CPA Employment Equity Data Bank, which is populated with self-identification information provided by employees, plus the data from separate agencies reports to Parliament.
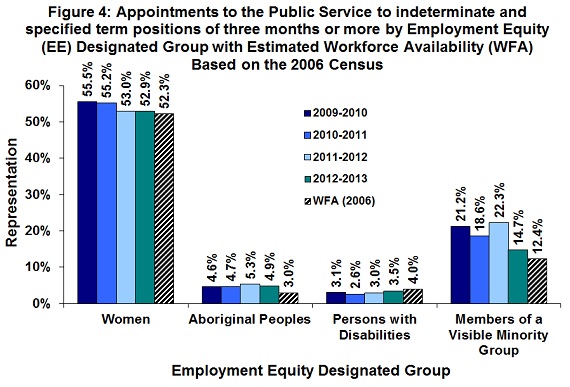
Hiring for indeterminate and term positions (three months or more) in Figure 4, shows that the level of new hires for all employment equity designated groups is still above the current workforce availability except for persons with disabilities, which remains below its current workforce availability.
Due to changes in methodology, figures for fiscal year 2012-2013 are not comparable to previous fiscal years.
Source:
Fiscal Years 2009-2010 to 2011-2012: Public Service Commission (PSC), 2011-2012 Annual Report, Table 11, p. 43 − PSC hiring and staffing activities files and the Public Service Resourcing System (PSRS).
Fiscal Year 2012-2013: Treasury Board Canada Secretariat (TBS) Employment Equity Data Bank (EEDB), the Public Service Commission (PSC) hiring and staffing activities files and the Public Service Resourcing System (PSRS).
Population: Indeterminate population and term population of three months or more in the Public Service.
Notes:
In the PSC context, the "Public Service" refers to organizations under the Public Service Employment Act (PSEA) universe which is approximately equivalent to the Core Public Administration.
The 2006 workforce availability for the Public Service was provided by the Office of the Chief Human Resources Officer, Treasury Board Secretariat. Workforce availability estimates are based on the 2006 Census and are for the Core Public Administration only.
All appointment figures exclude specified term appointments of less than three months and appointments to separate agencies.
The figures for women appointed to the Public Service are extracted from the PSC hiring and staffing activities files.
For appointments to the Public Service for fiscal years 2009-2010 to 2011-2012, the percentages for Aboriginal peoples, persons with disabilities and members of a visible minority group are based on applicants who applied and self-declared through the PSRS in the preceding two years, and where a match was found in the PSC’s hiring and staffing activities files covering the current fiscal year. Please note this data is only based on appointments via an advertised process.
For appointments to the Public Service for fiscal year 2012-2013, the percentages for Aboriginal peoples, persons with disabilities and members of a visible minority group are based on the TBS EEDB and where a match was found in the PSC hiring and staffing activities files covering the current fiscal year. This data captures all appointment processes - both advertised and non-advertised.
Due to changes in methodology, figures for fiscal year 2012-2013 are not comparable to previous fiscal years.
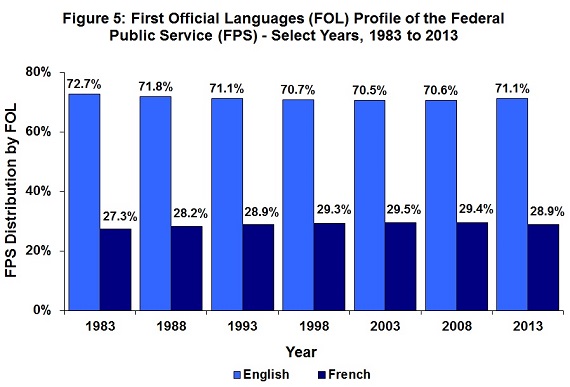
c) Language
As shown in Figure 5, the proportions of federal public servants identifying either English or French as their first official language (FOL) have remained relatively stable since 1983. For 2013, French was identified as the first official language by 28.9% of federal public servants and English was identified by 71.1% of employees.
Source: Office of the Chief Human Resources Officer, Treasury Board Secretariat.
Note: The figure includes all employment tenures and active employees only (i.e. employees on Leave without Pay are excluded). The information provided is based on March 31st data.
3. Age Profile of the Federal Public Service
In Figure 6, the age distribution of federal public servants is compared between the years 2008 and 2013. Over this five year period, the age distribution of federal public servants is starting to become more balanced. Specifically, there are more employees in the 25-39 and 55+ age groups, and there are fewer employees in the under 25 and 40-54 age groups. However, the 40-54 age group still accounts for almost 50% of the entire FPS workforce. A transition between generations is becoming evident, attributable to past recruitment efforts and current retirement patterns.
Since 2008, the average age of federal public servants has increased slightly (going from 44.1 to 44.8 years in 2013).
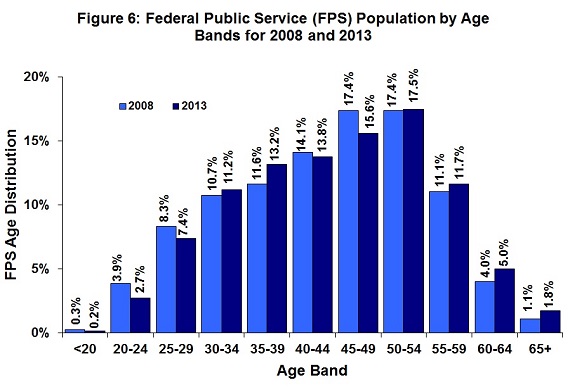
Figure 6: Federal Public Service (FPS) Population by Age Bands for 2008 and 2013 – Text Version
Source: Office of the Chief Human Resources Officer, Treasury Board Secretariat.
Note: The figure includes all employment tenures and active employees only (i.e. employees on Leave without Pay are excluded). The information provided is based on March 31st data.
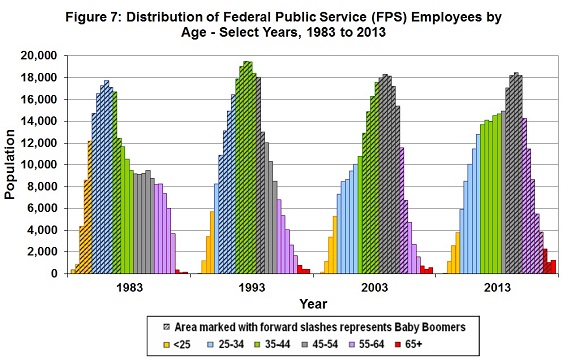
Figure 7 shows the distribution of federal public servants by age for selected years between 1983 and 2013. The baby boomer generation (bars marked by forward slashes) can be seen moving through the age bands. In 2013 this generation occupied the 47 to 67 age range and in the graph below, these individuals fall in the upper three age categories, 45-54, 55-64 and 65 plus. Changes in some of the age bands are reflective of the effect of new generations joining the FPS and the current retirement patterns. As the table below shows, our FPS workforce is multigenerational.
Source: Office of the Chief Human Resources Officer, Treasury Board Secretariat.
Notes:
The figure includes all employment tenures and active employees only (i.e. employees on Leave without Pay are excluded). The information provided is based on March 31st data.
Each vertical bar represents two years of age, except for the first and last bar. The first bar includes all individuals below 17 years of age and the last bar includes all individuals above 68 years of age.
| 1983 | 1988 | 1993 | 1998 | 2003 | 2013 | |
|---|---|---|---|---|---|---|
| Traditionalists | 38 or more | 43 or more | 48 or more | 53 or more | 58 or more | 68 or more |
| Baby Boomers | 17-37 | 22-42 | 27-47 | 32-52 | 37-57 | 47-67 |
| Generation X | 16 or less | 21 or less | 17-26 | 22-31 | 27-36 | 37-46 |
| Generation Y | NA | NA | 16 or less | 21 or less | 26 or less | 21-36 |
| Generation Z | NA | NA | NA | NA | NA | 20 or less |
4. Federal Public Service Retirements
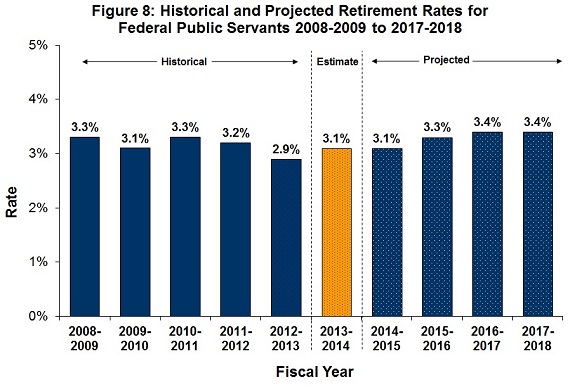
As shown in Figure 8, the retirement rate has declined slightly between 2008‑2009 and 2009‑2010 (from 3.3% to 3.1%) followed by a gradual increase in 2010-2011 (3.3%). Between 2010-2011 and 2012-2013 there was another decline in the retirement rate (from 3.3% to 2.9%). There were approximately 7,500 retirements in the FPS during 2012‑2013.
It should be noted that, as a result of Budget 2012 decisions, many employees who planned to retire during 2012-2013, left the FPS by accepting one of the Workforce Adjustment or Career transition (for executives) measures. This trend may have an impact on retirement rates, as evident in Figure 8.
The percentage of federal public servants eligible to retire as of March 31st, 2013 was 9.6%, up slightly from 9.4% in March 31st, 2012. Current retirees were recruited at a young age and had a long career in the FPS. In 2012‑2013, 54.5% of retired employees had 30 or more pensionable years of service, compared to only 28.0% in 1982‑1983.
Source: Office of the Chief Human Resources Officer, Treasury Board Secretariat.
Population: Indeterminate federal public servants, including employees who retire while on Leave without Pay.
Note: Projected retirement rates assume a decline in population for 2014-2015 and a stable population for the remaining years. If the overall population increases or decreases in the future, the rate will be affected.
5. Federal Public Service Years of Experience
Figure 9 shows the experience levels of the population of federal public servants over time, based on four ranges (bands) of years of experience. Compared to last year (2012), there has been a 4.5 percentage point decrease in the proportion of employees with 0-4 years of experience, and a 0.4 percentage point decrease for those with 25 and more years of experience. During the same period, the proportion of employees with 5-14 years of experience increased by 4.1 percent points, while the proportion of employees with 15-24 years of experience increased by 0.8 percentage points. The graph displays some projections on experience levels up to 2018.
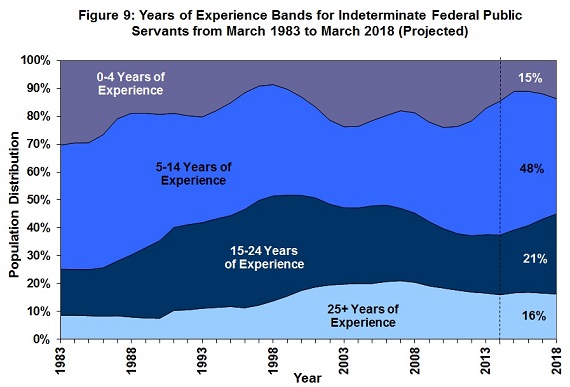
* Estimated for March 2014.
Source: Office of the Chief Human Resources Officer, Treasury Board Secretariat.
Note: The forecasted distribution is based on a decline in population for 2014-2015 and a stable population for the remaining years. This population also includes employees on Leave without Pay.
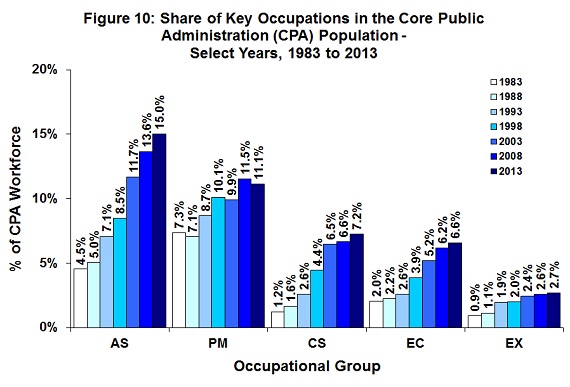
6. A Knowledge-Intensive Workforce in the Core Public Administration
Since 1983, employees undertaking more “knowledge‑intensive” work comprise an ever‑increasing share of the employee population in the Core Public Administration (CPA). This cadre of “knowledge workers” is highly skilled, with significant expertise gained through a combination of education and experience, and has strong abilities in strategic thinking and communications. This transformation has been in response to an increasingly demanding environment, new challenges, and technological advances over this period.
As evident in Figure 10, the share of employees in the five largest knowledge‑intensive occupational groups in the CPA (Administrative Services (AS); Program Administration (PM); Computer Systems (CS); Economics & Social Science Services (EC); and Executive (EX)) have increased or remained almost the same compared to the previous years. In 2013, these five occupational groups represent 42.6% of the CPA workforce, while they only represented 16.0% in 1983.
Source: Office of the Chief Human Resources Officer, Treasury Board Secretariat.
Notes:
The information provided is for the Core Public Administration only. The figure includes all employment tenures, active employees only (i.e. employees on Leave without Pay are excluded) and it is based on effective employment classification (i.e. acting appointments included). The information provided is based on March 31st data.
To provide a true picture of growth and share of occupations historically, this analysis excludes the Canada Revenue Agency (CRA), all CRA’s predecessors and the Canada Border Services Agency (CBSA). The CRA was a part of the Core Public Administration until 1999, after which it became a separate agency. The CBSA was created in 2003 as part of the Core Public Administration; a majority of its employees were transferred from the CRA.
The occupational groups are: Administrative Services (AS); Program Administration (PM); Computer Systems (CS); Economics & Social Science Services (EC); and Executive (EX).
On June 22, 2009, Economics, Sociology & Statistics (ES) and the Social Science Support (SI) occupational groups were converted to the Economics & Social Science Services (EC) occupational group. For consistency, all ES, SI and EC numbers have been combined in each year to create the EC occupational group.
Part II – Demographic Profile of Executives
This section provides demographic information for the FPS executive cadre, as well as for CPA employees at salary bands two levels immediately below (EX minus 1 and EX minus 2). See footnote 5
In general, Assistant Deputy Ministers (classified as EX 04s and EX 05s) fulfill the senior leadership function (i.e. providing strategic direction and oversight); while Directors General and Directors (classified as EX 01s to EX 03s) fulfill the executive function and are responsible for managing first line or other managers.
EX minus 1s and EX minus 2s are normally in the roles of managers and/or supervisors. Employees at these levels are the feeder groups for the executive cadre. These levels are considered an essential component of succession planning for the executive ranks.
1. Population Size of the Executive Group
There were 6,560 executives in the FPS as of March 31st, 2013. More than one half (52.6%) of executives are EX 01s and only 6.3% are EX 04s and EX 05s.
Between 2003 and 2013, the FPS executive population grew by 23.1%, while the FPS grew by 8.3% in the same period. Despite this growth trend, executives only accounted for 2.5% of the entire FPS population in 2013, up from 2.2% in 2003.
There was a 5.2% decrease in the number of FPS executives compared to the previous year (2012).
As of March 31st, 2013, there were 10,557 employees at the EX minus 1 level and 21,789 at the EX minus 2 level in the CPA. Employees at the EX minus 1 and the EX minus 2 levels represent approximately 16.1% of the CPA.
2. Executive Diversity
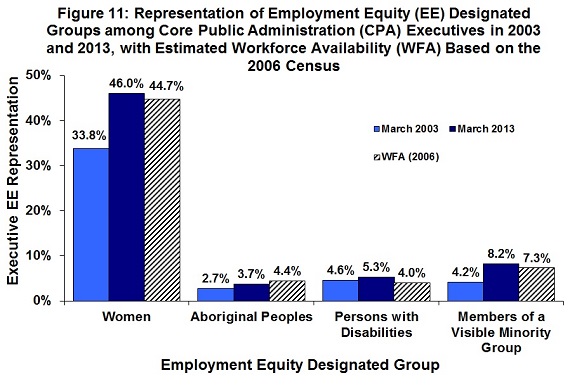
a) Employment Equity Designated Groups among Core Public Administration Executives
Figure 11 illustrates the CPA executive representation levels for all four employment equity groups in 2003 and in 2013.
Source: Office of the Chief Human Resources Officer, Treasury Board Secretariat.
Population: Data for the Core Public Administration (CPA) (departments and agencies for which the Treasury Board is the employer), including indeterminate employees and terms of three months or more, excluding employees on Leave without Pay.
Notes:
Workforce availability estimates are based on the 2006 Census.
The source of the representation data is the CPA Employment Equity Data Bank, which is populated with self-identification information provided by employees.
Please note March 2013 representation and WFA Numbers include EX, GX (General Executive Group) and LC (Law Management) classifications, whereas March 2003 representation excludes LCs, therefore the two years cannot be directly compared.
As evident in Figure 11 (above), as of March 2013, the CPA representation levels for all designated groups in the executive category, except for Aboriginal peoples, exceeded their respective workforce availability (WFA).
The proportion of women executives has risen significantly, with the number more than tripling since 1993.
In March 2013, the representation of women at the CPA executive level was 46.0% which is above their workforce availability of 44.7%.
The representation of persons with disabilities was 5.3%; 1.3 percentage points higher than their workforce availability of 4.0% and following the above pattern, the representation of members of visible minority group was 8.2%; 0.9 percentage points higher than their workforce availability of 7.3%. The representation level for Aboriginal peoples continues to be below its workforce availability (3.7% versus 4.4%).
Compared to last year (2012), the representation levels of all designated groups in the CPA increased or remained the same, with the exception of persons with disabilities, where the representation levels dropped slightly from 5.5% to 5.3%.
Focusing on the EX minus 1 level in the CPA, the representation of women in 2013 was 38.8% compared to a workforce availability of 37.6% (1.2 percentage points higher than its workforce availability). At the EX minus 2 level, the representation of women was higher and also above workforce availability (46.4% versus a workforce availability of 42.5%).
At the EX minus 1 level, representation is above the workforce availability for Aboriginal peoples (2.4% versus 1.5%), for persons with disabilities (5.0% versus 4.0%), and for visible minority employees (13.8% versus 13.7%).
These results are similar to those found at the CPA EX minus 2 level: Aboriginal peoples (4.0% versus a workforce availability of 2.0%); persons with disabilities (5.0% versus 4.0%); and visible minority employees (14.5% versus 12.5%).
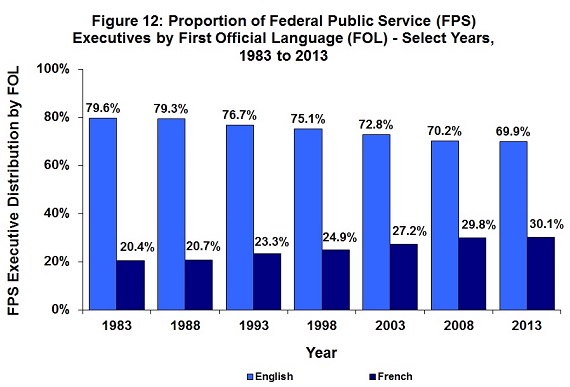
b) Language of Executives
Figure 12 shows that between 1983 and 2013, French has been identified by a growing percentage of executives in the FPS as their first official language (increasing from 20.4% to 30.1%). The current ratio in the executive cadre reflects the ratio in the wider FPS (71.1% identifying English versus 28.9% identifying French).
In 2013, French was the first official language of 28.4% of employees at the EX minus 1 level and 30.0% at the EX minus 2 level in the CPA.
Source: Office of the Chief Human Resources Officer, Treasury Board Secretariat.
Population: Includes all Federal Public Service executives, specifically, Core Public Administration executives and their equivalents in separate agencies (such as Executive Group (EC) and Management Group (MG) classifications) in all tenures (indeterminate, term and casual). It does not include executives on Leave without Pay. The information provided is based on March 31st data.
3. Age of Executives in the Federal Public Service
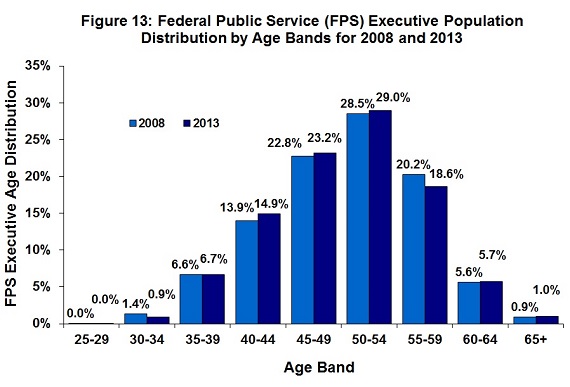
The age distributions of FPS executives for 2008 and 2013 are compared in Figure 13. The proportion of executives under 50 years of age increased from 44.8% in 2008 to 45.8% in 2013. In 2012, the percentage was 46.3%. The proportion of FPS executives over 50 during this period decreased from 55.2% in 2008 to 54.2% in 2013.
There are slight changes in the proportion of executives in each age band between 2008 and 2013. The proportion of executives in the age band marking the age range of 55-59 years decreased from 20.2% in 2008 to 18.6% in 2013. The proportion of executives in the age band marking the age range of 40-44 years increased (from 13.9% in 2008 to 14.9% in 2013).
The average age of executives in the FPS decreased between 2008 and 2013 (from 50.4 years in 2008 to 50.3 years in 2013).
Source: Office of the Chief Human Resources Officer, Treasury Board Secretariat.
Population: Includes all Federal Public Service executives, specifically, Core Public Administration executives and their equivalents in separate agencies (such as Executive Group (EC) and Management Group (MG) classifications) in all tenures (indeterminate, term and casual). It does not include executives on Leave without Pay. The information provided is based on March 31st data.
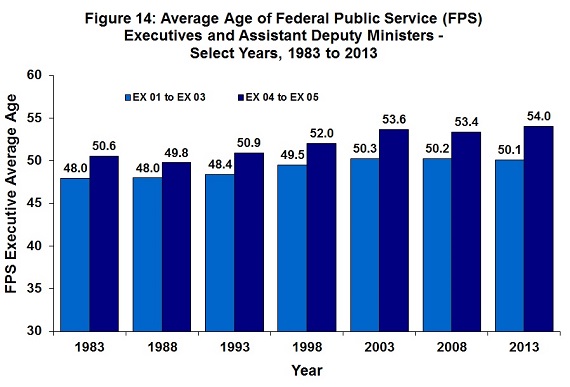
Figure 14 shows that, since 2003, there has been relative stability in the average age of executives in the FPS at both the EX 01 to EX 03 levels and the EX 04 to EX 05 levels.
Source: Office of the Chief Human Resources Officer, Treasury Board Secretariat.
Population: Includes all Federal Public Service executives, specifically, Core Public Administration executives and their equivalents in separate agencies (such as Executive Group (EC) and Management Group (MG) classifications) in all tenures (indeterminate, term and casual). It does not include executives on Leave without Pay. The information provided is based on March 31st data.
The average ages in 2013 for the various employee populations described in this document are summarized below:
- Federal Public Service: 44.8 years
- Executives (FPS): 50.3 years
- EX 01 to EX 03 (FPS): 50.1 years
- EX 04 to EX 05 (FPS): 54.0 years
- EX minus 1 (CPA): 47.9 years
- EX minus 2 (CPA): 45.5 years
Footnotes
Return to footnote reference 1 The “Federal Public Service” refers to the Core Public Administration (CPA) (departments and agencies for which the Treasury Board is the employer) and separate agencies (principally the Canada Revenue Agency, Parks Canada, the Canadian Food Inspection Agency and the National Research Council Canada), as named in Schedule I, IV and V of the Financial Administration Act.
Return to footnote reference 2 The current workforce is compared primarily to that from 1983, the first year for which the Treasury Board Secretariat has complete data. Other comparison years are used, either due to data limitations or to avoid excessive detail in the graphics.
Return to footnote reference 3 Statistics Canada (CANSIM table 051-0005, Quarter 2 Data).
Return to footnote reference 4 Workforce availability (WFA) for an Employment Equity designated group is the percentage of citizens working in occupations in the Canadian workforce that correspond to occupations in the Federal Public Service (FPS), with the data being derived from the 2006 Census statistics. WFA estimates for the FPS and the Core Public Administration (CPA) are based on the 2006 Census.
Return to footnote reference 5 Data for the EX minus 1 and EX minus 2 levels in the Core Public Administration was provided for the first time in the demographic annex of the Seventeenth Annual Report to the Prime Minister on the Public Service of Canada. Since then, the methodology for defining the EX minus 1 and EX minus 2 levels has evolved, using salary bands to define groups and levels. Due to changes in methodology, figures for EX minus 1 and EX minus 2 levels are not comparable to previous years.
- Date modified: