Common menu bar links
Breadcrumb Trail
Institutional links
Chief Information Officer Branch
IT Project Review and Oversight
Enhanced Management Framework
ARCHIVED - Establishing the Baseline - Government-Wide Summary and Analysis of IT Project Practices
 This page has been archived.
Archived Content
Information identified as archived on the Web is for reference, research or recordkeeping purposes. It has not been altered or updated after the date of archiving. Web pages that are archived on the Web are not subject to the Government of Canada Web Standards. As per the Communications Policy of the Government of Canada, you can request alternate formats on the "Contact Us" page.
3. Workshop Results
This section provides the workshop results summarized across participating departments, a detailed analysis of these overall results, and guidelines for reading and interpreting them. Where applicable, observations by the authors have been provided.
3.1 How to Read and Interpret the Results
The purpose of the baseline is to stimulate government departments to improve their ability to successfully manage and deliver IT projects. The results presented in this section must be read and interpreted within this context. While the results provide valuable insight into the government's project management and delivery capability, it must be understood that the population surveyed constituted only a small sample of the entire IT practitioner and manager knowledge base. Readers must be careful to neither jump to hasty conclusions, nor judge the government's IT project management and delivery capabilities solely on the basis of this baseline.
Specific departmental baseline components can be compared against the various summary profiles provided in this report. Several analyses have been conducted and can be used for different comparisons. These comparisons can provide some indication regarding the department's position vis-�-vis other departments.
3.2 Results
3.2.1 Overall Results
Overall results are given first, in order to provide an overview of the state of implementation of project practices across the government.
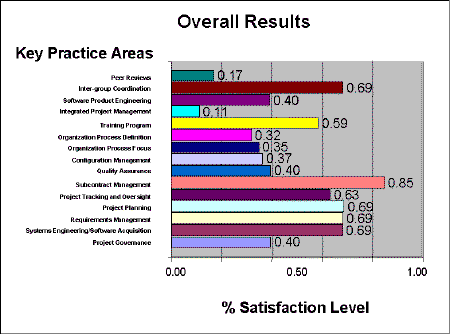
Figure 1 below presents the overall results. Each bar on the graph represents the percentage of satisfaction level for each Key Practice Area. Practices are on the "Y" axis while practice satisfaction levels are represented on the "X" axis.
Figure 1. Overall Results
Observations
The practices that achieved the highest satisfaction levels include:
- Subcontract management (85%);
- Requirements management (69%);
- Inter-group coordination (69%);
- Project planning (69%);
- Systems Engineering/Software Acquisition (69%); and
- Project tracking and Oversight (63%).
The practices that achieved the lowest satisfaction levels include:
- Integrated project management (11%); and
- Peer reviews (17%).
Analysis of Overall Results
Analysis of the overall results identify definite strengths in the management and delivery of IT projects as shown above.
Areas of improvement include:
- Project Governance. Departments scored particularly low in the areas of Project Governance and risk-based decision-making as defined in the Enhanced Framework. More specifically, departments scored 20% in the area of clear competency requirements for project managers, and 30% in using risk-mitigating techniques such as clearly defined gates, structured risk management, function point analysis, and earned value management;
-
Process Focus and Process Definition. Few departments consistently develop and improve standard processes for use in projects. Whereas 70% said that the role of defining and maintaining standard processes existed within the organization, they scored less than 30% in:
- developing action plans to address process deficiencies;
- training individuals on process;
- planning for process development or improvement activities; or
- making process assets available within departments for re-use.
- Integrated Project Management. Organizations scored 11% on average in the area of project management methodology, and most do not have standard procedures to collect effort, cost, and schedule progress information;
- Software Product Engineering. Core to the delivery of IT projects, departments scored less than 40% in the area of Software Product Engineering (for example, Software/System Life Cycle or Software/System Development Methodology);
- Configuration Management/Quality Assurance. Departments had a satisfaction level of less than 40% in the areas of configuration management and quality assurance. Whereas the low satisfaction level for these processes was mostly due to inconsistencies in their implementation, some departments did not perform these processes at all.
- Peer Reviews. Departments scored 17% in the area of Peer Reviews as part of their approach to managing and delivering IT projects; and
- Collection and Management of Historical Data. Less than 10% of departments, on average, collected and managed historical data for current and future use in support of the planning process or process improvement initiatives.
3.2.2 Weighted Results
The same results are presented using a weighting factor. The weighting factor takes into account the relative size of each department, based on the amount of money it spends on IT relative to the total expenditure of the population of departments examined.
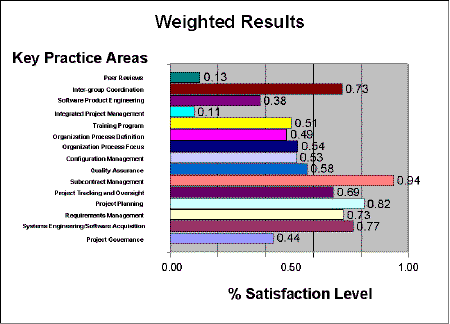
Figure 2 below portrays the weighted results.Each bar on the graph represents the weighted percentage of satisfaction levels for each Key Practice Area. The weighting factor was determined by computing the ratio of a department's IT expenditure over the total IT expenditure of the entire population of departments involved in this study. Weighted results were then obtained by adding the products of each department's satisfaction level and weighting factor. Practices are on the "Y" axis and satisfaction levels are represented on the "X" axis.
Figure 2. Weighted Results
Observations
The impact of the weighting factors on the overall results was generally positive, increasing the satisfaction levels of the following best practices:
- Subcontract management (94%, up 9%);
- Requirements management (73%, up 4%);
- Inter-group coordination (73%, up 4%);
- Project planning (82%, up 13%);
- Systems Engineering/Software Acquisition (77%, up 8%), and
- Project tracking and oversight (69%, up 6%).
The practices that achieved the lowest satisfaction levels include:
- Integrated project management (even at 11%); and
- Peer reviews (13%, down 4%).
Analysis of Weighted Results
Weighted results generally improve the government's overall performance. This is primarily due to more mature processes found in larger departments.
3.2.3 Overall Results by IT Expenditure Category
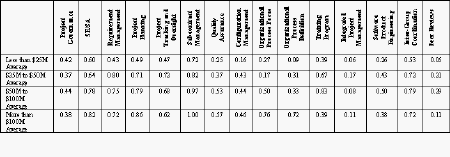
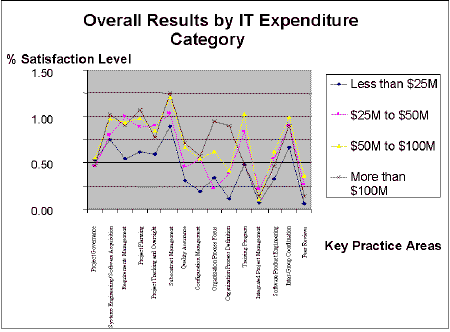
The overall results are categorized based on the size of IT expenditure in order to allow readers to compare departmental performance against those in the same IT expenditure range. These results are provided in Table 1 below and in a graphical presentation in Figure 3. For the purpose of this report, four categories were identified:
- Departments with IT expenditures less than $25M (5 departments);
- Departments with IT expenditures exceeding $25M, but less than $50M (8 departments);
- Departments with IT expenditures exceeding $50M, but less than $100M (4 departments); and
- Departments with IT expenditures exceeding $100M (3 departments).
IT expenditures were confirmed during the results validation process with the departments. Expenditures include all IT related expenditures (software development and maintenance as well as infrastructure capital and O&M expenditures).
Table 1. Overall Results by IT Expenditure Category
Table 1 is depicted below graphically.
Figure 3. Overall Results by IT Expenditure Category
Analysis of Results by IT Expenditure Category
Few trends can be identified from the results by IT Expenditure Category, other than the fact that there seems to be a correlation between the size of the department and the satisfaction level for each practice. In general, the bigger departments (that is, departments with the larger IT expenditures), are better at implementing and consistently applying processes. Nevertheless,
departments in the $50M to $100M category generally appear more satisfied with project practices than those in the over $100M or more category. These results can be explained in many ways, including the fundamental fact that departments with larger IT expenditures have the opportunity to repeat management and delivery processes more often and consequently they become better at it.
3.2.4 Results by IT Management Model
The overall results are presented with departments characterized as having either a "decentralized" or a "centralized" mode of IT management. Some departments have a central IT organization that essentially does "everything" for its clients. Others have a decentralized IT capability where the responsibility for networks, the computing infrastructure and applications are shared among
several groups. The responses of these two classes of departments were different, and the TBS PMO representatives wanted to allow departments to compare themselves against departments with the same management style as their own.
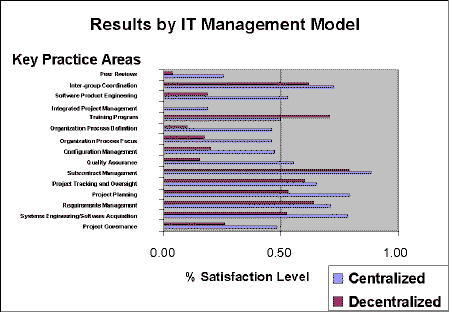
Figure 4 below provides a graphical representation of the results by IT Management Model. The lower bar of each pair represents the percentage of satisfaction levels for each practice achieved by the centralized departments. The upper bar represents the percentage of satisfaction levels for each practice achieved by the decentralized departments. Practices are on the "Y" axis and satisfaction levels are represented on the "X" axis.
Figure 4. Results by IT Management Model
Analysis of Results by IT Management Model
Results of the baseline categorized by management models reveal an interesting trend. It appears that centralized IT Management Models consistently achieve better satisfaction levels for the 15 key process areas with the exception of training. This trend may be explained by the fact that the departments that centralize the management of IT can better control their practices and the
resources implementing the processes. Upon reflection, this is an unsurprising and predictable result. However, there are many valid business reasons for decentralizing the management of IT and readers are reminded not to jump to hasty conclusions. Departments with a decentralized IT management model may wish to baseline the practices in different areas and use the result to identify
best practices and leverage them throughout the department.
3.2.5 Results by IT Service Delivery Model
The results are presented with departments characterized as having either an "in-source" or "out-source" IT service delivery mode. Some departments have considerable programming staff and do most of their work using internal resources. When using contracted resources, these departments will likely retain the overall responsibility for the project outcomes. Others use contracted
resources to do most of the IT project-oriented work. These departments tend to transfer most of the risks to these contracted resources. Again, the issues associated with each approach are different, and departments may find it useful to compare against others in their own IT service delivery category.
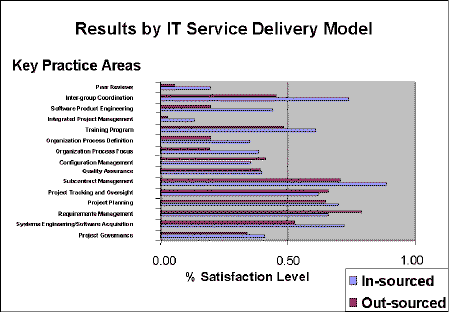
Figure 5 below provides a graphical representation of the results by IT Service Delivery Model. The lower bar of each pair on the graph represents the percentage of satisfaction levels for each practice achieved by the "in-sourcing" departments. The upper bar represents the percentage of satisfaction levels for each practice achieved by the "out-sourcing" departments. Practices are on the "Y" axis; and satisfaction levels are represented on the "X" axis.
Analysis of Results by IT Service Delivery Model
Overall results categorized by IT Service Delivery Models are also revealing with respect to the levels of satisfaction. It appears that in-sourced departments achieve better levels of satisfaction across all Key Practice Areas with the exception of requirements management, project tracking and oversight, and configuration management. Once again, this trend may be attributable to the
fact that the departments that in-source the delivery of IT can better control their practices and the resources implementing the processes.
Figure 5: Results by IT Service Delivery Model
3.2.6 Mapping the Results Against the Enhanced Framework Targets
This section maps the overall results to the objectives set out by the PMO in the Enhanced Framework II: Solutions: Putting the Principles to Work. This document sets improvement targets in terms the following plateaus:
- Plateau 0 (March 1998). Ensure that departments have in place the basic project solutions required to initiate and manage projects, and that they have plans for advancing to the next plateaus;
- Plateau 1 (March 1999). Achieve proper planning for projects and establish sufficient visibility into actual progress to allow senior management to take effective action when the project deviates from the plan;
- Plateau 2 (March 2000). Establish, at a project level, consistent and effective controls and processes that will ensure that requirements are managed, that the product integrity is maintained throughout the life of the project, and that the quality of the product is within the defined parameters;
- Plateau 3 (March 2002). Make the practices found in Plateaus 0-2 the way that government departments do business for all their projects; and
- Plateau 4 (On-going). Improve the organizational effectiveness of departments on a continuous basis when managing and delivering projects.
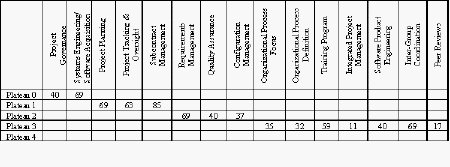
In order to get a better sense of the overall results against these plateaus, Table 2 maps practice satisfaction levels to each plateau.
Table 2: Mapping the Results Against the Enhanced Framework Targets8
Analysis of the Mapping Results against the Enhanced Framework Targets
An area of real concern, also identified above in Section 3.2.1, is Project Governance as outlined in the Enhanced Framework. The activities involved are those that get the right project off on the right track: an effective governance structure within the department; a sound business case approach to selecting projects; a definitive project charter and a clear accountability
structure; a disciplined approach to training, developing and selecting project managers; and an effective risk management regime. All are key to the successful management and delivery of IT projects and it is particularly vital that this foundation be established properly.
Understanding that higher level practices can seldom be improved without the benefit of consistently implemented practices at the lower levels, this analysis provides guidance and direction to focus government-wide improvement initiatives.
3.2.7 Mapping the Results against the OAG findings
This section examines the baseline results against those of the OAG's main issues emerging from their review process of systems under development for the past three years (1995 to 1997)9. The latter results can be found on the OAG's web site at www.oag-bvg.gc.ca. OAG main issues are provided in the first column, along with the year they were identified (second column). Corresponding baseline references and satisfaction levels identified in the baseline are provided in the last two columns. Numbers in the third column refer to the questions found in Appendix 1
(PG=Project Governance, SE=Systems Engineering/Software Acquisition, CMM=Capability Maturity Model).
| Auditor General's Findings | OAG Ref. | Baseline Ref. | Average Satisfaction Levels |
|---|---|---|---|
| Smaller chunks for projects | OAG '95 | PG 4.1, PG 4.2, PG 4.3 |
.35 |
| Effective project sponsorship | OAG '95 | PG 2.1 | .70 |
| Clearly defined requirements | OAG '95 | CMM 1 | .69 |
| Effective user involvement | OAG '95 | SE 1 CMM 12 CMM 1.1,1.4, 2.3, 2.5, 3.5 |
.75 |
| Dedicated resources to projects | OAG '95 | PG 2.4, PG 4.8, CMM 11.8 | .59 |
| Taking charge | OAG '96 | PG 2 | .58 |
| Define requirements | OAG '96 | CMM 1 | .69 |
| Improve software development processes | OAG '96 | CMM 7, CMM 8 |
.34 |
| Setting priorities | OAG '96 | PG 1 | .56 |
| Measuring status of projects | OAG '96 | PG 4.7, PG 4.1 CMM 3 |
.44 |
| Implementing new government guidelines | OAG '96 | CMM 7, CMM 8 |
.34 |
| Planning | OAG '97 | CMM 2 | .69 |
| Oversight | OAG '97 | PG 4.7, PG 4.1 CMM 3 |
.44 |
| Quality assurance | OAG '97 | CMM 5 | .40 |
Analysis of the Mapping Results against the OAG findings
Mapping the Baseline results to the OAG findings identifies similar deficiencies in project management and delivery practices. Nonetheless, the baseline report identified possible improvements in the areas of:
a. Project sponsorship;
b. Requirements management;
c. User involvement; and
d. Planning.

