
Treasury Board of Canada Secretariat
www.tbs-sct.gc.ca
Common menu bar links
Breadcrumb Trail
ARCHIVED - Canadian International Development Agency
 This page has been archived.
Archived Content
Information identified as archived on the Web is for reference, research or recordkeeping purposes. It has not been altered or updated after the date of archiving. Web pages that are archived on the Web are not subject to the Government of Canada Web Standards. As per the Communications Policy of the Government of Canada, you can request alternate formats on the "Contact Us" page.
Section III: Supplementary Information
Financial highlights
| Condensed statement of financial position At end of year (March 31, 2009) |
% change | 2009 | 2008 |
|---|---|---|---|
| Assets | |||
| Total assets | 13.4% | 430,970 | 373,069 |
| Total | 13.4% | 430,970 | 373,069 |
| Liabilities | |||
| Total liabilities | 30.6% | 641,971 | 445,653 |
| Equity | |||
| Total equity | 65.6% | 211,001 | 72,584 |
| Total | 13.4% | 430,970 | 373,069 |
| Condensed statement of financial position At end of year (March 31, 2009) |
% change | 2009 | 2008 |
|---|---|---|---|
| Expenses | |||
| Total expenses | 14.2% | 3,480,700 | 2,986,274 |
| Revenues | |||
| Total revenues | 48.6% | 206,667 | 106,126 |
| Net cost of operations | 12.0% | 3,274,033 | 2,880,148 |
Assets
Total assets have increased by $57 million due to an increase of $84 million in prepaid contributions using pool funding
payments and a program-based approach, a return of capital of $9.6 million from the Canada Investment Fund for Africa, and
decreases of $16.8 million in net loans mostly due to reimbursements and variations in discounts and allowances on these
loans.
Liabilities
Total liabilities have increased by $196 million, largely explained by the significant amount of funding that CIDA received
two days prior to year-end through Supplementary Estimates C, thereby contributing to the increase in accounts payable and
accrued liabilities of $269 million; the decrease in accrued liabilities of $59 million due to the numerous payments made
throughout the year to settle liabilities relating to the 2004 tsunami and Pakistan matching funds programs; and by a decrease
of $19 million in notes payable to International Financial Institutions (IFI) due to the timing of transactions following
an agreement.
Expenses
Total expenses have increased by $494 million, primarily due to an increase in transfer payments spending for food aid and
humanitarian assistance in multilateral and global partnerships, more focus on Africa spending, as well as increased spending
in the Americas (Haiti) and on Afghanistan programs.
Revenues
The increase of $101 million in revenues can be mainly explained by an increase of $74 million in the gain on foreign exchange
for revaluation of notes payable yet to be encashed by IFIs as well as on allowances on advances and investments, and by
an adjustment of $24 million to the unamortized discount on loans due to a review of the calculations related to the net
present value of loans to developing countries undertaken in 2008–2009.
Financial statements
The complete financial statements54 are available on CIDA's website.
Financial highlights charts
As indicated on page 3 above, CIDA's expenses are distributed against the following five program activities:
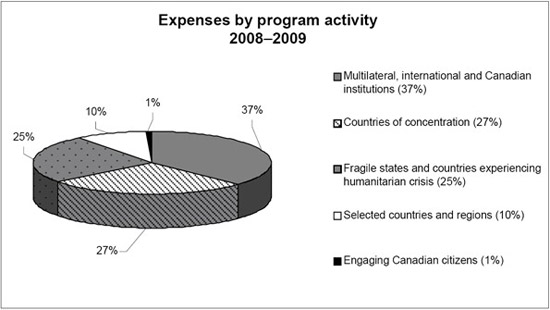
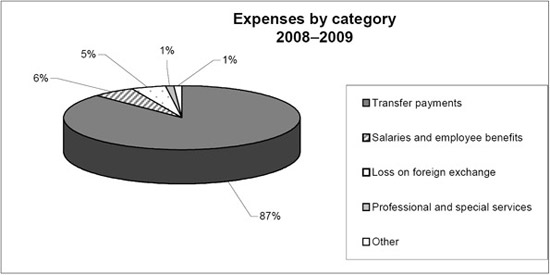
The vast majority of CIDA's expenses take the form of transfer payments for a wide variety of programs aimed at reducing poverty in the developing world.
CIDA's programs can be divided in the following seven sectors of focus:
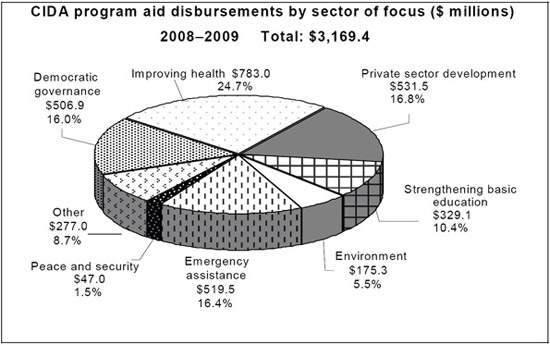
Notes:
- in millions of dollars, excluding administrative costs ($250.80 million) and loss on investments ($163.27 million)
- "Other" includes higher education, promotion of development awareness, support to civil society
In 2008–2009, CIDA bilateral disbursements were distributed as follows:
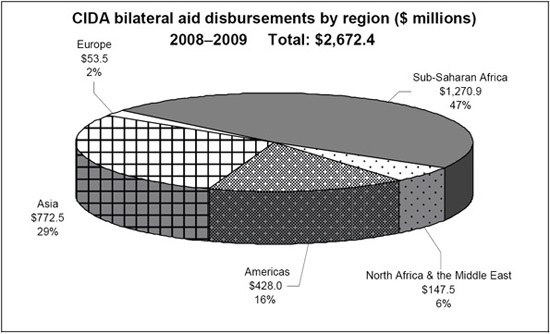
Notes:
- " bilateral " excludes core funding to multilateral organizations
- in millions of dollars, excluding administrative costs ($250.80 million) and loss on investments ($163.27 million)
More details on disbursements by sectors and countries are available in CIDA's statistical reports.55 A statistical report for 2008–2009 will be published by the end of March 2010.