
Treasury Board of Canada Secretariat
www.tbs-sct.gc.ca
Common menu bar links
Breadcrumb Trail
ARCHIVED - Environment Canada
 This page has been archived.
Archived Content
Information identified as archived on the Web is for reference, research or recordkeeping purposes. It has not been altered or updated after the date of archiving. Web pages that are archived on the Web are not subject to the Government of Canada Web Standards. As per the Communications Policy of the Government of Canada, you can request alternate formats on the "Contact Us" page.
Section III: Supplementary Information
Financial Highlights
The financial highlights presented within this Departmental Performance Report are intended to serve as a general overview of Environment Canada’s financial position and operations. The detailed unaudited departmental financial statements can be found on Environment Canada’s website.
Environment Canada’s unaudited financial statements are prepared in accordance with accrual accounting principles and, therefore, are different from appropriations-based reporting, which is reflected in Sections I and II of this report. Sections I and II are prepared on a modified cash basis, and not an accrual basis. A reconciliation between Parliamentary Appropriations used (modified cash basis) and the Net Cost of Operations (accrual basis) is set out in Notes 2 and 3 of Environment Canada’s unaudited financial statements at www.ec.gc.ca/dpr-rpp/index_e.htm.
|
Condensed Statement of Operations At End of Year (March 31, 2009) |
% Change | 2009 | 2008 |
|---|---|---|---|
| EXPENSES | |||
| Total Expenses | 18% | $ 1,237,755 | $ 1,050,121 |
| REVENUES | |||
| Total Revenues | 1.5% | $ (81,239) | $ (80,071) |
| NET COST OF OPERATIONS | 19% | $ 1,156,516 | $ 970,050 |
| Condensed Statement of Financial
Position At End of Year (March 31, 2009) |
% Change | 2009 | 2008 |
|---|---|---|---|
| ASSETS | |||
| Total Assets | 5% | $ 374,720 | $ 355,251 |
| TOTAL | 5% | $ 374,720 | $ 355,251 |
| LIABILITIES | |||
| Total Liabilities | -1% | $ 503,719 | $ 507,892 |
| EQUITY | |||
| Total Equity | -15% | $(128,999) | $(152,641) |
| TOTAL | 5% | $ 374,720 | $ 355,251 |
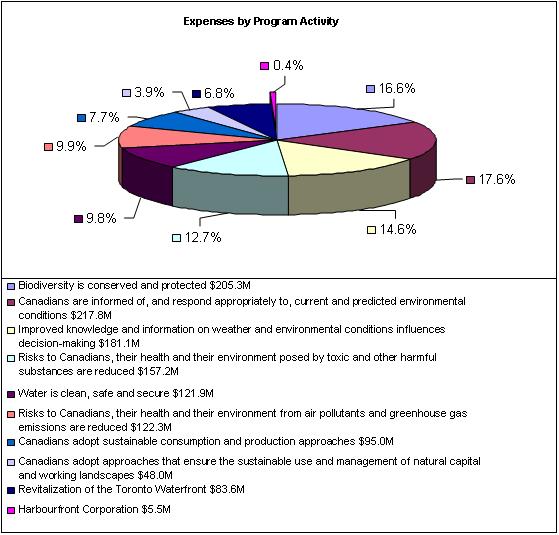
Total Departmental expenses have increased by $188 million or 18 percent from $1,050 million in 2007-2008 to $1,238 million in the current year. This increase (approximately $109 million) is attributable in large part to increases in corporate internal services. This includes a year-over-year increase in employee benefits ($30 million) and a further $9.5 million increase in services provided without charges. Corporate services expenditures are reallocated to all program activities in a manner consistent with previous years. Other increases (approximately $80 million) in total expenses are attributable to increases in direct program activities and costs (e.g. expenses in support of the hydrometric program that are recovered from provincial governments; and incremental expenditures in the Enforcement program, the Chemicals Management Plan, Clean Air Regulatory Agenda and Vehicle Scrappage, among others). In addition, the Toronto Waterfront Revitalization Initiative expenses increased by $40 million and relate almost exclusively to contribution payments.
See Note 4 - Expenses to the departmental financial
statements at www.ec.gc.ca/dpr-rpp/index_e.htm.
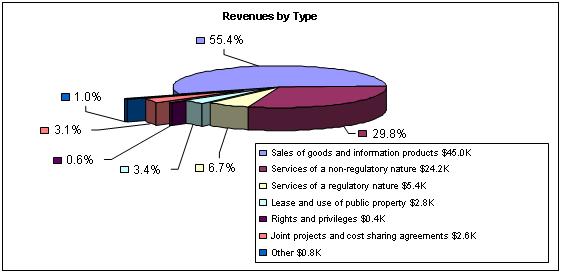
Total revenues amounted to $81.2 million for 2008-2009. The majority of the revenue was derived from Environment Canada activities under the “Canadians are informed of, and respond appropriately to, current and predicted environmental conditions” Program Activity.
Major revenue items include ocean disposal permit applications, hydraulics laboratory, and ocean disposal monitoring fees. Environment Canada has had a significant increase in internal revenues from other government departments generated from interdepartmental agreements (i.e. Transport Canada and Canadian Space Agency in the Atmospheric Science program). Environment Canada has also had increased revenue from its Upper Air Program at Eureka.
See Note 5 - Revenues to the departmental financial
statements at www.ec.gc.ca/dpr-rpp/index_e.htm.
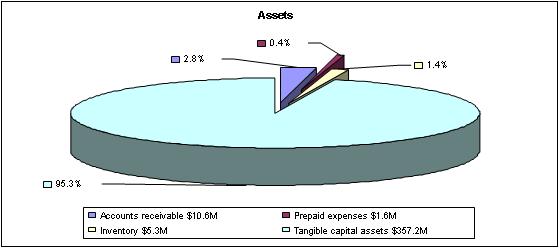
The increase in assets is mainly due to an increase in net book value of tangible capital assets of $16.1 million (from $341.1 million in 2007-2008 to $357.2 million in 2008-2009), which is the net result of acquisitions of $50.8 million, net disposals and write-offs of $1.2 million and amortization totalling $33.4 million.
See Notes 6 and 7 - Accounts receivable and advances; and
Tangible Capital Assets to the departmental financial
statements at www.ec.gc.ca/dpr-rpp/index_e.htm.
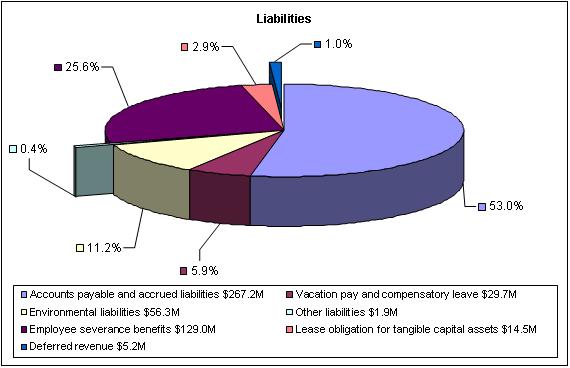
Total liabilities were $503.7 million at the end of 2008-2009, a decrease of $4.2 million (1 percent) from the previous year’s total liabilities of $507.9 million. The Accounts Payable and Accrued Liabilities, while showing a decrease of $30 million from 2007-2008, continue to represent the largest component of liabilities at $267.2 million or 53 percent of total liabilities. Severance benefits, on the other hand, show an increase of $25 million over last year.
See Notes 8 through 12 to the departmental financial
statements at www.ec.gc.ca/dpr-rpp/index_e.htm.
Supplementary Information Tables
All electronic supplementary information tables found in the 2008-2009 Departmental Performance Report can be found on the Treasury Board of Canada Secretariat's website at www.tbs-sct.gc.ca/dpr-rmr/2008-2009/index-eng.asp.
Table 1: Sources of Respendable and Non-Respendable
Revenue
Table 2: User Fees and External Fees
Table 3: Details on Project Spending
Table 4: Status Report on Major Crown Projects *
Table 5: Details on Transfer Payment Programs
Table 6: Up-Front Multi-Year Funding (formerly Foundations
[Conditional Grants])
Table 7: Horizontal Initiatives
Table 8: Sustainable Development Strategy
Table 9: Green Procurement
Table 10: Response to Parliamentary Committees and External
Audits
Table 11: Internal Audits and Evaluations
* A "major Crown project" is any project that costs more than $100 million and is considered high risk. Environment Canada does not currently have such a project.
Other Items of Interest
The following information is part of Environment Canada’s Supplementary Information to the 2008-2009 Departmental Performance Report (DPR).
Strategic Integration and Corporate Services, Management Accountability Framework and Indicators of Environmental Sustainability are introduced as Other Items of Interest in the following section, while detailed performance information on each item can be found on the Department’s website at www.ec.gc.ca/dpr-rpp/index_e.htm.
Strategic Integration and Corporate Services (Internal Services)
Clear, consistent and integrated departmental policy advice, coordinated interactions with partners and stakeholders, and effective communication all help Environment Canada deliver on its mandate and commitments. The Department continues to make significant efforts to reposition its corporate services to better support results-based management and achieve value for money for Canadians.
In October 2008, Environment Canada's management team brought together the enabling functions of Strategic Integration and Corporate Services under the heading of Internal Services in response to the revised Profile of the Government of Canada's Internal Services categories. For more information on the revised categories for Internal Services, go to the Treasury Board of Canada Secretariat's website. Starting with the Main Estimates for the 2009-2010 fiscal year, Internal Services will be shown as a distinct Program Activity.
Detailed information on this item can be found in the document entitled "Other Items of Interest", available electronically on Environment Canada's website.
Management Accountability Framework (MAF)
In the Round VI (2008-2009) MAF Assessment, Environment Canada maintained a similar level of performance compared to the previous year, receiving 2 "Strong", 11 "Acceptable", and 8 "Opportunity for Improvement" ratings. The Department recognizes the need to bring out sustained improvement and to proactively demonstrate its capacity to build on successes and lessons learned through its Departmental MAF Action Plan. The annual MAF Action Plan addresses departmental priorities linked to MAF, including areas rated as "Opportunity for Improvement", and management areas where the Department has performed well but continues to strive for excellence.
Detailed information on this item can be found in the document entitled "Other Items of Interest", available electronically on Environment Canada's website.
Indicators of Environmental Sustainability
Environment Canada, Statistics Canada and Health Canada are working together to further develop and communicate national environmental indicators of air quality, greenhouse gas emissions and freshwater quality. These indicators are reported in the Canadian Environmental Sustainability Indicators (CESI).10
While some trends are declining in the context of the subject areas in which they apply, determining the overall status of these areas based solely on current and limited indicators is inherently difficult. These indicators provide instead a proxy of overall status with respect to these areas, as can best be determined at this time. The indicators are, however, continually being refined and updated so that they better represent what they are intended to measure for use by both policy makers and the public.
Also, CESI brings together environmental information from federal, provincial and territorial governments, which share responsibility for environmental management in Canada. Consequently, the trends and values of these indicators are not solely attributable to Environment Canada's actions, but indicative of the environmental results achieved collectively by various levels of government as per their responsibilities for the environment.
The table below provides an overview of CESI and other measurements for key indicators of environmental sustainability.
| Trend | Indicator | Overview |
|---|---|---|
| ▼ Declining |
Biodiversity11 | The Committee on the Status of Endangered Wildlife in Canada is a group of experts that determines which wildlife species are in danger of disappearing from Canada. In May 2009, the group reassessed the status of 226 of the 585 at-risk species. Only 13 percent (30 species) of the 226 species re-assessed have improved status and are either no longer at risk or are in a lower risk category. The status of 27 percent (62 of those species) worsened and 59 percent (134 species) did not show improvement. |
| ▼ Declining |
Air quality | Ground-level ozone, a key component of smog, can harm human health, including causing lung and respiratory problems. Nationally, human exposure to ground-level ozone levels increased 13 percent between 1990 and 2007, and increased 2 percent from 2006 to 2007. |
| -- No Trend |
Freshwater quality | The ability of Canada’s lakes, rivers and streams to support aquatic life has been evaluated as a way of measuring water quality and the impacts of water pollution. Of the 154 representative sites monitored across Canada from 2005 to 2007, freshwater quality was rated as “excellent” at 6 percent of the sites. It was rated as “good” at 34 percent, “fair” at 42 percent, “marginal” at 14 percent, and “poor” at 4 percent. |
| ▼ Declining |
Greenhouse gas emissions | Greenhouse gas emissions trap heat in the atmosphere and warm the planet. The results of this warming include rising sea levels and more frequent severe storms and heat waves. Canada’s greenhouse gas emissions increased by 26 percent between 1990 and 2007. Emissions in 2007 were 4 percent higher than in 2006 and set a new peak for emission levels—0.8 percent higher than the previous peak in 2004. |
| ▲ Increasing |
Protected areas12 | Protected areas, such as the boreal forest or an ocean shelf, are lands or waters where human activity is limited and conservation is ensured for habitats and natural landscapes. In 2009, 9.4 percent of Canada’s landmass and about 0.6 percent of Canada’s marine territory were under protection. There has been an almost 90 percent increase in the overall area protected since 1990. |
Legend
▲ Improving performance
-- No definitive trend noted at this time (due to a lack
of trend data, relatively stable performance and trends, or
multiple measures with opposing trends)
▼ Declining performance
Detailed information on this item can be found in the document entitled "Other Items of Interest", available electronically on Environment Canada's website.
10 Environment Canada, Canadian Environmental Sustainability Indicators www.ec.gc.ca/indicateurs-indicators/
11 Biodiversity is not included in CESI. Information on this indicator of environmental sustainability is available on the Committee on the Status of Endangered Wildlife in Canada's website.
12 Protected Areas is a new indicator that will be included in the upcoming CESI 2009 report.