
Common menu bar links
Breadcrumb Trail
ARCHIVED - RPP 2007-2008
Canadian Intergovernmental Conference Secretariat
 This page has been archived.
Archived Content
Information identified as archived on the Web is for reference, research or recordkeeping purposes. It has not been altered or updated after the date of archiving. Web pages that are archived on the Web are not subject to the Government of Canada Web Standards. As per the Communications Policy of the Government of Canada, you can request alternate formats on the "Contact Us" page.
SECTION III - SUPPLEMENTARY INFORMATION
Organizational Information
The CICS is an agency of both the federal and provincial governments and, as such, acts as a neutral intergovernmental body. Its budget is supported by both orders of government and its staff include both federal, provincial and territorial public servants. The Secretary reports to all governments annually. The operations are reviewed by federal and provincial senior officials designated by their respective First Ministers. The CICS reports to Parliament through the President of the Queen’s Privy Council for Canada.
CICS Organization Structure
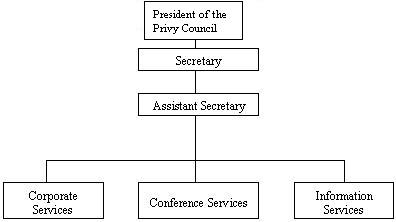
CICS services include pre-conference planning and coordination; the set-up of conference site facilities; secretaryship; interpretation; the translation, printing, distribution and control of documents; media relations; security; and the provision of technical equipment and secretarial and technical assistance which includes informatics.
In addition to the above conference services which are available anywhere in Canada, a document archives is maintained by the Secretariat for the use of governments. The Secretariat has also its world wide web site containing not only pertinent information on the organization and its activities but most importantly, conference communiqués released immediately after the close of major conferences we serve.
Table 1: Departmental Planned Spending and Full Time Equivalents
| ($ millions) | Forecast Spending 2006-2007 |
Planned Spending 2007-2008 |
Planned Spending 2008-2009 |
Planned Spending 2009-2010 |
|
|
||||
| Canadian Intergovernmental Conference Secretariat | 6.4 | 6.5 | 6.5 | 6.5 |
|
|
||||
| Budgetary Main Estimates (gross) | 6.4 | 6.5 | 6.5 | 6.5 |
|
|
||||
|
|
||||
| Total Main Estimates/Planned Spending | 6.4 | 6.5 | 6.5 | 6.5 |
| Total Planned Spending | 6.4 | 6.5 | 6.5 | 6.5 |
|
|
||||
| Less: Non-Respendable revenue | 1.2 | 1.2 | 1.2 | 1.2 |
|
|
||||
| Plus: services received without charge | 0.6 | 0.6 | 0.6 | 0.6 |
|
|
||||
| Net cost of Program | 5.8 | 5.9 | 5.9 | 5.9 |
| Full Time Equivalents | 36 | 36 | 36 | 36 |
Table 2: Voted and Statutory Items ($ thousands)
| 2007-2008 | |||
| Vote or Statutory Item | Truncated Vote or Statutory Wording | Current Main Estimates |
Previous Main Estimates |
| 5 | Program expenditures | 6,056 | 5,978 |
| (S) | Contributions to employee benefit plans | 460 | 454 |
| Total Department or Agency | 6,516 | 6,432 | |
Table 3: Services Received Without Charge
| 2007-2008 | |
| Canadian Intergovernmental Conference Secretariat (CICS) | ($ millions) |
| Accommodation provided by Public Works and Government Services Canada (PWGSC) | 0.4 |
| Contributions covering employers' share of employees' insurance premiums and expenditures paid by Treasury Board Secretariat (excluding revolving funds) | 0.2 |
| Total 2007-2008 Services received without charge | 0.6 |
Table 4: Source of Non-Respendable Revenue
| ($ millions) | Forecast Revenue 2006-2007 |
Planned Revenue 2007-2008 |
Planned Revenue 2008-2009 |
Planned Revenue 2009-2010 |
| Canadian Intergovernmental Conference Secretariat | ||||
| Transfer payments from other governments (See Table 4b) | 1.2 | 1.2 | 1.2 | 1.2 |
| Miscellaneous Revenues | 0.0 | 0.0 | 0.0 | 0.0 |
| Total | 1.2 | 1.2 | 1.2 | 1.2 |
Table 4a: Information on the Federal-Provincial CICS Cost-Sharing Formula
| Determination of operating costs to be co-shared ($ thousands) |
Forecast 2006-2007 |
Planned 2007-2008 |
Planned 2008-2009 |
Planned 2009-2010 |
|
|
||||
| Main Estimates | 6,432.0 | 6,516.0 | 6,516.0 | 6,516.0 |
| Less: Budget Cut | 30.0 | 0.0 | 0.0 | 0.0 |
|
|
||||
| 6,402.0 | 6,516.0 | 6,516.0 | 6,516.0 | |
| Less: Items excluded from cost-sharing with the provinces | ||||
|
-454.0 | -460.0 | -460.0 | -460.0 |
|
-600.0 | -600.0 | -600.0 | -600.0 |
|
-9.0 | -9.0 | -9.0 | -9.0 |
|
-215.0 | -215.0 | -215.0 | -215.0 |
|
|
||||
| Total amount to be co-shared | 5,124.0 | 5,232.0 | 5,232.0 | 5,232.0 |
|
|
||||
| Allocation of co-shared amount | ||||
|
2,562.0 | 2,616.0 | 2,616.0 | 2,616.0 |
|
2,562.0 | 2,616.0 | 2,616.0 | 2,616.0 |
Table 4b: Information on the Federal-Provincial CICS Cost Sharing Formula
First Line: Amounts in roman type are federal-provincial financing formula calculated amounts
Second Line: Amounts in italic type are projected contribution by provinces
Third Line: Amounts in bold italic type are shortfalls, if any, on account of partial contributions
| Provincial Shares of CICS's Projected Operating Costs ($ thousands) |
Population* | Forecast 2006-2007 | Planned 2007-2008 |
Planned 2008-2009 |
Planned 2009-2010 |
| Newfoundland and Labrador |
1.7 | 43.6 | 44.5 | 44.5 | 44.5 |
| 43.6 | 44.5 | 44.5 | 44.5 | ||
| 0.0 | 0.0 | 0.0 | 0.0 | ||
| Nova Scotia | 3.0 | 76.9 | 78.5 | 78.5 | 78.5 |
| 76.9 | 78.5 | 78.5 | 78.5 | ||
| 0.0 | 0.0 | 0.0 | 0.0 | ||
| New Brunswick | 2.4 | 61.5 | 62.8 | 62.8 | 62.8 |
| 61.5 | 62.8 | 62.8 | 62.8 | ||
| 0.0 | 0.0 | 0.0 | 0.0 | ||
| Prince Edward Island | 0.5 | 12.8 | 13.0 | 13.0 | 13.0 |
| 11.5 | 13.0 | 13.0 | 13.0 | ||
| 1.3 | 0.0 | 0.0 | 0.0 | ||
| Quebec | 24.2 | 620.0 | 633.1 | 633.1 | 633.1 |
| 131.3 | 131.3 | 131.3 | 131.3 | ||
| 488.7 | 501.8 | 501.8 | 501.8 | ||
| Ontario | 38.2 | 978.7 | 999.3 | 999.3 | 999.3 |
| 355.6 | 355.6 | 355.6 | 355.6 | ||
| 623.1 | 643.7 | 643.7 | 643.7 | ||
| Manitoba | 3.7 | 94.8 | 96.8 | 96.8 | 96.8 |
| 94.8 | 96.8 | 96.8 | 96.8 | ||
| 0.0 | 0.0 | 0.0 | 0.0 | ||
| Saskatchewan | 3.3 | 84.5 | 86.3 | 86.3 | 86.3 |
| 84.5 | 86.3 | 86.3 | 86.3 | ||
| 0.0 | 0.0 | 0.0 | 0.0 | ||
| Alberta | 9.9 | 253.6 | 259.0 | 259.0 | 259.0 |
| 253.6 | 259.0 | 259.0 | 259.0 | ||
| 0.0 | 0.0 | 0.0 | 0.0 | ||
| British Columbia | 13.1 | 335.6 | 342.7 | 342.7 | 342.7 |
| 95.0 | 95.0 | 95.0 | 95.0 | ||
| 240.6 | 247.7 | 247.7 | 247.7 | ||
| Total | 2,562.0 | 2,616.0 | 2,616.0 | 2,616.0 | |
| 1,208.3 | 1,222.8 | 1,222.8 | 1,222.8 | ||
| 1,353.7 | 1,393.2 | 1,393.2 | 1,393.2 |
* Percentages calculated on the basis of the 2001 Decennial Census Provincial Population figures as released by Statistics Canada.
Table 4c: Information on the Federal-Provincial CICS Cost-Sharing Formula
| Federal Share of CICS's Operating Costs ($ thousands) | Forecast 2006-2007 |
Planned 2007-2008 |
Planned 2008-2009 |
Planned 2009-2010 |
|
|
|
|||||
| Federal co-shared amount | 2,562.0 | 2,616.0 | 2,616.0 | 2,616.0 | |
|
|
|||||
| Add: | |||||
| o | Items excluded from cost-sharing with the provinces (See Table 4a) | 1,278.0 | 1,284.0 | 1,284.0 | 1,284.0 |
| o | Projected revenues shortfall on account of partial contributions by: (See table 4b) | 1,353.7 | 1,393.2 | 1,393.2 | 1,393.2 |
|
|
|||||
| 2,631.7 | 2,677.2 | 2,677.2 | 2,677.2 | ||
| Total estimated cost to the federal government | 5,193.7 | 5,293.2 | 5,293.2 | 5,293.2 | |
Table 5: Resource Requirement by Branch or Sector
| ($ millions) | CICS | Total Planned Spending |
| Secretary's Office | 0.3 | 0.3 |
| Conference Services | 4.7 | 4.7 |
| Information Services | 0.9 | 0.9 |
| Corporate Services | 0.6 | 0.6 |
| Total | 6.5 | 6.5 |