Common menu bar links
Breadcrumb Trail
ARCHIVED - RPP 2007-2008
Canadian Grain Commission
 This page has been archived.
Archived Content
Information identified as archived on the Web is for reference, research or recordkeeping purposes. It has not been altered or updated after the date of archiving. Web pages that are archived on the Web are not subject to the Government of Canada Web Standards. As per the Communications Policy of the Government of Canada, you can request alternate formats on the "Contact Us" page.
SECTION III - SUPPLEMENTARY INFORMATION
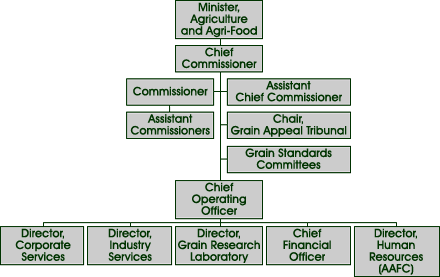
Organizational information

CGC partnerships
The CGC and the GQAS is integral to the functioning of Canada's grain industry. In our role as a neutral, third party regulator and arbiter, the CGC works in partnership with virtually every participant in the industry.
| Key partners | Areas of cooperation |
|---|---|
| Industry | |
| Producers and producers' organizations Grain Dealers and Elevators Railways Processors Universities Plant Breeders Canola Council of Canada Flax Council of Canada Pulse Canada Instrument Manufacturing Companies Canadian Wheat Board Canadian International Grains Institute Canadian Seed Institute Canadian Soybean Exporters Association Grain Exporters Ontario Wheat Producers' Marketing Board |
Setting grain quality standards Operation of the grain quality and quantity assurance system Provide grain shipment and unload data interchange Dispute resolution for quality and quantity issues Development and implementation of policies and regulations Sharing market information Market development and support Research and technology transfer Auditing and certifying industry IP systems |
| Portfolio departments and agencies | |
| Agriculture and Agri-Food Canada Canadian Food Inspection Agency Canadian Dairy Commission Farm Credit Canada National Farm Products Council |
Grain data co-ordination Sharing knowledge/expert opinion Research Strategic planning Meeting international tolerances for toxic contaminants in grain Shared quality and quantity assurance program delivery |
| Other government departments | |
| International Trade Canada Statistics Canada Industry Canada Health Canada Canada Border Services Agency Transport Canada Justice Canada |
Sharing knowledge and expert opinion Facilitating international trade Publication of grain statistics Market development and support Grain shipment and unload data interchange Inspection and certification of licensed terminal and transfer elevator scales Regulation of grain imports |
| Foreign | |
| U.S. Department of Agriculture (Grain Inspection, Packers and Stockyards Administration) Ministry of Agriculture, Forestry and Fisheries (Japan) Ministry of Commerce, Economic Control and Fraud Prevention Branch (Algeria) Commonwealth Scientific and Industrial Research Organisation (Australia) State Administration of Grain (China) |
Shared knowledge and expert opinion Shared quality assurance program delivery Facilitating international trade Research Technology training |
Department Links to the Government of Canada Outcome Areas

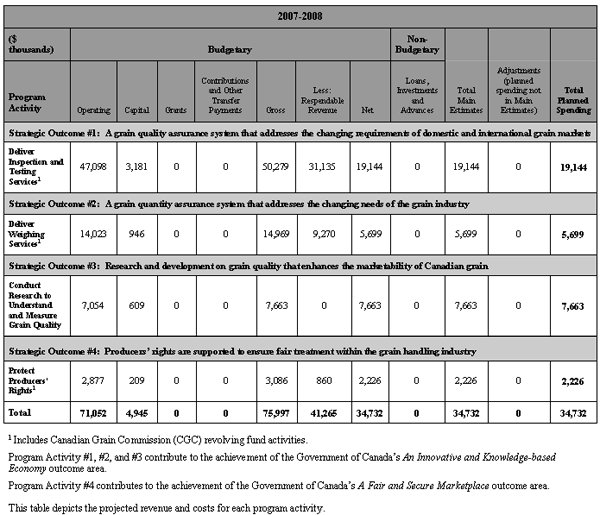
Table 1: Departmental planned spending and full time equivalents
| ($ thousands) | Forecast spending 2006-2007 |
Planned spending 2007-2008 |
Planned spending 2008-2009* |
Planned spending 2009-2010* |
|---|---|---|---|---|
|
|
||||
| Deliver inspection and testing services1 | 49,363 | 50,279 | 31,040 | 31,040 |
| Deliver weighing services1 | 15,996 | 14,969 | 9,241 | 9,241 |
| Conduct research to understand and measure grain quality | 9,171 | 7,663 | 4,130 | 4,130 |
| Protect producer's rights1 | 2,208 | 3,086 | 1,861 | 1,861 |
|
|
||||
| Budgetary main estimates (gross) | 76,738 | 75,997 | 46,272 | 46,272 |
| Non-budgetary main estimates (gross) | 0 | 0 | 0 | 0 |
| Less: respendable revenue | 41,516 | 41,265 | 41,265 | 41,265 |
|
|
||||
| Total main estimates | 35,222 | 34,732 | 5,007 | 5,007 |
|
|
||||
| Adjustments2 | ||||
| Additional Funding3 | 0 | 155 | 30,000 | 0 |
| ERC Procurement Savings4 | (20) | 0 | 0 | 0 |
| Governor General Warrants | (4,488) | 0 | 0 | 0 |
| Carry Forward | 272 | 0 | 0 | 0 |
|
|
||||
| Total Adjustments | (4,236) | 155 | 30,000 | 0 |
|
|
||||
| Total planned spending | 30,986 | 34,887 | 35,007 | 5,007 |
|
|
||||
|
|
||||
| Total planned spending | 30,986 | 34,887 | 35,007 | 5,007 |
| Less: non-respendable revenue | 0 | 0 | 0 | 0 |
| Plus: cost of services received without charge | 1,733 | 1,678 | 390 | 381 |
|
|
||||
| Net cost of program | 32,719 | 36,565 | 35,397 | 5,388 |
|
|
||||
|
|
||||
| Full time equivalents | 664 | 664 | 664 | 403 |
|
|
||||
*Note: These resources are the currently approved funding levels based on the CGC’s Annual Reference Level Update (ARLU) report. The CGC has received additional appropriation revenue over the past several years to maintain its resource levels. In 2007-2008 the CGC received $30 million appropriation in addition to its annual appropriation of $5 million. Planned spending for 2008-2009 and 2009-2010 includes only the annual appropriation of $5 million resulting in a reporting variance between years.
1 Includes Canadian Grain Commission (CGC) revolving fund activities.
2 Adjustments accommodate approvals obtained since Main Estimates and include items such as Budget Initiatives, Supplementary Estimates and Governor General Warrants.
3Additional funding includes $155K and $30 million in appropriation that has been allocated for 2007-2008 and 2008-2009 respectively. These appropriations are not included in the total main estimates line as they were not approved at the time of the CGC’s ARLU report.
4 ERC planned savings (-$20K) for 2006-2007. ERC planned savings for 2007-2008 are included in the total planned spending.
These resources are based on currently approved funding levels. The CGC has received additional appropriation revenue over the past several years to maintain its resource levels. In 2007-2008 the CGC received $30 million appropriation in addition to its annual appropriation of $5 million. Planned spending for 2008-2009 and 2009-2010 includes only the annual appropriation of $5 million resulting in a reporting variance between years.
Table 2: Voted and Statutory Items Listed in Main Estimates
| Vote or statutory item | Canadian Grain Commission | 2007-2008 Main estimates ($000's) |
2006-2007 Main estimates ($000's) |
|---|---|---|---|
| 40 | Program expenditures | 30,940 | 24,666 |
| (S) | Canadian Grain Commission Revolving Fund | (127) | (127) |
| (S) | Contributions to employee benefit plans | 3,919 | 10,683 |
| Total department | 34,732 | 35,222 |
The Voted and Statutory items reflect the Canadian Grain Commission (CGC) comparison of approved funding from year to year. The 2006-2007 Main Estimates include an allocation error between Vote 40 Program Expenditures and statutory (S) Contributions to Employee Benefit Plans with a nil effect on the total department dollars.
Table 3: Services Received Without Charge
| ($ thousands) | 2007-2008 |
|---|---|
| Contributions covering employers' share of employees' insurance premiums and expenditures paid by Treasury Board of Canada Secretariat (excluding revolving funds) | 1,483 |
| Worker's compensation coverage provided by Social Development Canada | 195 |
| Total 2007-2008 services received without charge | 1,678 |
This table represents all services provided and paid by other government departments on behalf of the Canadian Grain Commission (CGC).
Table 4: Summary of Capital Spending by Program Activity
| ($ thousands) | Forecast spending 2006-2007 |
Planned spending 2007-2008 |
Planned spending 2008-2009 |
Planned spending 2009-2010 |
|---|---|---|---|---|
|
|
||||
| Deliver inspection and testing services1 | 2,660 | 3,181 | 1,920 | 1,920 |
| Deliver weighing services1 | 863 | 946 | 572 | 572 |
| Conduct research to understand and measure grain quality | 661 | 609 | 379 | 379 |
| Protect producer's rights1 | 131 | 209 | 129 | 129 |
|
|
||||
| Total | 4,315 | 4,945 | 3,000 | 3,000 |
|
|
||||
1 Includes Canadian Grain Commission (CGC) Revolving Fund activities.
Table 5: Sources of Respendable Revenue
| ($ thousands) | Forecast revenue 2006-2007 |
Planned revenue 2007-2008 |
Planned revenue 2008-2009 |
Planned revenue 2009-2010 |
|---|---|---|---|---|
|
|
||||
| Deliver inspection and testing services (RF)1 | 31,324 | 31,135 | 31,135 | 31,135 |
| Deliver weighing services (RF)1 | 9,326 | 9,270 | 9,270 | 9,270 |
| Protect producers' rights (RF)1 | 866 | 860 | 860 | 860 |
|
|
||||
| Total Respendable Revenue | 41,516 | 41,265 | 41,265 | 41,265 |
|
|
||||
1 (RF) represents Revolving Fund activities.
This table identifies all sources of respendable revenue generated.
Table 6: Revolving Fund - Statement of Operations
| ($ thousands) | Forecast 2006-2007 |
Planned 2007-2008 |
Planned 2008-2009 |
Planned 2009-2010 |
|---|---|---|---|---|
|
|
||||
| Respendable Revenue | 41,516 | 41,265 | 41,265 | 41,265 |
|
|
||||
| Expenses | ||||
| Operating: | ||||
| Salaries and employee benefits | 31,900 | 31,649 | 31,649 | 31,649 |
| Depreciation | 1,411 | 1,701 | 1,701 | 1,701 |
| Repairs and maintenance | 465 | 318 | 318 | 318 |
| Administrative and support services | 4,691 | 5,784 | 5,784 | 5,784 |
| Utilities, materials and supplies | 1,971 | 1,084 | 1,084 | 1,084 |
| Marketing | 135 | 76 | 76 | 76 |
|
|
||||
| Total Expenses | 40,573 | 40,612 | 40,612 | 40,612 |
|
|
||||
| Surplus (Deficit) | 943 | 653 | 653 | 653 |
|
|
||||
This table portrays and allocates the costs associated with the Respendable Revenue generated through fees and contracts.
Statement of Cash Flows
| ($ thousands) | Forecast 2006-2007 |
Planned 2007-2008 |
Planned 2008-2009 |
Planned 2009-2010 |
|---|---|---|---|---|
|
|
||||
| Surplus (Deficit) | 943 | 653 | 653 | 653 |
|
|
||||
| Add non-cash items: | ||||
| Depreciation/amortization | 1,411 | 1,701 | 1,701 | 1,701 |
| Investing activities: | ||||
| Acquisition of depreciable assets | (2,227) | (2,227) | (2 227) | (2 227) |
|
|
||||
| Cash surplus (requirement) | 127 | 127 | 127 | 127 |
|
|
||||
This table converts the financial statement information from book value to a cash basis.
Projected Use of Authority
| ($ thousands) | Forecast 2006-2007 |
Planned 2007-2008 |
Planned 2008-2009 |
Planned 2009-2010 |
|
|
||||
| Authority | 2,508 | 2,508 | 2,508 | 2,508 |
| Drawdown: | ||||
| Balance as at April 1 | 8,296 | 127 | 254 | 381 |
| Operating (deficit)/surplus | (8,296) | 0 | 0 | 0 |
| Projected surplus (Drawdown) | 127 | 127 | 127 | 127 |
|
|
||||
| 127 | 254 | 381 | 508 | |
|
|
||||
| Projected Balance at March 31 | 2,635 | 2,762 | 2,889 | 3,016 |
|
|
||||
This table represents the projected surplus (drawdown), which is made up of the ANCAFA (cash basis) plus a $2 million line of credit for revolving fund activities only.
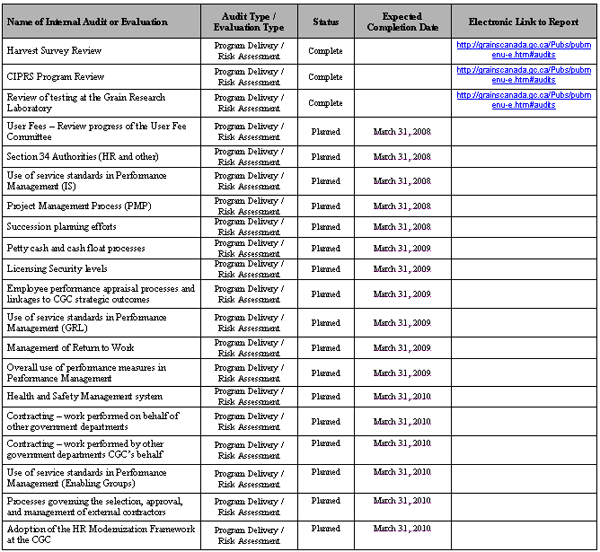
Table 7: Internal Audits and Evaluations

