
Treasury Board of Canada Secretariat
www.tbs-sct.gc.ca
Common menu bar links
Breadcrumb Trail
ARCHIVED - RPP 2007-2008
Economic Development Agency of Canada for the Regions of Quebec
 This page has been archived.
Archived Content
Information identified as archived on the Web is for reference, research or recordkeeping purposes. It has not been altered or updated after the date of archiving. Web pages that are archived on the Web are not subject to the Government of Canada Web Standards. As per the Communications Policy of the Government of Canada, you can request alternate formats on the "Contact Us" page.
4 Additional Information
4.1 Information on the organization
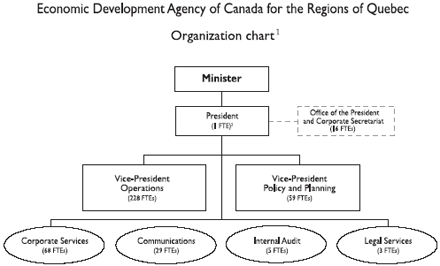
Notes:
1 A more detailed organization chart is available on the Agency's Web
site at: www.dec-ced.gc.ca/asp/APropos/Organigramme.asp?LANG=EN
2 FTE: Full-time equivalent.
4.2 Links with Government of Canada results
2007 - 2008 |
||||||||
|---|---|---|---|---|---|---|---|---|
($ thousands) |
Operations |
Grants |
Contributions |
Gross budgetary expenditures |
Less non-respendable revenue |
Total Main Estimates |
Readjustments |
Total planned spending |
Strategic outcome: Vitality of communities |
|
|
|
|
|
|
|
|
Development of communities |
21,910 |
33,530 |
107,419 |
162,859 |
(4,250) |
158,609 |
151 |
158,760 |
Infrastructure |
2,743 |
|
97,358 |
100,101 |
|
100,101 |
|
100,101 |
Special intervention measures |
1,105 |
|
6,973 |
8,078 |
|
8,078 |
|
8,078 |
|
25,758 |
33,530 |
211,750 |
271,038 |
(4,250) |
266,788 |
151 |
266,939 |
|
||||||||
Strategic outcome: |
|
|
|
|
|
|
|
|
Competitiveness of enterprises (SMEs) |
9,540 |
400 |
62,637 |
72,577 |
(36,125) |
36,452 |
1,958 |
38,410 |
Competitive positioning of regions |
6,472 |
320 |
37,705 |
44,497 |
(2,125) |
42,372 |
54 |
42,426 |
|
16,012 |
720 |
100,342 |
117,074 |
(38,250) |
78,824 |
2 012 |
80,836 |
|
||||||||
Strategic outcome: |
|
|
|
|
|
|
|
|
Policies, programs and initiatives |
6,088 |
100 |
400 |
6,588 |
|
6,588 |
|
6,588 |
|
|
|
|
|
|
|
|
|
GRAND TOTAL |
47,858 |
34,350 |
312,492 |
394,700 |
(42,500) |
352,200 |
2,163 |
354,363 |
The Agency's three strategic outcomes and six program activities contribute to the achievement of the Government of Canada's Strong Economic Growth outcome area.
4.3 RPP tables
Table 1: Departmental Planned Spending and Full-Time Equivalents
($ thousands) |
Forecast spending |
Planned spending |
Planned spending |
Planned spending |
|---|---|---|---|---|
|
|
|
|
|
Development of communities |
— |
162,859 |
122,689 |
108,608 |
Infrastructure |
— |
100,101 |
2,507 |
2,095 |
Special intervention measures |
— |
8,078 |
3,396 |
3,363 |
Competitiveness of enterprises (SMEs) |
— |
72,577 |
66,268 |
68,038 |
Competitive positioning of regions |
— |
44,497 |
44,287 |
45,472 |
Policies, programs and initiatives |
— |
6,588 |
7,046 |
7,046 |
Total Main Estimates2 |
381,595 |
394,700 |
246,193 |
234,622 |
| Adjustments | ||||
Canada Business Service Centres |
— |
1,878 |
1,878 |
— |
Internal audit policy |
— |
177 |
— |
— |
Social economy |
— |
— |
2,850 |
— |
Collective agreements |
385 |
108 |
102 |
102 |
Supplementary Estimates |
|
|
|
|
Funding for projects that improve water quality and local transportation or provide regional economic benefit |
35,000 |
— |
— |
— |
Spending restraint in 2006 |
(6,082) |
— |
— |
— |
Funding to support the commemoration of the 400th anniversary of Québec in 2008 |
2,875 |
— |
— |
— |
Operating budget carry forward |
1,706 |
— |
— |
— |
Additional funding to support community economic development in rural and disadvantaged urban areas (Community Futures Program) |
1,632 |
— |
— |
— |
Funding for the Canada Strategic Infrastructure Fund relating to investment in public infrastructure projects designed to improve quality of life in both urban and rural communities |
35 |
— |
— |
— |
Expenditure Review Committee savings in 2005 - Procurement |
(290) |
— |
— |
— |
Transfer to the National Arts Centre – To set up the Scene Quebec broadcasters program |
(300) |
— |
— |
— |
Transfer to Industry – To support a pilot project aimed at the deployment of a broadband network in the Abitibi-Témiscamingue region |
(450) |
— |
— |
— |
Transfer to Industry – To support the Canadian Apparel and Textile Industries Program |
(677) |
— |
— |
— |
Transfer to the National Research Council of Canada – For the purchase of research and development equipment and the establishment of a technology transfer centre (Aerospace Manufacturing Technology Centre) |
(1,000) |
— |
— |
— |
Transfer to the National Research Council of Canada – To support the Industrial Research Assistance Program with a view to increasing small-and medium-sized enterprises' innovation capability |
(2,570) |
— |
— |
— |
Deferral to subsequent years |
(19,645) |
— |
— |
— |
Total adjustments |
10,619 |
2,163 |
4,830 |
102 |
Net planned spendings |
392,214 |
396,863 |
251,023 |
234,724 |
|
|
|
|
|
Less: Non-respendable revenue3 |
(42,500) |
(42,500) |
(44,000) |
(49,500) |
Plus: Cost of services received without charge |
5,344 |
5,320 |
6,322 |
6,306 |
Total expenditures for the Agency |
355,058 |
359,683 |
213,345 |
191,530 |
|
|
|
|
|
Full-time equivalent (FTE)4 |
408 |
409 |
407 |
400 |
Notes:
1 The table is presented in line with the new Program Activity Architecture.
The 2006-2007 spending forecast has not been broken down.
2 The decrease in planned spending over the coming years is primarily attributable
to the reduction in planned spending under the Infrastructure program, grants
(Sept-Îles and Québec Port Authorities) and spending restraint
in 2006.
3 Details of non-respendable revenue are presented in table 4.
4 The planned decrease is attributable to the reduced use of FTEs under the
Social Economy Initiative and the Municipal Rural Infrastructure Fund.
Table 2: Votes and Statutory Items Listed in Main Estimates
Vote or statutory item |
Truncated vote or statutory wording |
Main Estimates |
Main Estimates |
|---|---|---|---|
1 |
Operating expenditures |
42,357 |
44,693 |
5 |
Grants and contributions |
346,842 |
331,165 |
(S) |
Contribution to employee benefit plans |
5,501 |
5,737 |
|
Total for the Agency |
394,700 |
381,595 |
The 2007-2008 Main Estimates of $394.7 million are $13.5 million higher than the 2006-2007 Main Estimates. This net difference is primarily due to a $13.3-million increase to support the commemoration of the 400th anniversary of Québec in 2008.
Table 3: Services Received Without Charge
($ thousands) |
2007-2008 |
|---|---|
Accommodation provided by Public Works and Government Services Canada |
3,208 |
Employer's contribution to employees' insurance premiums and expenditures paid by the Treasury Board Secretariat |
2,082 |
Salary and associated expenditures for legal services provided by Justice Canada |
30 |
Total services received without charge in 2007-2008 |
5,320 |
Table 4: Sources of Non-Respendable Revenue
Non-respendable revenue1 |
Forecast spending |
Planned spending |
Planned spending |
Planned spending |
|---|---|---|---|---|
Development of communities |
4,250 |
4,250 |
4,400 |
4,950 |
Infrastructure |
— |
— |
— |
— |
Special intervention measures |
— |
— |
— |
— |
Competitiveness of enterprises (SMEs) |
36,125 |
36,125 |
37,400 |
42,075 |
Competitive positioning of regions |
2,125 |
2,125 |
2,200 |
2,475 |
Policies, programs and initiatives |
— |
— |
— |
— |
Total |
42,500 |
42,500 |
44,000 |
49,500 |
Note:
1 This refers to reimbursements of repayable contributions to be billed in future years.
Table 5: Transfer Payments
($ thousands) |
Planned spending |
Planned spending |
Planned spending |
Planned spending |
|---|---|---|---|---|
Strategic outcome: Vitality of communities |
|
|
|
|
Program activity: Development of communities |
|
|
|
|
Grants |
|
|
|
|
CED-Community Diversification Program |
— |
1,080 |
1,080 |
1,080 |
Sept-Îles Port Authority to expand Wharf 41 |
— |
2,400 |
— |
— |
Québec Port Authority to commemorate the 400th anniversary of Québec in 2008 |
— |
30,050 |
4,700 |
— |
Total grants |
— |
33,530 |
5,780 |
1,080 |
Contributions |
|
|
|
|
Community Futures Program |
— |
40,304 |
32,000 |
32,400 |
CED-Community Diversification Program |
— |
67,115 |
62,915 |
53,386 |
Total contributions |
— |
107,419 |
94,915 |
85,786 |
Program activity: Infrastructure |
|
|
|
|
Contributions to the Province of Quebec under the Infrastructure Canada Program |
— |
97,358 |
— |
— |
Program activity: Special intervention measures |
|
|
|
|
Contributions to the Canadian Apparel and Textile Industries Program |
— |
6,973 |
2,703 |
2,663 |
Strategic outcome: Competitiveness of SMEs and regions |
|
|
|
|
Program activity: Competitiveness of enterprises (SMEs) |
|
|
|
|
Grants to the CED-Business and Regional Growth Program |
— |
400 |
400 |
400 |
Contributions to the CED-Business and Regional Growth Program |
— |
62,637 |
56,263 |
58,033 |
Program activity: Competitive positioning of regions |
|
|
|
|
Grants to the CED-Business and Regional Growth Program |
— |
320 |
320 |
320 |
Contributions to the CED-Business and Regional Growth Program |
— |
37,705 |
37,452 |
38,637 |
Strategic outcome: Policy, representation and cooperation |
|
|
|
|
Program activity: Policies, programs and initiatives |
|
|
|
|
Grants to the Regional Development Research Program |
— |
100 |
200 |
200 |
Contributions to the Regional Development Research Program |
— |
400 |
750 |
750 |
Total |
340,478 |
346,842 |
198,783 |
187,869 |
Note:
1 The table is presented in line with the new Program Activity Architecture.
The 2006-2007 spending forecast has not been broken down.
Table 6: Agency's Sustainable Development Strategy (SDS)
Agency's governance goal: |
||
Federal government goal
|
Performance measurement
|
Agency's anticipated results for 2007-2008
|
Agency's empowerment goal: |
||
|
Performance measurement
|
Agency's anticipated results for 2007-2008
|
Agency's Vitality of communities goal: |
||
Federal government goals
|
Performance measurement
|
Agency's anticipated results for 2007-2008
|
Agency's Competitiveness of SMEs
and regions goal: |
||
Federal government goals
|
Performance measurement
|
Agency's anticipated results for 2007-2008
|
Note:
Information on the Agency's SDS: www.dec-ced.gc.ca/Complements/Publications/Strategie-EN/SDD_2007-2010/tdm.html
Table 7: Internal Audit and Evaluation
Name of internal audit or evaluation |
Type of audit and evaluation |
Status |
Scheduled date of completion |
|---|---|---|---|
Compliance with key project approval and contribution payment process controls. |
Internal audit |
Completed |
January 2006 |
Electronic link to report: www.dec-ced.gc.ca/Complements/Publications/ |
|||
Audit of the delivery of the Regional Strategic Initiatives (RSI) program and Innovation, development, entrepreneurship and access program for SMEs (IDEA SME). |
Internal audit |
Completed |
January 2006 |
Electronic link to report: www.dec-ced.gc.ca/Complements/Publications/Verification- |
|||