
Common menu bar links
Breadcrumb Trail
ARCHIVED - RPP 2006-2007
Canada Border Services Agency
 This page has been archived.
Archived Content
Information identified as archived on the Web is for reference, research or recordkeeping purposes. It has not been altered or updated after the date of archiving. Web pages that are archived on the Web are not subject to the Government of Canada Web Standards. As per the Communications Policy of the Government of Canada, you can request alternate formats on the "Contact Us" page.
SECTION III – SUPPLEMENTARY INFORMATION
Organizational information
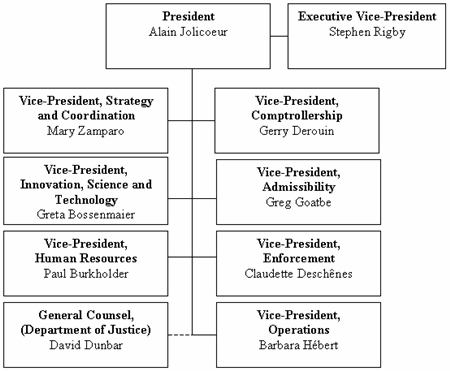
The CBSA is organized into seven branches, each headed by a Vice-President, who reports directly to the President. The Executive Vice-President provides support to the President, concentrating on the leadership of the Agency’s program and operational management, as well as the management of financial resources and comptrollership.
Operations are delivered in eight regions: Atlantic, Quebec, Northern Ontario, Greater Toronto Area, Windsor/St. Clair, Niagara Falls/Fort Erie, Prairies and Pacific. CBSA officers are also located in 39 points abroad. The Admissibility and Enforcement Branches develop the programs and policies that the Operations Branch delivers. The Innovation, Science and Technology Branch works with these branches to ensure that we maximize our capacity to support effective and efficient operations. Underpinning all our policy, program and operational work are the critical strategic and enabling functions that span Strategy and Coordination, Human Resources, and Comptrollership Branches. The CBSA works closely with its Department of Justice Legal Services Unit to ensure that CBSA operations, service delivery, policy development, corporate direction and management are legally supportable.
This structure was chosen to encourage strong internal synergies among all program areas and to support clear accountability for all functions. Everything we do is focused on maximizing and supporting the performance of our front line.
Table 1: Departmental Planned Spending and Full-time Equivalents
|
(thousands of dollars) |
Forecast Spending |
Planned Spending |
Planned Spending |
Planned Spending |
|
|---|---|---|---|---|---|
|
Security |
321,482 |
447,250 |
418,286 |
421,319 |
|
|
Access |
641,924 |
764,356 |
772,150 |
772,120 |
|
|
Science- and Technology-based Innovation |
70,448 |
94,037 |
90,405 |
90,391 |
|
|
Less: Respendable Revenue |
(12,110) |
(12,110) |
(12,110) |
(12,110) |
|
|
Total Main Estimates |
1,021,744 |
1,293,533 |
1,268,731 |
1,271,720 |
|
|
|
|
||||
| Adjustments: |
Expenditure Review Committee Savings |
(2,480) |
(4,100) |
|
|
|
Governor General Warrant |
182,480 |
|
|
|
|
| Budget Announcement: |
Securing Canada’s Air Cargo Transportation System |
|
4,200 |
3,700 |
4,200 |
|
Arming Border Officers and eliminating work-alone situations |
|
32,800 |
62,100 |
119,400 |
|
|
Enhancing road and rail cargo security – |
|
91,927 |
79,821 |
77,419 |
|
|
Passenger Name |
|
12,109 |
13,835 |
12,097 |
|
|
Expansion of Nexus Air |
|
11,190 |
13,095 |
11,363 |
|
|
Harmonization of the Custom-Trade Partnership Against Terrorism (C-TPAT) / Partners in Protection (PIP) |
|
2,722 |
2,216 |
2,227 |
|
|
Business Resumption Planning at the border |
|
5,089 |
7,075 |
3,873 |
|
|
National Initiatives to Combat Money Laundering |
|
3,500 |
3,500 |
3,500 |
|
| Other: |
Container Security – Harmonized Scoring |
|
11,180 |
5,762 |
5,752 |
|
Winter Olympics including Paralympic Games |
|
1,200 |
1,200 |
1,800 |
|
|
Security Certificates |
|
1,680 |
|
|
|
|
Year-end Lapse |
(43,623) |
|
|
|
|
|
Employee Benefit Plan |
10,566 |
|
|
|
|
|
Spending of proceeds from the disposal of surplus Crown Assets |
149 |
|
|
|
|
|
Refunds of amounts credited to revenues in previous years |
15 |
|
|
|
|
|
Total Adjustments |
147,107 |
173,497 |
192,304 |
241,631 |
|
|
Total Planned Spending |
1,168,851 |
1,467,030 |
1,461,035 |
1,513,351 |
|
|
|
|
|
|
||
|
Total Planned Spending |
1,168,851 |
1,467,030 |
1,461,035 |
1,513,351 |
|
|
Less: Non-respendable revenue |
44,382 |
38,563 |
39,334 |
40,121 |
|
|
Plus: Cost of services |
103,814 |
109,527 |
109,127 |
107,357 |
|
|
Net Cost of Program |
1,228,283 |
1,537,994 |
1,530,828 |
1,580,587 |
|
| Full-time Equivalents |
10,978
|
12,763
|
12,900
|
13,312
|
|
Table 2: Program Activities
| 2006-2007 (thousands of dollars) | |||||||
|---|---|---|---|---|---|---|---|
|
Budgetary |
|||||||
|
Program Activity |
Operating |
Capital |
Gross |
Respendable Revenue |
Total |
Adjustments (planned spending not in Main Estimates) |
Total Planned Spending |
|
Security |
436,843 |
10,407 |
447,250 |
|
447,250 |
110,250 |
557,500 |
|
Access |
745,910 |
18,446 |
764,356 |
(12,110) |
752,246 |
16,025 |
768,271 |
|
Science- and Technology-based Innovation |
94,037 |
|
94,037 |
|
94,037 |
47,222 |
141,259 |
|
Total |
1,276,790 |
28,853 |
1,305,643 |
(12,110) |
1,293,533 |
173,497 |
1,467,030 |
Table 3: Voted and Statutory Items listed in Main Estimates
| 2006-2007 | |||
|---|---|---|---|
|
Vote or Statutory Item |
Truncated Vote or Statutory Wording |
Current |
Previous |
|
10 |
Canada Border Services Agency Operating expenditures and, pursuant to paragraph 29.1(2)(a) of the Financial Administration Act, authority to expend in the current fiscal year revenues received during the fiscal year related to border operations of the Canada Border Services Agency; fees for the provision of a service or the use of a facility or for a product, right or privilege; and payments received under contracts entered into by the Agency. |
1,119,660 |
863,931 |
|
15 |
Capital expenditures |
28,853 |
32,297 |
|
(S) |
Contributions to employee benefit plans |
145,020 |
125,516 |
| Total Agency |
1,293,533 |
1,021,744 |
|
Table 4: Services Received Without Charge
| 2006-2007 (thousands of dollars) | |
|---|---|
|
Accommodation provided by Public Works and Government Services Canada (PWGSC) |
43,200 |
|
Contributions covering employers' share of employees’ insurance premiums and expenditures paid by Treasury Board of Canada Secretariat (excluding revolving funds) Employer’s contribution to employees’ insured benefits plans and expenditures paid by TBS |
57,315 |
|
Workers’ compensation coverage provided by Social Development Canada |
1,853 |
|
Salary and associated expenditures of legal services provided by the Department of Justice Canada |
7,159 |
|
2006-2007 Services Received Without Charge |
109,527 |
Table 5: Summary of Capital Spending by Program Activity
|
(thousands of dollars) |
Forecast Spending |
Planned Spending 2006-2007 |
Planned Spending 2007-2008 |
Planned Spending 2008-2009 |
|---|---|---|---|---|
|
Security |
4,354 |
13,167 |
21,703 |
23,743 |
|
Access |
12,801 |
18,446 |
18,446 |
18,446 |
|
Science- and Technology-based Innovation |
962 |
|
|
|
|
Total Agency |
18,117 |
31,613 |
40,149 |
42,189 |
Table 6: Sources of Respendable and Non-respendable Revenue
|
(thousands of dollars) |
Forecast Revenue |
Planned Revenue |
Planned Revenue |
Planned Revenue |
|
|---|---|---|---|---|---|
|
Canada Border Services Agency Access |
Sales of goods and services |
1,440 |
1,754 |
1,754 |
1,754 |
|
Services of a regulatory nature |
2,604 |
1,931 |
1,931 |
1,931 |
|
|
Services of non-regulatory nature |
10,894 |
8,425 |
8,425 |
8,425 |
|
|
Total Respendable Revenue |
14,938 |
12,110 |
12,110 |
12,110 |
|
| (thousands of dollars) |
Forecast Revenue |
Planned Revenue |
Planned Revenue |
Planned Revenue |
|
|---|---|---|---|---|---|
| Security | |||||
|
Adjustments to prior years’ payables |
4,689 |
3,137 |
3,199 |
3,263 |
|
| Sale of Goods and Services |
Services of a Regulatory Nature |
2,783 |
2,727 |
2,782 |
2,838 |
|
Services of a Non-regulatory Nature |
898 |
674 |
688 |
701 |
|
| Sale of Goods and Services Total |
3,681 |
3,402 |
3,470 |
3,539 |
|
| Miscellaneous |
GST/HST, Customs Import duties, Excise and Air Travellers Security Charge |
3,251 |
3,007 |
3,068 |
3,129 |
|
Sundries - Court Fines |
1,717
|
1,634
|
1,666
|
1,700 |
|
|
Sundries - Customs Seizures |
10 |
5 |
5 |
5 |
|
|
Sundries - Investigations Seizures |
716 |
1,840 |
1,877 |
1,914 |
|
|
Sundries - Port Seizures |
8,054 |
7,732 |
7,887 |
8,044 |
|
|
Sundries - Other |
21,512 |
16,969 |
17,308 |
17,654 |
|
| Miscellaneous Total |
35,260 |
31,187 |
31,811 |
32,447 |
|
|
Total Security |
43,630 |
37,725 |
38,480 |
39,249 |
|
|
|
|||||
| Access | |||||
| Sale of Goods and Services |
Public Building and Property Rental |
363 |
379 |
387 |
394 |
|
Total Access |
363 |
379 |
387 |
394 |
|
|
|
|||||
| Science- and Technology-based Innovation | |||||
| Sale of Goods and Services - Rights and Privileges |
IonScan Royalties |
389 |
458 |
468 |
477 |
|
Total Science- and Technology-based Innovation |
389 |
458 |
468 |
477 |
|
|
Total Non-respendable Revenue |
44,382 |
38,563 |
39,334 |
40,121 |
|
| (thousands of dollars) |
Forecast Revenue |
Planned Revenue |
Planned Revenue |
Planned Revenue |
|---|---|---|---|---|
|
Total Respendable and Non-respendable Revenue |
59,320 |
50,673 |
51,444 |
52,231 |
Table 7: Resource Requirement by Branch
| 2006-2007 | ||||
|---|---|---|---|---|
|
|
Security |
Access |
Science- and Technology-based Innovation |
Total Planned Spending |
|
Admissibility |
2,189 |
52,780 |
187 |
55,156 |
|
Enforcement |
101,683 |
4,556 |
4,987 |
111,226 |
|
Innovation, Science and Technology |
119,403 |
60,995 |
121,781 |
302,179 |
|
Operations |
299,146 |
577,893 |
6,464 |
883,503 |
|
Corporate Management |
35,079 |
72,047 |
7,840 |
114,966 |
|
Total |
557,500 |
768,271 |
141,259 |
1,467,030 |
Table 8: Details on Project Spending
Over the next three years the following projects have or are expected to exceed the Canada Border Services Agency delegated project approval level:
2006-2007
- Andover NB
- Cascade BC
- Douglas BC
- Emerson-West MB
- Stanstead QC
- St-Stephen NB
- Aldergrove BC
- Lacolle QC
- Rigaud QC (Arming Border Officers)
- Enhancing road and rail cargo security – E-Manifest
2007-2008
- Andover NB
- Douglas BC
- Emerson-West MB
- St-Stephen NB
- Aldergrove BC
- Rigaud QC (Arming Border Officers)
- Enhancing road and rail cargo security – E-Manifest
2008-2009
- Emerson-West MB
- Aldergrove BC
- Kingsgate BC
- Rigaud QC (Arming Border Officers)
- Enhancing road and rail cargo security – E-Manifest
Table 9: Internal Audits and Evaluations planned for 2006-2007
| Internal Audits |
|---|
|
Security: Risk Management, Enforcement Records, this component will focus on warehouse in 2006-2007 (Security aspect only). Commercial: Program Integrity of Commercial Operations People and Travellers: Forms Business Solutions and Projects: Systems Development Audits, NEXUS Processing Centres IT Infrastructure and Operations: Service Level Agreements and Memoranda of Understanding, Infrastructure and General Controls Learning Innovation and Change Management: arming Policies and Programs: CBSA Emergency Preparedness People Management: HR Planning Stewardship—Financial Management: Administered Revenues, Year-end Procedures for the Office of the Auditor General Stewardship—Compliance with Authorities: Cyclical Examinations of Compliance with Authorities, Travel and Hospitality, Cash Management Stewardship—Facilities, Real Property and Assets: Asset Management, Fleet Management, Control and Disposal of Detained and Seized Goods |
| Evaluations |
|
Targeting Function Detector Dog Services Partners in Protection Customs Self-Assessment Rail Export Verification Unit Free and Secure Trade (FAST) NEXUS Highway Exports Programs |