ARCHIVED - Treasury Board of Canada Secretariat - 2012–13 Departmental Performance Report
 This page has been archived.
Archived Content
Information identified as archived on the Web is for reference, research or recordkeeping purposes. It has not been altered or updated after the date of archiving. Web pages that are archived on the Web are not subject to the Government of Canada Web Standards. As per the Communications Policy of the Government of Canada, you can request alternate formats on the "Contact Us" page.
ISSN 1490-1498
President's Message

I am pleased to present the 2012–13 Departmental Performance Report for the Treasury Board of Canada Secretariat.
In 2012–13, the Secretariat continued to support the modernization of the Government of Canada through cost savings in government operations, by making it easier for Canadians to access information and services, and by managing people more effectively to enhance performance.
During the year, our organization, like every other federal department, implemented savings measures announced in Economic Action Plan 2012. In this process, the Secretariat achieved its own savings and supported ministers and departments in implementing ongoing annual savings of $5.2 billion, primarily through achieving greater operational efficiencies and enhancing productivity.
In addition, we improved the way our Government serves Canadians and businesses. For example, we announced Canada's Action Plan on Open Government with 12 commitments that support open information, open data and open dialogue with Canadians. We also focused on removing business irritants that burden Canadian businesses with unnecessary delays, costs and bureaucracy through initiatives such as the Red Tape Reduction Action Plan – one of the most far-reaching and ambitious plans in the world. This plan includes a “One-for-One” Rule that effectively caps the administrative costs of businesses in complying with federal government regulation. The Secretariat also took the lead in modernizing the Government of Canada's online presence. It has developed a Web Renewal Action Plan that will make it easier for Canadians to access government services and information on the Web and through social media.
Streamlining the government's internal operations has been another important priority. To that end, we are pursuing the standardization and consolidation of systems and processes for human resources and financial management. We are also ensuring that the government has the right policies in place to support a government-wide approach to IT infrastructure through Shared Services Canada – one that can drive economies of scale, achieve savings for taxpayers and improve service.
As stated in Economic Action Plan 2013, we are also committed to creating a high-performing and dynamic public service. As part of this, the Secretariat has developed a new performance management initiative, which will ensure that the performance of public service employees is tracked and employed to its fullest potential. It also designed a strategy to improve disability management, which is focused on active case management and proper support for ill and injured employees so they can return to work in a timely way. These reforms complement others such as the introduction of a 50-50 cost sharing for public-sector pension contributions, and the elimination of severance pay to public servants for voluntary departures.
Through these and other measures, the Secretariat is continuing to support productivity and efficiency in the public service to provide Canadians the best value for tax dollars. I invite you to read the 2012–13 Departmental Performance Report to see how the Secretariat is contributing to the modernization of the Government of Canada for the 21st century.
Original signed by
The Honourable Tony Clement
President of the Treasury Board
Erratum
Subsequent to tabling in Parliament and online publication of its 2012-2013 Departmental Performance Report (DPR), Treasury Board of Canada Secretariat determined that one table in both the English and French HTML versions was not included in Section III.
This table, which contains supplementary information on User Fees Reporting, can be found under Section III of the 2012-13 DPR.
The English and French HTML versions have been updated and a hyperlink to this table has been included on TBS's website.
Table of Contents
- President's Message
- Organizational Overview
-
Analysis of Programs and Sub-Programs by Strategic Outcome
-
Strategic Outcome
-
Strategic Outcome: Government is well managed and accountable, and resources are allocated to achieve results
-
Management Frameworks
- Performance Analysis and Lessons Learned
- 1.1.1 Strategic Management and Governance
- 1.1.2 Sound Management and Decision Making
- 1.1.3 Service Modernization
- 1.1.4 Information Management, Access and Privacy
- 1.1.5 Management of Information Technology
- 1.1.6 Government Security
- 1.1.7 Communications and Corporate Identity
- 1.1.8 Regulatory Management
- People Management
- Expenditure Management
- Financial Management
- Government-Wide Funds and Public Service Employer Payments
-
Management Frameworks
- Internal Services
-
Strategic Outcome: Government is well managed and accountable, and resources are allocated to achieve results
-
Strategic Outcome
- Supplementary Information
Raison d’être
The Treasury Board of Canada Secretariat (Secretariat) is the administrative arm of the Treasury Board, and the President of the Treasury Board is the Minister responsible for the Secretariat. This organization supports the Treasury Board by making recommendations and providing advice on program spending, regulations and management policies and directives, while respecting the primary responsibility of deputy heads in managing their organizations and their roles as accounting officers before Parliament. In this way, the Secretariat strengthens the way government is managed and helps to ensure value for money in government spending and results for Canadians.
Responsibilities
The Secretariat makes recommendations and supports the Treasury Board in each of its roles (see text box “Treasury Board Roles”).
Within the Secretariat, the Comptroller General of Canada provides government-wide leadership, direction, oversight and capacity building for financial management, internal audit and the management of assets and acquired services.
The Chief Human Resources Officer leads people management across the core public administration by developing workplace and workforce policies and programs; by centrally managing labour relations, compensation, and pension and benefit plans; and by developing executive leadership.
The Chief Information Officer provides government-wide leadership, direction, oversight and capacity building for information management, information technology, government security (including identity management), access to information, privacy, and internal and external service delivery.
The Treasury Board Portfolio consists of the Secretariat and the Canada School of Public Service. The Public Service Pension Investment Board, the Office of the Commissioner of Lobbying of Canada and the Office of the Public Sector Integrity Commissioner of Canada are arm's-length organizations that report to Parliament through the President of the Treasury Board.
When working with federal departments, agencies and Crown corporations, the Secretariat plays three central agency roles:
- A leadership role in driving and modelling excellence in public sector management;
- A challenge and oversight role that includes reporting on the government's management and budgetary performance and developing government-wide management policies and standards; and
- A community enabling role to help organizations improve management performance.
Treasury Board Roles
The Treasury Board is a Cabinet committee of ministers established in 1867. It oversees the government's financial, human resources and administrative responsibilities and establishes policies that govern each of these areas. In addition, the Prime Minister has designated the Treasury Board to act as the committee of the Queen's Privy Council for the consideration and approval of regulations and most orders-in-council. The Treasury Board, as the Management Board for the government, has three principal roles:
- It acts as the government's Management Office by promoting improved management performance. It also approves policies to support the prudent and effective management of the government's assets and financial, information and technology resources.
- It acts as the government's Budget Office by examining and approving the proposed spending plans of government departments and by reviewing the development of approved programs.
- It acts as the human resources office and the employer or People Management Office by managing compensation and labour relations for the core public administration. It also sets people management policies (including determining the terms and conditions of employment) to ensure coherence and consistency, where needed.
Strategic Outcome and Program Alignment Architecture
The Secretariat's Program Alignment Architecture (PAA) is made up of six programs that contribute to the achievement of the Secretariat's strategic outcome. Detailed information about the Secretariat's strategic outcome and about each of the programs in the PAA can be found in Analysis of Programs and Sub-Programs by Strategic Outcome.
2012–13 Program Alignment Architecture
-
1.1 Management Frameworks
- 1.1.1 Strategic Management and Governance
- 1.1.2 Sound Management and Decision Making
- 1.1.3 Service Modernization
- 1.1.4 Information Management, Access and Privacy
- 1.1.5 Management of Information Technology
- 1.1.6 Government Security
- 1.1.7 Communications and Corporate Identity
- 1.1.8 Regulatory Management
-
1.2 People Management
- 1.2.1 Direction Setting
- 1.2.2 Enabling Infrastructure
- 1.2.3 Comprehensive Management of Compensation
-
1.3 Expenditure Management
- 1.3.1 Results-Based Expenditure Management
- 1.3.2 Expenditure Management Advice and Reporting
- 1.3.3 Compensation Expenditure Management
-
1.4 Financial Management
- 1.4.1 Financial Management, Oversight and Reporting
- 1.4.2 Internal Audit
- 1.4.3 Assets and Acquired Services
- 1.5 Government-Wide Funds and Public Service Employer Payments
-
1.6 Internal Services
- 1.6.1 Governance and Management Support
- 1.6.1.1 Management and Oversight Services
- 1.6.1.2 Communications Services
- 1.6.1.3 Legal Services
- 1.6.2 Resource Management Services
- 1.6.2.1 Human Resources Management Services
- 1.6.2.2 Financial Management Services
- 1.6.2.3 Information Management Services
- 1.6.2.4 Information Technology Services
- 1.6.2.5 Travel and Other Administrative Services
- 1.6.3 Asset Management Services
- 1.6.3.1 Real Property Services
- 1.6.3.2 Materiel Services
- 1.6.3.3 Acquisition Services
- 1.6.1 Governance and Management Support
Organizational Priorities
In its 2012–13 Report on Plans and Priorities, the Secretariat established four organizational priorities that contribute to its strategic outcome, “Government is well managed and accountable, and resources are allocated to achieve results.”
- Priority 1: Support the government in ensuring value for money
- Priority 2: Advance initiatives to modernize government operations
- Priority 3: Enable a modern and sustainable approach to people management
- Priority 4: Pursue greater efficiency and effectiveness within the Secretariat
The results achieved under each priority are briefly summarized below. Further information on these results can be found in the Performance Analysis and Lessons Learned section of each of the Secretariat’s programs in Analysis of Programs and Sub-Programs by Strategic Outcome.
| Type | Strategic Outcome(s) and/or Program(s) |
|---|---|
| Ongoing | |
| Summary of Progress | |
|
The Secretariat followed through on plans identified in its 2012–13 Report on Plans and Priorities to support this priority. The Secretariat, for example:
Efforts in this area contributed to the government’s management agenda by ensuring value for money in government programs, services and operations. This priority contributed to the Secretariat’s strategic outcome by ensuring that government resources are effectively allocated to achieve results. More details on related initiatives and results achieved in support of this priority can be found in the Performance Results section under Program 1.3: Expenditure Management and Program 1.4: Financial Management. |
|
| Type | Strategic Outcome(s) and/or Program(s) |
|---|---|
| Ongoing | |
| Summary of Progress | |
|
The Secretariat moved forward on a number of plans identified in its 2012–13 Report on Plans and Priorities to support this priority. The Secretariat, for example:
Results achieved in support of this priority increased the overall efficiency and effectiveness of government operations, and responded to the evolving expectations of Canadians. This priority contributed to the Secretariat's strategic outcome by enabling well-managed and accountable government. More details on related initiatives and results achieved in support of this priority can be found in the Performance Results section under Program 1.1: Management Frameworks. |
|
| Type | Strategic Outcome(s) and/or Program(s) |
|---|---|
| Ongoing | |
| Summary of Progress | |
|
The Secretariat achieved significant progress on plans identified in its 2012–13 Report on Plans and Priorities to address this priority. The Secretariat, for example:
The Secretariat supported Economic Action Plan 2012 initiatives by working collaboratively with deputy heads to implement an integrated, long-term view of workforce planning and performance across government. This priority contributed to well-managed and accountable government by advancing a modern and efficient approach to human resources management across the core public administration. More details on related initiatives and results achieved in support of this priority can be found in the Performance Results section under Program 1.2: People Management and Program 1.3: Expenditure Management. |
|
| Type | Strategic Outcome(s) and/or Program(s) |
|---|---|
| Ongoing | |
| Summary of Progress | |
|
The Secretariat made progress on plans identified in its 2012–13 Report on Plans and Priorities to pursue greater efficiency and effectiveness within the Secretariat. The Secretariat, for example:
This priority contributed to the Secretariat's strategic outcome by ensuring that its human and financial resources and internal processes are optimized to support key results across all its programs. More details on related initiatives and results achieved in support of this priority can be found in the Performance Results section under Program 1.6: Internal Services. |
|
Risk Analysis
The Secretariat actively monitors its operating environment in order to identify and manage risks that could affect progress toward its strategic outcome and organizational priorities. Key risks are captured in the Secretariat's corporate risk profile (CRP), which is updated at least once per year. Starting in 2012–13, the time horizon for the CRP shifted from one year to three years. This change brought a broader perspective to risk discussions and supports the Secretariat in managing longer-term, strategic initiatives.
As part of the 2012–15 CRP exercise, the Secretariat identified and developed risk responses for its corporate risks. In 2012–13, concrete actions were taken to manage these risks and, where the risk continues over a longer period of time, these steps form part of an ongoing strategy.
| Risk | Risk Response Strategy | Link to Program Alignment Architecture | Link to Organizational Priorities |
|---|---|---|---|
|
Given the dynamic fiscal environment in which the Secretariat operates, the Secretariat was challenged to effectively enable the achievement of new and emerging fiscal objectives as departments and agencies worked to implement a number of ongoing restraint initiatives. |
The Secretariat focused on building and maintaining its internal capacity and on effectively supporting departments and agencies to respond to the government’s fiscal objectives. |
Priority 1: Support the government in ensuring value for money |
|
|
The drive for greater efficiency created an opportunity to accelerate government modernization. At the same time, the increased complexity and pace of change presented challenges for the Secretariat in enabling the implementation of wide-scale standardization and consolidation of government systems and processes. |
The Secretariat focused on ensuring that appropriate policies, frameworks, tools and guidance are in place to support the standardization and consolidation of government-wide systems. |
Priority 2: Advance initiatives to modernize government operations |
|
|
As government sought to strike the right balance between innovation, risk and control, adopting a simplified, risk-based approach to management oversight remained a key challenge for the Secretariat. |
The Secretariat increased its focus on adopting and promoting risk-based approaches to management oversight, reducing unnecessary reporting requirements and promoting the shift toward greater accountability for deputy heads. |
Priority 2: Advance initiatives to modernize government operations |
During the period under review, the Secretariat continued to be at the centre of the government’s commitment to modernize and transform government. It provided leadership and guidance to support more cost-effective approaches government-wide, while simultaneously pursuing greater efficiency and effectiveness in its own operations.
The Secretariat also continued to support the government’s focus on reducing costs and ensuring value for money. In Economic Action Plan 2012, the government committed to achieving ongoing savings of $5.2 billion, with improvements to operational efficiencies accounting for 70 per cent of the savings. At the same time, departments and agencies were implementing decisions taken as part of the previous Strategic Review exercise.
In the context of this environment, the Secretariat effectively managed risks identified in its 2012–15 CRP by developing risk response strategies and successfully implementing a number of specific mitigation measures. The Secretariat, for example:
- Supported departments, agencies and functional communities in addressing cost-reduction adjustments by:
- Establishing appropriate communications strategies in support of government fiscal objectives;
- Providing guidance on estimating workforce adjustment costs to organizations implementing Economic Action Plan 2012 deficit reduction measures, as well as directly supporting the regional development agencies in achieving deficit reduction targets by consolidating their internal audit functions at the Secretariat;
- Collaborating with partners (such as the Canada School of the Public Service and the Public Service Commission) to provide deputy heads with integrated tools, guidance and discussion forums. This included data analysis on attrition and workforce adjustment and on trends in hiring to support placing affected employees and for continued recruitment; and
- Temporarily modifying the rules for carrying forward unspent amounts to address the retroactive costs of collective bargaining settlements to be borne by departments during the operating budget freeze.
- Engaged deputy heads and functional communities through a variety of initiatives to support the standardization and consolidation of government-wide systems, including:
- Completing a model to enable standardization, transfer and exchange of data and information within and across departments. This model integrates performance, financial and human resources information to support evidence-based decisions and resource allocation;
- Overseeing the completion of the Cyber Authentication Renewal Initiative, which resulted in the replacement of Secure Channel epass. This initiative modernizes the manner in which clients access government online services, while reducing annual operational costs by over $35 million; and
- Supporting all levels of the financial management community through a number of initiatives, including the Chief Financial Officer Talent Management Initiative, to ensure that future financial management executive leaders are identified and possess the competencies necessary to fulfill upcoming opportunities.
- Continued to review and propose adjustments to the Treasury Board policy suite in order to embed risk-based decision making across management functions and reduce administrative burden through such initiatives as:
- Implementing a new quarterly electronic Inventory of Government of Canada Organizations that streamlines reporting requirements for federal organizations, resulting in increased efficiencies and more timely updates than the former annual report to Parliament;
- Instituting policy changes to ensure adequate disclosure of significant departmental events, and their associated costs, to departmental ministers;
- Developing and updating web-related policies in support of the Web Renewal initiative announced in Economic Action Plan 2013; and
- Amending provisions of the official languages policy suite for deputy heads to delegate decisions on the non-imperative staffing of bilingual positions to reduce administrative burden on institutions.
Through these and a number of other measures, some of which are complete and some ongoing, the Secretariat successfully managed its risks during 2012–13. Moving forward, the Secretariat will continue to review and assess its corporate risks, and adapt and adjust its risk response strategies and mitigation measures, as required.
Summary of Performance
| Total Budgetary Expenditures (Main Estimates 2012–13) | Planned Spending 2012–13 | Total Authorities (available for use) 2012–13 | Actual Spending (authorities used) 2012–13 | Difference (Planned vs. Actual Spending) |
|---|---|---|---|---|
| 5,685,174 | 5,693,376 | 4,003,118 | 2,762,026 | 2,931,350 |
| Planned 2012–13 | Actual 2012–13 | Difference 2012–13 |
|---|---|---|
| 2,066 | 1,914 | 152 |
Performance Summary Table for Strategic Outcome: Government is well managed and accountable, and resources are allocated to achieve results
| Program | Total Budgetary Expenditures (Main Estimates 2012–13) | Planned Spending | Total Authorities (available for use) 2012–13 | Actual Spending (authorities used) |
Alignment to Government of Canada Outcomes | ||||
|---|---|---|---|---|---|---|---|---|---|
| 2012–13 | 2013–14 | 2014–15 | 2012–13 | 2011–12 See endnote 1* | 2010–11 See endnote 1* | ||||
|
Notes:
|
|||||||||
| Management Frameworks | 53,878 | 59,741 | 53,842 | 50,963 | 64,764 | 58,544 | 65,304 | 57,643 | Government Affairs: Well-managed and efficient government operations |
| People Management | 57,710 | 59,431 | 51,859 | 47,286 | 62,253 | 60,975 | 65,444 | 64,923 | |
| Expenditure Management | 35,295 | 35,295 | 32,866 | 32,104 | 33,879 | 31,047 | 50,893 | 30,167 | |
| Financial Management | 32,912 | 32,912 | 32,613 | 32,524 | 33,962 | 30,867 | 36,470 | 36,940 | |
| Government-Wide Funds and Public Service Employer Payments | 5,430,433 | 5,430,433 | 5,420,474 | 5,411,574 | 3,718,185 | 2,500,373 | 2,192,869 | 1,968,478 | |
| Strategic Outcome Subtotal | 5,610,228 | 5,617,812 | 5,591,654 | 5,574,450 | 3,913,043 | 2,681,805 | 2,410,980 | 2,158,151 | |
| Internal Services | Total Budgetary Expenditures (Main Estimates 2012–13) | Planned Spending | Total Authorities (available for use) 2012–13 | Actual Spending (authorities used) |
||||
|---|---|---|---|---|---|---|---|---|
| 2012–13 | 2013–14 | 2014–15 | 2012–13 | 2011–12 See endnote 2* | 2010–11 See endnote 2* | |||
|
Notes:
|
||||||||
| Internal Services Subtotal | 74,946 | 75,564 | 71,245 | 67,704 | 90,075 | 80,221 | 93,528 | 95,829 |
| Strategic Outcome and Internal Services | Total Budgetary Expenditures (Main Estimates 2012–13) | Planned Spending | Total Authorities (available for use) 2012–13 | Actual Spending (authorities used) |
||||
|---|---|---|---|---|---|---|---|---|
| 2012–13 | 2013–14 | 2014–15 | 2012–13 | 2011–12 See endnote 3* | 2010–11 See endnote 3* | |||
|
Notes:
|
||||||||
| Total | 5,685,174 | 5,693,376 | 5,662,899 | 5,642,154 | 4,003,118 | 2,762,026 | 2,504,508 | 2,253,980 |
The above tables provide the total budgetary expenditures (Main Estimates), the planned spending, the authorities and the actual spending for 2012–13. These are discussed by program in Analysis of Programs and Sub-Programs by Strategic Outcome. For comparison purposes, the planned spending is provided for two future years, and the actual spending for two prior years.
Approximately 60 per cent of the planned spending for Program 1.5 Government-Wide Funds and Public Service Employer Payments is transferred to, and spent by, other departments and agencies for items such as operating and capital budget carry forward, severance, parental benefits and compensation requirements (Votes 5, 10, 15, 25, 30 and 33). The Secretariat’s total authorities are reduced accordingly. The most significant difference between the planned and the actual spending (on average $3.2 billion per year) relates to the amounts that were distributed from these votes to other departments and agencies (expenditures appear in their operating votes). The balance of funding within the program is for public service employer payments.
Overall, planned spending decreased by $30.5 million from 2012–13 to 2013–14 and by $20.7 million from 2013–14 to 2014–15. Reductions are primarily due to Economic Action Plan 2012 cost-containment measures and the 2008 Strategic Review of Vote 20. Overall, actual spending increased by $250.5 million from 2010–11 to 2011–12 and by $257.5 million from 2011–12 to 2012–13, as outlined below.
Actual spending for the Secretariat’s operations increased by $26.1 million from 2010–11 to 2011–12, largely as a result of one-time expenditures related to the professional service costs for external experts to support the review of departmental spending across government and payouts to employees resulting from the revision of specific collective agreements. These increases were offset by reductions related to the 2010 Strategic Review decisions and a transfer to Shared Services Canada.
Actual spending for the Secretariat's operations (i.e., excluding Government-Wide Funds and Public Service Employer Payments) decreased by $50 million from 2011–12 to 2012–13, largely as a result of the following:
- One-time expenditures related to the professional service costs for external experts to support the review of departmental spending across government;
- Payouts to employees resulting from the revision of specific collective agreements;
- Further reductions related to Economic Action Plan 2012 cost-containment measures;
- Project delays; and
- Deferral of staffing plans.
Net public service employer payments increased by approximately $224 million from 2010–11 to 2011–12 as a result of a one-time lump sum payment for the improvement of long-term disability benefits provided under the Service Income Security Insurance Plan, as well as increased payments under the various other public service health benefit plans. These increases were offset by the transfer of the management of pension, insurance and social security programs for locally engaged staff to Foreign Affairs and International Trade Canada See footnote [1] and to National Defence.
An increase of $307.5 million from 2011–12 to 2012–13 largely resulted from a statutory payment for an actuarial adjustment made in virtue of the Public Service Superannuation Act, which was offset by a decrease due to the one-time payment for the long-term disability benefits, referenced above.
Expenditure Profile
Figure 1: Treasury Board of Canada Secretariat 2012–13 Actual Spending ($ millions)
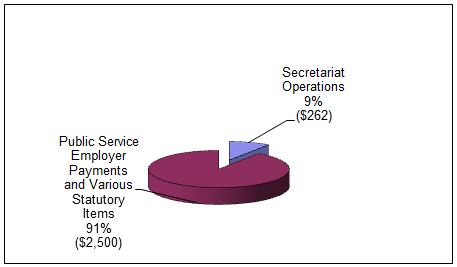
Figure 1: Treasury Board of Canada Secretariat 2012–13 Actual Spending - Text version
The Secretariat spent a total of $2.76 billion toward achieving its strategic outcome. Approximately 9 per cent of total spending represents expenditures for its operations. The remainder relates to funds for public service employer payments that the Secretariat manages centrally on the government's behalf.
Figure 2: Treasury Board of Canada Secretariat Public Service Employer Payments 2012–13 Actual Spending ($ millions)
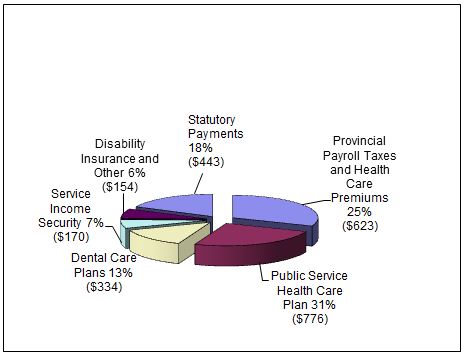
Total spending for public service employer payments was $2.50 billion in 2012–13. This included statutory payments and payments under 16 public service benefit plans and associated expenditures.
Figure 3: Spending Trend for Program Expenditures (Vote 1)
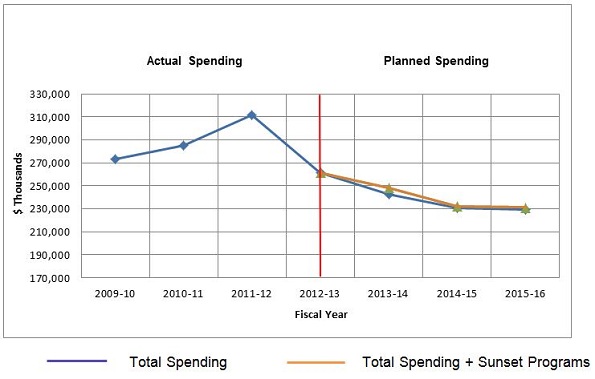
Figure 3: Spending Trend for Program Expenditures (Vote 1) - Text version
The Secretariat’s program expenditures include salaries, non-salary costs that support its operations, and contributions to employee benefit plans for its own employees, as well as other statutory payments.
The increase in spending from 2009–10 to 2011–12 is largely due to one-time expenditures related to professional service costs for external experts to support the review of departmental spending across government, and to payouts to employees resulting from the revision of specific collective agreements.
Decreases from 2011–12 to 2015–16 are mostly a result of Strategic Review 2010 reductions, transfers to Shared Services Canada and Public Works and Government Services Canada, and Economic Action Plan 2012 cost-containment measures.
Figure 4: Spending Trend for Public Service Employer Payments and Various Statutory Items (Vote 20)
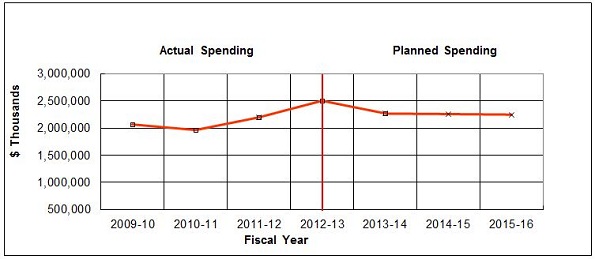
Expenditures for public service employer payments and statutory items include the payment of the employer’s share of contributions required under the various insurance plans sponsored by the Government of Canada. These amounts also include statutory items for payments under the Public Service Pension Adjustment Act (PSPAA); pay equity settlements, pursuant to section 30 of the Crown Liability and Proceedings Act; and employer contributions made under the Public Service Superannuation Act (PSSA), other retirement Acts and the Employment Insurance Act.
Net public service employer payments increased by approximately $224 million from 2010–11 to 2011–12 as a result of a one-time lump sum payment for improvement of long-term disability benefits provided under the Service Income Security Insurance Plan, and increased payments under the various other public service health benefit plans. These increases were offset by the transfer of the management of pension, insurance and social security programs for locally engaged staff to Foreign Affairs and International Trade Canada See footnote [2] and to National Defence.
Public service employer payments increased by $307.5 million from 2011–12 to 2012–13, mostly as a result of a $443 million actuarial adjustment to employer contributions made under the PSSA. The actuarial adjustment was offset by a decrease of $112.4 million due to a one-time payment under the Service Income Security Insurance Plan and by savings in the Public Service Health Care Plan and payroll taxes. This actuarial adjustment is not reflected in planned spending as it was not known at the time. It will be included in planned and actual spending in future years.
Planned spending between 2013–14 and 2015–16 will decrease by $19.1 million; the figures are based on approved authorities and are relatively stable over the planning horizon.
Estimates by Vote
For information on the Secretariat’s organizational votes and statutory expenditures, please see the Public Accounts of Canada 2013 (Volume II).
Contribution to the Federal Sustainable Development Strategy (FSDS)
The Federal Sustainable Development Strategy (FSDS) outlines the Government of Canada's commitment to improving the transparency of environmental decision making by articulating its key strategic environmental goals and targets.
The Secretariat ensures that consideration of these outcomes is an integral part of its decision-making processes. The Secretariat contributes to Theme IV of the FSDS, Shrinking the Environmental Footprint – Beginning with Government, as denoted by the following visual identifier.

During 2012–13, the Secretariat reviewed the environmental effects of initiatives subject to the Cabinet Directive on the Environmental Assessment of Policy, Plan and Program Proposals. Based on this review, it was determined that for 2012–13, there were no Strategic Environmental Assessments (SEAs) required for any initiatives led or co-led by the President of the Treasury Board under Theme IV of the FSDS, Shrinking the Environmental Footprint – Beginning with the Government.
For additional details on the Secretariat's activities to support sustainable development and SEAs, please consult the Secretariat's website. For complete details on the FSDS, see the Environment Canada website.
Strategic Outcome
The results achieved in support of the Secretariat's strategic outcome strengthen the effectiveness and efficiency of the federal government; support decision making by Parliament, the Treasury Board and Cabinet; and ensure that Canadians are well served by a government that is accountable and transparent. Effective government contributes to Canada's competitive advantage, providing a strong foundation for security, stability and prosperity.
The following links connect to performance summaries for each of the Secretariat's programs, which report progress against expected results, performance indicators and targets in line with the Policy on Management, Resources and Results Structures. Financial and human resources for each program as well as performance highlights for 2012–13 are also included.
The Secretariat’s 2012–13 Program Alignment Architecture (PAA) provides the basis of performance reporting in this report. In a few instances, expected results, performance indicators and targets included in the 2012–13 Report on Plans and Priorities have been updated or amended. The changes reflect a more targeted scope for data collection as a result of the assessment of fewer areas of management under the Management Accountability Framework for 2012–13, as well as efforts to strengthen some indicators.
2012–13 Program Alignment Architecture
-
1.1 Management Frameworks
- 1.1.1 Strategic Management and Governance
- 1.1.2 Sound Management and Decision Making
- 1.1.3 Service Modernization
- 1.1.4 Information Management, Access and Privacy
- 1.1.5 Management of Information Technology
- 1.1.6 Government Security
- 1.1.7 Communications and Corporate Identity
- 1.1.8 Regulatory Management
- 1.2 People Management
- 1.3 Expenditure Management
- 1.4 Financial Management
- 1.5 Government-Wide Funds and Public Service Employer Payments
- 1.6 Internal Services
Strategic Outcome: Government is well managed and accountable, and resources are allocated to achieve results
| Performance Indicator | Target | Actual Result |
|---|---|---|
| Canada’s ranking in The World Bank’s Worldwide Governance Indicators, for the third indicator, “Government Effectiveness” | Top ten among Organisation for Economic Co-operation and Development (OECD) member countries (annually) | The World Bank’s Worldwide Governance Indicators rank Canada sixth among OECD countries for government effectiveness |
The World Bank's Government Effectiveness Index (GEI) is one of six indices included in the World Bank's Worldwide Governance Indicators, which are issued annually. In 2012, Canada ranked 6th out of 34-OECD countries. The GEI captures perceptions of the quality of public services; the quality of the civil service and the degree of its independence from political pressures; and the quality of policy formulation and implementation, and the credibility of the government's commitment to such policies.
Program 1.1 Management Frameworks
The Management Frameworks Program establishes principles for sound governance and management in the Government of Canada by helping ministers set government-wide policy direction in targeted areas. These areas include service and program modernization, information management, information technology, security, communications and regulatory management.
This program achieves its results by communicating clear expectations for deputy heads and by adopting principles-based approaches and risk-informed oversight. Working with departments, agencies and functional communities (e.g., regulation, information technology, security), the Secretariat provides leadership, oversight, assessment and guidance in areas related to management policy and regulatory development, compliance and performance reporting. This work also includes responding to emerging public sector management issues and promoting informed risk-taking, innovation, cost-effectiveness, efficiency, transparency and accountability.
This program is underpinned by a broad set of enabling legislation, including the Financial Administration Act and the Federal Accountability Act.
| Total Budgetary Expenditures (Main Estimates) 2012–13 |
Planned Spending 2012–13 |
Total Authorities (available for use) 2012–13 |
Actual Spending (authorities used) 2012–13 |
Difference (Planned vs. Actual Spending) |
|---|---|---|---|---|
| 53,878 | 59,741 | 64,764 | 58,544 | 1,197 |
| Planned 2012–13 | Actual 2012–13 | Difference 2012–13 |
|---|---|---|
| 455 | 412 | 43 |
In 2012–13, the difference between the amounts under Main Estimates and Total Authorities is due to the receipt of funding for the Human Resources Modernization (HRMOD) initiative and cyber security and to the transfers from the Treasury Board central vote for severance payments and parental leave. Program spending aligned with planned spending, but incurred year-end surpluses due to project delays, notably in the areas of HRMOD and cyber security, and to the deferral of staffing plans.
| Expected Results | Performance Indicators | Targets | Actual Results |
|---|---|---|---|
| Continuous improvement in the quality of public service management in the Government of Canada | Percentage of departments and agencies that obtained a MAF rating of at least “Acceptable” for citizen-focused service, management of security, integrated risk management, information management, and information technology | 75% by March 2013 | 100% for integrated risk management |
Consistent with its initiatives to reduce the reporting burden on departments, the Secretariat implemented a targeted approach to the 2012–13 Management Accountability Framework (MAF) exercise and did not require the assessment of all areas of management. Of the five areas of management that feed this indicator, MAF 2012–13 required only the assessment of integrated risk management. All departments and agencies assessed demonstrated that they had integrated risk management into their strategic and operational planning processes.
Performance Analysis and Lessons Learned
Through the Management Frameworks Program, the Secretariat continued to support improved management performance and accountability within departments and agencies by implementing a range of plans set out in its 2012–13 Report on Plans and Priorities. The Secretariat, for example:
Advanced Open Government
- Released Canada's Action Plan on Open Government, with 12 commitments that support open information, open data and open dialogue with Canadians. These commitments will advance work to foster greater openness and accountability; provide more opportunities to learn about and participate in government; drive innovation and economic opportunities for all Canadians; and create a more cost-effective, efficient and responsive government.
Cut Regulatory Red Tape
-
Released the Red Tape Reduction Action Plan to address a broad range of irritants to businesses and the systemic barriers that frustrate and burden Canadian business with unnecessary delays and costs. As part of the Action Plan, the Secretariat:
- Implemented the “One-for-One” Rule. Under this rule, regulatory changes that impose new administrative burden on business must be offset with an equivalent reduction in administrative burden from the set of regulations that currently exist. In addition, regulating departments and agencies are required to remove an existing regulation when an entirely new regulation they introduce imposes administrative burden on business. In 2012–13, 26 final regulations subject to the “One-for-One” Rule were published in the Canada Gazette, resulting in a net reduction of approximately $3 million in administrative burden for businesses and 6 fewer regulations.
- Launched the Small Business Lens for departments and agencies, including detailed guidance. Federal organizations are now responsible for applying the lens when designing regulations, and for being sensitive and responsive to the impacts that regulations can have on small business.
- In response to a recommendation in the Mid-Term Evaluation of the Implementation of the Cabinet Directive on Streamlining Regulation, a database was implemented, along with other tools, to monitor the compliance of regulatory proposals with the federal regulatory policy. This helped to inform the development of the “One-for-One” Rule and Small Business Lens.
Reduced Administrative Burden
- Advanced a targeted review of Treasury Board policy instruments to simplify internal management rules and reduce the administrative and reporting burden placed on departments and agencies. The Secretariat also advanced an efficient, risk-based approach to management oversight. By 2012–13, 91 per cent of Treasury Board frameworks and policies and 70 per cent of mandatory supporting policy instruments were renewed, which included a focus on reducing reporting burden for departments.
- Launched consultations with deputy heads to develop a new approach to assessing departmental performance in meeting MAF expectations, which will significantly reduce the reporting burden for departments and increase the value of these assessments.
Supported the Consolidation of Information Technology Services
- In Economic Action Plan 2013, announced the consolidation and standardization of software procurement for federal employees’ end-user devices, which will result in an annual savings of $8.7 million beginning in 2014–15. Moving forward, the government will explore further whole-of-government approaches to reduce costs in the area of procurement of end-user devices and associated support services.
- Developed a Web Renewal Action Plan to significantly reduce the number of Government of Canada websites, modernize the government’s web processes and tools, reduce the costs of online publishing, and develop and implement web standards. This initiative, for implementation in 2013–14, provides an opportunity to rethink how the government serves, communicates with and engages Canadians and Canadian businesses.
- Created a joint policy steering committee to align Treasury Board policy requirements with the Shared Services Canada operational model in order to facilitate the consolidation of government information technology services (i.e., email, data centre and network services, end-user devices).
Standardized Business Processes
- Continued efforts to standardize, modernize and consolidate human resources systems and processes in implementing the Common Human Resources Business Process across government and advancing work on the first common human resource system.
- Developed a financial management transformation strategy aimed at increasing the standardization of financial business processes and common financial systems.
Sub-Program 1.1.1 Strategic Management and Governance
Through the Strategic Management and Governance sub-program, the Secretariat provides leadership across the Government of Canada to establish a broad management agenda and promote strategic approaches to crosscutting policy issues on public sector management. Policy centres and federal institutions receive advice and support to maintain the integrity of the suite of Treasury Board policies, to review and refine policy instruments to ensure they reflect government priorities, to achieve management goals, to appropriately manage risk and to impose minimal administrative burden.
Sub-program 1.1.1 also identifies new and emerging management and governance issues; promotes increased productivity and innovation in management practices; advances modern reporting; and develops efficient, cost-effective approaches to planning, risk management and oversight and to strengthening the government’s operating environment.
| Planned Spending 2012–13 | Actual Spending 2012–13 | Difference 2012–13 |
|---|---|---|
| 4,504 | 4,131 | 373 |
| Planned 2012–13 | Actual 2012–13 | Difference 2012–13 |
|---|---|---|
| 40 | 36 | 4 |
Actual spending and FTEs aligned with plans.
| Expected Results | Performance Indicators | Targets | Actual Results |
|---|---|---|---|
| Federal institutions are equipped with policy instruments to meet their accountabilities and achieve results | Percentage of active policy instruments that meet or exceed expected maturity milestones | 100% by 2013–14 | 64% and ongoing |
Maturity milestones refer to the four stages that policy instruments undergo as they are implemented and put into effect: awareness, adoption, achieving results and optimization. In 2012–13, satisfactory progress was made toward the 2013–14 target. Once the 2013–14 target is met, a baseline will be established from which future targets will be set.
Sub-Program 1.1.2 Sound Management and Decision Making
Through the Sound Management and Decision Making sub-program, the Secretariat provides independent strategic advice, guidance and support to federal organizations for implementing and applying Treasury Board policies, government priorities, risk-management strategies and performance management in support of sound decision making.
Sub-program 1.1.2 includes the Secretariat’s advice and guidance on resource allocation, risks and policy compliance provided to departments and agencies during the due diligence review of Treasury Board submissions.
It also includes the Secretariat’s MAF activities, which set out the Treasury Board’s expectations for good public service management. MAF is an integrated assessment tool that helps managers, deputy heads and central agencies assess progress and strengthen accountability for management results through clear indicators and measures that gauge performance over time. This sub-program captures the strategic direction and continuous evolution of MAF, which is informed by the management expectations set out in other sub-programs of the Secretariat’s PAA.
| Planned Spending 2012–13 | Actual Spending 2012–13 | Difference 2012–13 |
|---|---|---|
| 13,461 | 13,671 | (210) |
| Planned 2012–13 | Actual 2012–13 | Difference 2012–13 |
|---|---|---|
| 117 | 114 | 3 |
Actual spending and FTEs aligned with plans.
| Expected Results | Performance Indicators | Targets | Actual Results |
|---|---|---|---|
| Advice and direction provided to departments and agencies support sound management and decision making within departments and agencies | Percentage of a representative group of deputy heads in agreement that the advice and direction provided by the Secretariat supports sound management and decision making | 70% by March 2013 | 95% |
| Percentage of departments and agencies that obtained a MAF rating of at least “Acceptable” for use of information for decision making | 80% by March 2013 | 89% |
In the areas of sound management and decision making, the Secretariat performed well regarding both performance targets. For the first indicator, 95 per cent of deputy heads agreed that the Secretariat’s advice and direction support sound management and decision making.
For the second indicator, results reflect the average of MAF ratings for individual lines of evidence pertaining to “use of information for decision making” within the areas of management for internal audit, evaluation, integrated risk management, financial management and control, and people management.
Sub-Program 1.1.3 Service Modernization
Through the Service Modernization sub-program, the Secretariat provides direction and oversight to federal organizations to enhance internal and external service delivery efficiency and to improve service experiences and outcomes for individuals, businesses and employees.
Sub-program 1.1.3 works to promote client-centred service; build operational efficiency through a whole-of-government approach to service delivery; develop a culture of collaboration and service excellence; integrate multi-channel service delivery through effective use of modern technology; and enable the effective use of online technologies, including social media and collaborative technologies. This is accomplished through research, analysis, development and maintenance of policies and related policy instruments, community engagement, and leadership.
The authority for this sub-program is the Financial Administration Act.
| Planned Spending 2012–13 | Actual Spending 2012–13 | Difference 2012–13 |
|---|---|---|
| 8,746 | 10,549 | (1,803) |
| Planned 2012–13 | Actual 2012–13 | Difference 2012–13 |
|---|---|---|
| 56 | 52 | 4 |
Planned spending includes amounts approved through the Main Estimates, with the addition of funding for the Human Resources Modernization (HRMOD) initiative. Actual spending was on target due to funds received throughout the year.
| Expected Results | Performance Indicators | Targets | Actual Results |
|---|---|---|---|
| Departments and agencies are equipped with knowledge and guidance to implement sound service and Web 2.0 management practices | Percentage of planned policy activities completed | 80% by March 2013 | 93% |
In the area of service modernization, the Secretariat exceeded its performance target. In 2012–13, work progressed on a suite of service policy instruments, including the completion of the Guideline on Service Standards and two companion guidelines on service agreements.
At the same time, the Secretariat also adjusted its policy development priorities to respond to emerging priorities. This included the development of a new policy for acceptable and efficient use of Government of Canada electronic networks and devices, and a new standard to enable strategic and coherent management of Government of Canada official social media accounts.
Sub-Program 1.1.4 Information Management, Access and Privacy
Through the Information Management, Access and Privacy sub-program, the Secretariat ensures the continual improvement of the management of information across the Government of Canada by providing strategic direction and leadership to federal institutions on record-keeping, business intelligence, data management, web content management, access to information and privacy protection.
Sub-program 1.1.4 is focused on ensuring that information is safeguarded as a public trust and managed as a strategic asset. It further ensures that information is open to the public whenever possible, that Canadians can exercise their right to access and reuse information, and that personal information is protected against unauthorized collection, use and disclosure. The sub-program’s objectives are accomplished by developing and maintaining policy instruments, encouraging collaboration between government institutions, monitoring and overseeing activities, providing leadership and working with partners. This includes community development, learning and outreach activities.
The authority for this sub-program comes from the Financial Administration Act, the Access to Information Act and the Privacy Act.
| Planned Spending 2012–13 | Actual Spending 2012–13 | Difference 2012–13 |
|---|---|---|
| 9,242 | 9,111 | 131 |
| Planned 2012–13 | Actual 2012–13 | Difference 2012–13 |
|---|---|---|
| 62 | 56 | 6 |
Actual spending and FTEs aligned with plans.
| Expected Results | Performance Indicators | Targets | Actual Results |
|---|---|---|---|
| Institutions are equipped with knowledge and guidance to safeguard information as a public trust and manage it as a strategic asset | Percentage of planned policy activities completed | 80% by March 2013 | 94% |
The Secretariat exceeded its performance target with respect to planned policy activities for the reporting period. Specifically, through ongoing policy development, the Secretariat:
- Contributed to the implementation of the Directive on Recordkeeping;
- Supported Open Government initiatives within the Government of Canada; and
-
Contributed to the ongoing modernization of the Access to Information and Privacy program through such initiatives as:
- Treasury Board policy suite renewal;
- Development of policy direction on the use of web analytics to safeguard privacy; and
- Revision of the Access to Information Manual as guidance to departments and agencies on the interpretation of legislation and policy.
Sub-Program 1.1.5 Management of Information Technology
Through the Management of Information Technology sub-program, the Secretariat provides federal organizations with strategic direction and leadership on the management of information technology (IT). Its whole-of-government strategies focus on standardizing, consolidating and re-engineering IT systems to enable effective program and service delivery. The Secretariat also optimizes Government of Canada IT investments through effective management and governance of IT-enabled projects and supports Shared Services Canada, a centralized department that provides email, data centre and network services to the largest departments in the Government of Canada.
Sub-program 1.1.5 objectives are achieved through IT frameworks, policies, directives and standards, such as the Treasury Board Information Technology Standards (TBITS), that guide Government of Canada institutions in implementing specific technical issues. The Secretariat monitors departmental implementation of this sub-program through oversight, evaluation and reporting activities, including a challenge function that seeks to ensure best value for IT and web investments on behalf of taxpayers.
The authority for this program is the Financial Administration Act.
| Planned Spending 2012–13 | Actual Spending 2012–13 | Difference 2012–13 |
|---|---|---|
| 9,330 | 8,649 | 681 |
| Planned 2012–13 | Actual 2012–13 | Difference 2012–13 |
|---|---|---|
| 67 | 67 | 0 |
Actual spending and FTEs aligned with plans.
| Expected Results | Performance Indicators | Targets | Actual Results |
|---|---|---|---|
| Departments and agencies are equipped to move toward standardization and consolidation of the Government of Canada’s web presence and IT solutions | Percentage of planned policy activities completed | 80% by March 2013 | 73% |
| Percentage of departments and agencies showing progress in aligning with strategic direction for standardization, consolidation and re-engineering | 75% by March 2013 | 87% |
In 2012–13, the Secretariat completed 73 per cent of its planned policy activities in the areas of IT management, the Web and IT project oversight. In the area of IT management, the Secretariat achieved 80 per cent of its planned policy activities, despite significant growth in the portfolio. This included the development of the Standard on Enterprise Resource Planning Systems, which directs departments to common systems for financial management and human resource management.
The Secretariat also led the development of the strategy for standardizing, consolidating and re-engineering the procurement of software for federal employees’ end-user devices. 2012–13 marked the third consecutive year of the departmental IT expenditure data collection, which provided more concise information for making government-wide IT investment decisions regarding standardized and consolidated IT solutions. The Secretariat also established an Application Portfolio Management regime that will enable the management of IT applications on a whole-of government scale and aid in the mitigation of risks associated with aging IT.
In the area of the Web, the Secretariat achieved 100 per cent of its planned policy activities within extremely short timelines, including publishing the new Standard on Optimizing Websites and Applications for Mobile Devices, which ensures that Government of Canada information and services are optimized for mobile devices (e.g., smart phones, tablets) so that information and services reach the widest possible audience.
In the area of IT project oversight, the Secretariat achieved 38 per cent of its policy development target, as it diverted resources to support IT costing and Applications Rationalization and the Shared Services Canada transformation. In 2013–14, the Secretariat is continuing work on a data standard intended to establish a mandatory, standardized approach across the Government of Canada enterprise for the collection, tracking and reporting of IT-enabled project information. This standard will focus on a common nomenclature of data elements and their associated definitions and descriptions to support increased horizontal reporting on IT-enabled project performance.
For the second indicator, the Secretariat exceeded its target, with 87 per cent of departments and agencies showing progress in aligning with strategic direction for standardization, consolidation and re-engineering. The Secretariat supported this effort by continuing to promote enterprise solutions to departments and agencies seeking guidance related to IT policy and investments. The Secretariat worked closely with federal organizations to ensure that departmental IT investments were directed toward standardized, consolidated IT solutions, where feasible, in order to optimize IT investments and support efficient and effective delivery of government infrastructure and back office services.
Sub-Program 1.1.6 Government Security
Through the Government Security sub-program, the Secretariat contributes to improving the Government of Canada’s security posture by supporting departmental and government-wide security management to protect information, assets, individuals and services against internal and external threats. Sub-program 1.1.6 focuses on governance, departmental security management (including cyber security), identity management, individual security screening, physical security, security of information and of information technology, security in contracting and the continuity of government operations and services. These activities enable effective and efficient management of security within departments and throughout government.
The objectives of this sub-program are accomplished through developing and maintaining policy instruments; enabling the security community by providing guidance and sharing best practices; encouraging collaboration between departments; monitoring and overseeing security activities; providing leadership and working with partners; developing a cyber authentication renewal and federating identity program in support of service modernization; and supporting Government of Canada strategic security initiatives, including initiatives related to Canada’s Cyber Security Strategy.
The authority for this program derives from the Financial Administration Act.
| Planned Spending 2012–13 | Actual Spending 2012–13 | Difference 2012–13 |
|---|---|---|
| 5,732 | 6,288 | (556) |
| Planned 2012–13 | Actual 2012–13 | Difference 2012–13 |
|---|---|---|
| 43 | 40 | 3 |
Planned spending does not include additional authorities approved during the year for cyber security, severance pay and parental benefits. Some of this new funding remained unspent due to contracting delays.
| Expected Results | Performance Indicators | Targets | Actual Results |
|---|---|---|---|
| Departments and agencies are equipped with knowledge, direction and guidance to implement and evolve sound security management practices | Percentage of planned policy activities completed | 80% by March 2013 | 83% |
The Secretariat advanced work on drafting the Standard on Security Screening of Individuals, the Standard on Security in Contracting and other policy instruments. This work strengthens security management processes within departments government-wide and maintains trust between Canada and its allies in aligning with government modernization.
In addition, the Secretariat introduced the Standard on Identity and Credential Assurance, which enables departments to work together to reduce the risk associated with identifying individuals, organizations and devices for the purposes of providing services and administering programs.
Sub-Program 1.1.7 Communications and Corporate Identity
Through the Communications and Corporate Identity sub-program, the Secretariat helps Government of Canada departments and agencies effectively manage communications and corporate identity within their organizations. Sub-program 1.1.7 is necessary to ensure that federal organizations inform the public of government policies, programs, services and initiatives; consider the public’s views and needs in their development; and visually identify government assets and activities through the official symbols of the Government of Canada.
To meet these goals, the Secretariat proposes government-wide policy direction to Treasury Board ministers, implements approved policy instruments, examines the extent to which departments are in compliance with key policy requirements, and takes corrective measures to address compliance issues. To assist compliance with policy requirements, the Secretariat provides policy interpretation, advice and outreach to all government departments and agencies, in particular to communications staff.
The legislative authority for this program is section 7 of the Financial Administration Act.
| Planned Spending 2012–13 | Actual Spending 2012–13 | Difference 2012–13 |
|---|---|---|
| 876 | 911 | (35) |
| Planned 2012–13 | Actual 2012–13 | Difference 2012–13 |
|---|---|---|
| 8 | 9 | (1) |
Actual spending and FTEs aligned with plans.
| Expected Results | Performance Indicators | Targets | Actual Results |
|---|---|---|---|
| Departments and agencies are keeping the public informed of policies, programs, services and initiatives, and considering the public’s views in their development | Percentage of departments and agencies in compliance with key requirements of the Communications Policy of the Government of Canada and the Federal Identity Program Policy | 80% by December 2013 | 83% |
The Secretariat exceeded performance expectations in the area of communications and corporate identity. The government-wide monitoring of key policy requirements based on organizations’ self-assessment indicates that for 2012–13, 83 per cent of departments and agencies were in compliance with key requirements of the Communications Policy of the Government of Canada and the Federal Identity Program Policy.
Sub-Program 1.1.8 Regulatory Management
Through the Regulatory Management sub-program, the Secretariat supports the Treasury Board as a committee of ministers in considering Governor in Council regulations and orders. Regulation is one of the key instruments to advance the government’s policy agenda and to fulfill statutory responsibilities through a number of Acts to protect the health, safety and security of Canadians, their environment and economy. Regulations must be developed and implemented in a way that reduces burden on business, makes it easier to do business with regulators, and improves service and predictability for all stakeholders. Canada’s regulatory policy is the Cabinet Directive on Regulatory Management.
The Secretariat supports the Treasury Board for the continuum of regulatory development, implementation and monitoring through its three main business lines:
- Challenge function - regulatory proposals are reviewed on a submission-by-submission basis to ensure quality design;
- Policy leadership - guidelines and tools are developed to assist departments in complying with the directive when preparing regulatory submissions, including new requirements related to systemic regulatory reforms; and
- Oversight - ongoing monitoring and reporting of regulatory system performance to support red tape reduction efforts.
| Planned Spending 2012–13 | Actual Spending 2012–13 | Difference 2012–13 |
|---|---|---|
| 7,850 | 5,234 | 2,616 |
| Planned 2012–13 | Actual 2012–13 | Difference 2012–13 |
|---|---|---|
| 62 | 38 | 24 |
Actual spending was lower than planned spending due to the transfer during the year of the Canada-United States Regulatory Cooperation Council from the Secretariat to the Privy Council Office.
| Expected Results | Performance Indicators | Targets | Actual Results |
|---|---|---|---|
| Regulations approved by the Governor in Council address risks and limit new administrative burden on business via application of the reconciliation requirement of the “One-for-One” Rule | Percentage of regulations approved by the Governor in Council that address risks while controlling administrative burden on business through the “One for One” Rule | 90% by March 2015 | 100% as of March 2013 |
The Secretariat exceeded its performance target in 2012–13. In the “One-for-One” Rule’s inaugural year, all departments and agencies offset administrative burden and eliminated regulations in accordance with this rule, while continuing to design regulations that address risk.
Other red tape reduction reforms were also implemented including the Small Business Lens, forward regulatory plans and service standards for high-volume regulatory authorizations.
Program 1.2 People Management
The People Management Program supports activities of the Treasury Board in its role as the employer of the core public administration. The program’s primary objectives are to lead people management and promote leadership excellence, to support human resources infrastructure and to ensure the appropriate degree of consistency in people management across the public service. In certain instances, activities extend beyond the core public administration to separate agencies, members of the Royal Canadian Mounted Police and Canadian Forces, locally engaged staff, students and appropriation-dependent Crown corporations.
To support deputy heads and to provide Parliament and Canadians with a clear view of the overall state of people management, this program enables the development and implementation of direction-setting strategic frameworks and policies for classification, executive management, official languages, and values and ethics; the establishment of people management indicators, measures, oversight and monitoring; and the collection and analysis of reliable and consistent data regarding the public service. This program enables prudent fiscal management of resources in the areas of classification, total compensation (collective bargaining, wages and salaries, terms and conditions of employment, pensions and benefits) and labour relations, and supports departments to implement decisions by the Government of Canada regarding expenditures and programs.
Responsibilities in areas other than classification and labour relations are shared with the Expenditure Management program. The People Management program is underpinned by a number of pieces of legislation, which are identified in the Policy Framework for People Management and the Policy Framework for the Management of Compensation.
| Total Budgetary Expenditures (Main Estimates) 2012–13 |
Planned Spending 2012–13 |
Total Authorities (available for use) 2012–13 |
Actual Spending (authorities used) 2012–13 |
Difference (Planned vs. Actual Spending) |
|---|---|---|---|---|
| 57,710 | 59,431 | 62,253 | 60,975 | (1,544) |
| Planned 2012–13 | Actual 2012–13 | Difference 2012–13 |
|---|---|---|
| 494 | 437 | 57 |
In 2012–13, the difference between Main Estimates and Total Authorities is mainly due to the receipt of funding for the Human Resources Modernization (HRMOD) initiative and funding from the Treasury Board central vote for severance payments and parental leave. The program’s spending is on target for planned spending and actual year-end results.
| Expected Results | Performance Indicators | Targets | Actual Results |
|---|---|---|---|
| Effective people management in the Government of Canada | Percentage of assessed departments and agencies that obtained a MAF rating of at least “Acceptable” for people management | 95% by March 2017 | 100% |
| Percentage of assessed departments and agencies that obtained a MAF rating of at least “Acceptable” for areas of weakness identified in the previous round of assessment of people management | 65% by March 2014 | 68% |
For the first indicator, all of the 40 federal organizations assessed in the 2012–13 MAF process achieved a rating of at least “Acceptable” in the area of people management. There was a significant improvement in the number of employees that met the bilingual language requirement of their positions, with 60 per cent of organizations assessed achieving a rating of “Strong,” compared with 26 per cent in the two previous assessments.
For the second indicator, organizations have improved in setting performance expectations and appraising performance, with a 31-per-cent increase from 2011–12 in the number of organizations achieving a rating of “Acceptable” or “Strong” for workload and workplace planning effectiveness, an area that had previously been identified as weak.
Performance Analysis and Lessons Learned
Through the People Management program, the Secretariat continued to support its priority to enable a modern and sustainable approach to people management by implementing a range of plans set out in its 2012–13 Report on Plans and Priorities. The Secretariat, for example:
Strengthened Workforce Planning and Performance
- Obtained approval to implement the Directive on Performance Management, which will come into effect in April 2014. The directive will provide a standardized approach to the management of employee performance throughout the core public administration. It will better equip organizations and managers to recognize and reward good performance; to work with all employees to improve performance; and to manage unsatisfactory performance.
- Launched a strategic, comprehensive and coherent strategy to manage disability and sick leave across the Government of Canada. Engagement with bargaining agents is underway for a new, streamlined system that ensures active case management and comprehensive support for employees.
Advanced the Modernization of Public Sector Compensation
- In January 2013, announced public sector pension reforms that will save taxpayers $2.6 billion over the next five years and will bring federal public sector pension plans more in line with other public and private sector pension plans.
- Advanced a simplified, integrated and modern approach to public service pensions and benefits to facilitate long-term efficiencies, sustainability and cost containment, with a focus in 2012–13 on aligning the governance structures as well as the design of the various pension, health, dental and disability insurance plans. This included implementing pension reform proposals outlined in Economic Action Plan 2012 and establishing a governance committee to ensure the sound implementation of internal audit recommendations in the area of public service pensions.
- Published comprehensive regulatory policy documents and consulted with stakeholders in February 2013 for the development of regulations under the Public Sector Equitable Compensation Act. Work progressed on the development of an education and awareness plan to support policy implementation.
Enabled Deputy Head Accountability for People Management
-
Continued to support deputy heads in their accountability for effective people management by:
- Implementing the Values and Ethics Code for the Public Sector and the accompanying Policy on Conflict of Interest and Post-Employment;
- Renewing the official languages policy suite; and
- Continuing work to streamline the suite of Treasury Board policies, such as those related to the management of executives.
Sub-Program 1.2.1 Direction Setting
Through the Direction Setting sub-program, the Secretariat ensures that organizations of the core public administration receive high-quality advice, guidance and support for people management and related policy instruments.
Sub-program 1.2.1 includes developing and implementing strategic frameworks; establishing, assessing and monitoring performance expectations; and establishing risk-based policies in areas of employer responsibility. Directions on the management of talent are set for all employees, including executives, and are supported and implemented through corporate talent management and leadership development activities and programs.
This sub-program is supported by research, forecasting and business intelligence to enable evidence-based decision making.
| Planned Spending 2012–13 | Actual Spending 2012–13 | Difference 2012–13 |
|---|---|---|
| 21,205 | 22,701 | (1,496) |
| Planned 2012–13 | Actual 2012–13 | Difference 2012–13 |
|---|---|---|
| 172 | 168 | 4 |
Actual spending and FTEs aligned with plans.
| Expected Results | Performance Indicators | Targets | Actual Results |
|---|---|---|---|
| Federal organizations are equipped with the knowledge and guidance to address people management priorities | Percentage of the people management policy instruments that have been reviewed that comply with established review cycles | 100% by March 2020 | 90% for 2012–13 planned activities |
The performance indicator is a broad, long-term indicator that relates to periodic policy reviews generally done on a five-year cycle. The 2012–13 actual result relates to work done in that year to review the Treasury Board suite of people management policies, resulting in significant streamlining.
In 2012–13, the review of the official languages policy suite was completed, and the revised policy instruments were implemented. In addition, work continued on streamlining the people management policy suite. This streamlining included the development of the Workforce and Workplace Policy and associated directives and standards, which, once approved by Treasury Board, will replace approximately 10 current policy instruments. The new policy will provide high-level guidance that recognizes deputy head authority for people management.
Sub-Program 1.2.2 Enabling Infrastructure
Through the Enabling Infrastructure sub-program, the Secretariat guides and supports deputy heads’ collective responsibility for putting in place efficient and effective people management through common business processes, information systems, best practice tools and sound data.
The objectives of sub-program 1.2.2 are achieved by strengthening the existing governance of human resources management; championing the human resources functional community; and establishing a broad engagement strategy to facilitate a shift in human resources practices, behaviours and relationships, while leveraging Web 2.0 technology. Defining a common way to deliver human resources services throughout the Government of Canada will establish a comprehensive blueprint for deriving data architecture and definitions.
The Secretariat builds on this foundation by maximizing investments made in information technology solutions for modernizing human resources services and programs and by increasing its capacity to define, capture and measure business intelligence, and understand the perceptions and needs of public servants.
| Planned Spending 2012–13 | Actual Spending 2012–13 | Difference 2012–13 |
|---|---|---|
| 20,943 | 21,247 | (304) |
| Planned 2012–13 | Actual 2012–13 | Difference 2012–13 |
|---|---|---|
| 158 | 139 | 19 |
Planned spending includes amounts approved in the Main Estimates along with funding for the Human Resources Modernization (HRMOD) initiative. Financial resources and FTEs were on target at year-end due to funding received during the year (and reflected in total authorities) for paylist requirements such as severance pay and parental benefits.
| Expected Results | Performance Indicators | Targets | Actual Results |
|---|---|---|---|
| Federal organizations are equipped with processes, tools, data or systems to continuously improve their people management practices | Percentage of organizations that have adopted standardized processes, tools, data or systems | 100% by March 2020 | 99% of the core public administration and 95% of separate agencies are working to adopt common processes |
The performance indicator is a broad, long-term indicator that encompasses processes, tools, data and systems. Reporting for 2012–13 is focused on the significant work done in that year to advance the implementation of the Common Human Resources Business Process (CHRBP) standard, a foundational element. Over time, the methodology for reporting on this indicator will include additional elements.
The Secretariat continues to enable departments and agencies to implement standardized human resources process and systems. It is on target to enable 100 per cent of organizations to adopt standardized processes, tools, data or systems by 2020. A key component of this initiative for all federal organizations is the mandatory implementation of the CHRBP by March 31, 2014.
Sub-Program 1.2.3 Comprehensive Management of Compensation
Through the Comprehensive Management of Compensation sub-program, the Secretariat provides advice to the Treasury Board, the Department of Finance Canada, the Privy Council Office and other federal organizations in support of the Treasury Board’s management office, employer and budget office roles.
Comprehensive compensation management encompasses wages and other cash compensation, including pay equity and equitable compensation. It involves establishing and maintaining public service pensions and benefits and other non-monetary forms of compensation, such as terms and conditions of employment and other related workplace policies.
The Secretariat develops plans and strategies related to total compensation through collective bargaining; external, independent advisory committees; and active stakeholder engagement with organizations, bargaining agents and separate agencies, the Canadian Forces and the Royal Canadian Mounted Police. This allows the Government of Canada to appropriately recruit and retain its workforce. To support consistency and results, the Secretariat performs an oversight and performance management function in applying its workforce policies to ensure program delivery standards for all employees, including executives.
| Planned Spending 2012–13 | Actual Spending 2012–13 | Difference 2012–13 |
|---|---|---|
| 17,283 | 17,027 | 256 |
| Planned 2012–13 | Actual 2012–13 | Difference 2012–13 |
|---|---|---|
| 163 | 130 | 33 |
Actual spending and FTEs aligned with plans.
| Expected Results | Performance Indicators | Targets | Actual Results |
|---|---|---|---|
| The comprehensive management of compensation helps the Government of Canada meet its objectives for sustainable recruitment and retention and fulfill its employer obligations | Percentage of Government of Canada objectives met in the areas of recruitment and retention or employer obligations | 100% by March 2020 | 100% for pensions |
The performance indicator is a broad, long-term indicator that includes the areas of pensions, benefits, classification, executive compensation, labour relations and compensation management. The actual result noted for 2012–13 is related to the significant work done in that year related to pension reform.
In other areas, extensive collaboration, stakeholder engagement, training and open communication resulted in consistent application of workforce adjustment, with the least possible impact on employees across the federal public service. The Secretariat continued to provide advice and support for pensions and benefits, classification, executive compensation, labour relations and compensation management. Efforts continued to strengthen, streamline and modernize operations in these areas.
The Public Service Superannuation Act, which governs the public service pension plan, and the Members of Parliament Retiring Allowances Act, which governs the pension plan for members of the House of Commons and the Senate, as well as several other pieces of federal public sector pension legislation, were amended to enact the pension reform proposals contained in Economic Action Plan 2012. Work is ongoing to make consequential amendments to the regulations under these Acts.
Program 1.3 Expenditure Management
The Expenditure Management Program aims to align resources to achieve government priorities in a way that maximizes value for money and provides a whole-of-government perspective on matters related to direct program spending.
Working with appropriated organizations and most Crown corporations, the Secretariat undertakes the review, analysis and challenge of plans and proposals that involve federal spending. This is achieved by developing expenditure forecasting and strategies, management of total compensation and results-based management.
This work, as well as the production of government Estimates documents and reporting to Parliament, forms part of the Expenditure Management System. This system is the framework for developing and implementing the government’s spending plans and priorities within the limits established by the budget in coordination with the Department of Finance Canada and the Privy Council Office.
The primary legislation underpinning program activities is the Financial Administration Act, as well as the appropriation Acts associated with the Estimates.
| Total Budgetary Expenditures (Main Estimates) 2012–13 |
Planned Spending 2012–13 |
Total Authorities (available for use) 2012–13 |
Actual Spending (authorities used) 2012–13 |
Difference (Planned vs. Actual Spending) |
|---|---|---|---|---|
| 35,295 | 35,295 | 33,879 | 31,047 | 4,248 |
| Planned 2012–13 | Actual 2012–13 | Difference 2012–13 |
|---|---|---|
| 270 | 242 | 28 |
This program incurred a surplus at year-end due to the deferral of staffing.
| Expected Results | Performance Indicators | Targets | Actual Results |
|---|---|---|---|
| Government expenditures facilitate the achievement of government priorities in a prudent, effective and accountable manner | Percentage of departments and agencies that obtained a MAF rating of at least an “Acceptable” for managing for results | 80% annually | 74% |
| Percentage of large departments and agencies that obtained a MAF rating of at least “Acceptable” for quality and use of evaluation | 75% by March 2013 | 94% | |
| Percentage of organizations whose year-end expenditures are within the targeted range of planned expenditures | 80% of departments are within the targeted range of 15% (annually) | 67% |
For the first indicator, 64 departments participated in the 2013–14 Management, Resources and Results Structures (MRRS) amendment process. Of these departments, 74 per cent obtained an “Acceptable” rating, in that their Program Alignment Architecture (PAA) and Performance Measurement Framework (PMF) were determined to be compliant with the MRRS policy and to support Treasury Board requirements. While this result falls short of the target, it does represent an improvement of 6 per cent from the previous year. The Secretariat continues to work with departments toward improving and strengthening their PAAs and PMFs.
With respect to the second indicator, 94 per cent of large departments and agencies demonstrated an overall rating of “Acceptable” or higher for quality and use of evaluation. As assessed under the 2012–13 MAF process, evaluations were of sound quality and were regularly taken into consideration to inform Treasury Board submissions, Departmental Performance Reports (DPRs) and program improvements.
With respect to the third indicator, in 2012–13, 67 per cent of departments’ actual expenditures by program were within the targeted range of planned expenditures. This result was 13 per cent less than the stated target, which reflects planned reductions from Economic Action Plan 2012, management of expenditures, and program and project delays, among other considerations. Departments are expected to explain significant variances between their planned and actual program spending in their respective 2012–13 DPRs.
Performance Analysis and Lessons Learned
Through the Expenditure Management program, the Secretariat continued to ensure value for money in government spending. To support the government's goal of returning to balanced budgets in the medium term, the Secretariat implemented a range of plans set out in its 2012–13 Report on Plans and Priorities. The Secretariat, for example:
Supported Cost Reduction
- Implemented a government-wide process for semi-annual reporting to ensure timely and effective implementation of Economic Action Plan 2012 spending reductions of $5.2 billion.
- Supported departments and agencies in implementing their cost-reduction plans by providing guidance to organizations experiencing implementation issues associated with Economic Action Plan 2012 savings measures.
- Supported departments in reducing government spending on travel by strengthening the Directive on Travel, Hospitality, Conference and Event Expenditures. This directive now requires increased oversight of all department-related events where total planned costs exceed $25,000.
- Supported the Priorities and Planning Subcommittee on Government Administration in its detailed review of the administrative functions of the Canada Revenue Agency and Fisheries and Oceans Canada, which resulted in savings of $93.6 million announced in Economic Action Plan 2013.
Improved Data Management to Support Decision Making
- Developed the Expenditure Database, which was launched in April 2013 to support parliamentarians, government officials and the public in accessing and navigating existing government financial information.
Improved Reporting to Parliament
-
In response to Report 7 of the Standing Committee on Government Operations and Estimates, the Secretariat increased transparency and accountability in performance reporting by requiring all departments to:
- Report spending information by program for three previous years and three future years;
- Include a financial trend analysis and an explanation of variances; and
- Provide context on the relationship between government expenditures and tax measures through links to external organizations.
- Conducted a two-phased e-reporting pilot initiative to modernize parliamentary reporting and streamline the approach to tabling Estimates documents. This initiative will reduce the reporting burden for departments, maximize the use of technology to improve accessibility and usability of government expenditure information, and increase levels of automation in the production of Estimates documents.
Sub-Program 1.3.1 Results-Based Expenditure Management
Through the Results-Based Expenditure Management sub-program, the Secretariat aims to ensure that program spending focuses on results, provides value for taxpayers’ money and aligns with government priorities.
The Secretariat undertakes outreach activities, provides guidance and assesses performance so that federal organizations are equipped with the knowledge, tools and resources needed to manage for results. The Secretariat also supports reviews of government spending to drive excellence in program performance and services to Canadians, and to ensure value for money.
The Policy on Management, Resources and Results Structures and the Policy on Evaluation underpin this sub-program.
| Planned Spending 2012–13 | Actual Spending 2012–13 | Difference 2012–13 |
|---|---|---|
| 4,826 | 4,926 | (100) |
| Planned 2012–13 | Actual 2012–13 | Difference 2012–13 |
|---|---|---|
| 39 | 44 | (5) |
Actual spending and FTEs aligned with plans.
| Expected Results | Performance Indicators | Targets | Actual Results |
|---|---|---|---|
| Departments and agencies are equipped with the tools and guidance they need to manage for results | Percentage of departments that “mostly” or “strongly” agree the tools or guidance received from results-based management are useful | 80% annually | 78% |
| Percentage of large departments that obtained a MAF rating of at least “Acceptable” for the use of evaluations to support decision making | 75% by March 2013 | 94% |
Based on feedback received from 25 departments, 84 per cent agreed that the tools for facilitating implementation of Management, Resources and Results Structures (e.g., website information, instructions, the approval guide) are useful; 72 per cent agreed that the guidance received from the Secretariat (e.g., training sessions, workshops, one-on-one analyst interaction) is useful. The Secretariat will continue to improve guidance and materials on results-based management for departments.
Under the 2012–13 MAF process, large departments and agencies demonstrated overall acceptable performance against the MAF methodology. The methodology focused on two lines of evidence, namely foundations for quality evaluations and use of evaluation. For use of evaluation, which focused on coverage, use and timely dissemination of evaluation results, 94 per cent of large departments and agencies received an “Acceptable” rating or higher.
Sub-Program 1.3.2 Expenditure Management Advice and Reporting
Through the Expenditure Management Advice and Reporting sub-program, the Secretariat supports sound decision making by providing reliable, detailed and timely information and by reporting on spending and resource allocation.
In support of the Treasury Board’s budget office role in the government-wide expenditure cycle (i.e., expenditure planning, resource allocation and decision making), the Secretariat provides independent analysis and advice to the Treasury Board and exercises a challenge function for expenditure and other proposals from federal organizations.
The Secretariat also develops departmental and whole-of-government views of expenditure management and provides support during the annual budget process, as well as advice on access to the Treasury Board’s central votes and management reserve. The Secretariat leads the process for obtaining parliamentary approval of appropriation Acts by preparing the government’s Main and Supplementary Estimates for tabling in the House of Commons; explaining Estimates requirements to parliamentary committees; and providing ongoing guidance and strategic advice to government departments and agencies in preparing their Reports on Plans and Priorities and Departmental Performance Reports.
This sub-program also includes reporting to Parliament and Canadians more broadly at the whole-of-government level.
| Planned Spending 2012–13 | Actual Spending 2012–13 | Difference 2012–13 |
|---|---|---|
| 22,147 | 19,846 | 2,301 |
| Planned 2012–13 | Actual 2012–13 | Difference 2012–13 |
|---|---|---|
| 168 | 149 | 19 |
Actual spending and FTEs were mostly on target. There was a surplus at year-end due to the deferral of staffing.
| Expected Results | Performance Indicators | Targets | Actual Results |
|---|---|---|---|
| Decision makers have the necessary financial and non-financial information to make departmental and government-wide expenditure management decisions | Percentage of Secretariat officials with direct access to tools that present integrated departmental and government-wide expenditure management information | 80% by March 2014 | Assessment tool under development |
| Percentage of expenditure management reporting targets achieved | 100% by March 2014 | Assessment tool under development |
The Secretariat is currently developing a sound methodology to assess decision makers’ level of access to integrated expenditure information across government. This methodology will be developed in 2013–14.
Sub-Program 1.3.3 Compensation Expenditure Management
Through the Compensation Expenditure Management sub-program, the Secretariat provides advice to the Treasury Board, the Department of Finance Canada, the Privy Council Office and other federal organizations in support of the Treasury Board’s budget office role in managing total compensation expenditures across the federal government. This role includes identifying total compensation and pension and benefit cost pressures.
The Secretariat develops analysis and recommendations for managing compensation, including wages and other cash compensation, pensions and insurance benefits, and paid time off. As part of this sub-program, the Secretariat also provides advice on managing the compensation reserve.
| Planned Spending 2012–13 | Actual Spending 2012–13 | Difference 2012–13 |
|---|---|---|
| 8,322 | 6,275 | 2,047 |
| Planned 2012–13 | Actual 2012–13 | Difference 2012–13 |
|---|---|---|
| 63 | 49 | 14 |
There was a surplus at year-end due to the deferral of staffing.
| Expected Results | Performance Indicators | Targets | Actual Results |
|---|---|---|---|
| The Government of Canada is able to manage compensation expenditures in line with the principles of external comparability, internal relativity, performance and affordability identified in the Policy Framework for the Management of Compensation | Percentage of compensation decisions that are affordable and that align with the external market | 90% by March 2013 | 86% |
Most employees of core public administration groups that have reached settlements are covered by collective agreements in line with pattern economic wage increases (i.e., 1.75 per cent for 2011–12, 1.5 per cent for 2012–13 and 2.0 per cent for 2013–14). Some groups received higher settlements due to specific circumstances (e.g., arbitral awards) or to address recruitment and retention issues, consistent with the compensation policy framework.
As of March 2013, severance for voluntary departures has been eliminated for more than 280,000 federal government employees.
Program 1.4 Financial Management
The Financial Management program provides oversight and direction to federal organizations on improving the stewardship of taxpayers’ dollars and government assets. The program works to strengthen financial management, internal audit, management of real property and materiel, investment planning, project management and procurement across the federal public service.
Program objectives are accomplished by providing direction to departments; demonstrating leadership; developing and maintaining policies, guidance and practices; nurturing sustainable and professional communities (e.g., finance, procurement, audit); and helping improve government operations. The primary legislation issuing program authority is the Financial Administration Act.
| Total Budgetary Expenditures (Main Estimates) 2012–13 |
Planned Spending 2012–13 |
Total Authorities (available for use) 2012–13 |
Actual Spending (authorities used) 2012–13 |
Difference (Planned vs. Actual Spending) |
|---|---|---|---|---|
| 32,912 | 32,912 | 33,962 | 30,867 | 2,045 |
| Planned | Actual | Difference |
|---|---|---|
| 170 | 180 | (10) |
Program spending was less than planned spending and authorities as a result of Economic Action Plan 2012 cost-containment measures and project delays.
| Expected Results | Performance Indicators | Targets | Actual Results |
|---|---|---|---|
| Sound comptrollership in the Government of Canada | Percentage of departments and agencies that obtained a MAF rating of at least “Acceptable” for financial management and control, internal audit, and management of acquired services and assets | 85% for 2013–14 and onward | 84% |
Overall results clearly show that the financial management function contributes to strong stewardship and sound comptrollership in the Government of Canada. While changes to financial policies and government objectives challenge departments to make continuing improvements to their financial management capabilities, the Secretariat is on track to achieve the 2013–14 target.
Performance Analysis and Lessons Learned
Through the Financial Management program, the Secretariat continued to contribute to its priorities to ensure value for money and modernize government by implementing a range of plans set out in its 2012–13 Report on Plans and Priorities. The Secretariat, for example:
Continued Financial Management Renewal
-
Achieved significant progress toward a government-wide approach for financial management:
- Launched a financial management transformation strategy to modernize financial management services and systems and develop a common government-wide systems configuration; and
- Laid the foundation for common financial business processes and services through continued work on guidelines for these business processes and common enterprise data standards.
- Completed the implementation of the suite of Treasury Board financial management policies and advanced the renewal of policies in the areas of procurement and assets management.
Strengthened Internal Audit Capacity
- Developed guidance regarding the use of financial analytical tools and techniques to enable the internal audit functions in departments and agencies to test their internal financial controls and to support cost containment. Held workshops and training sessions for the audit community to provide functional advice on policy implementation.
- Facilitated the purchase of over 450 TeamMate software licences for implementation in departments. This audit management software increases the efficiency of the audit process, including risk assessment, trend analysis, scheduling, planning, reporting and storage.
- Completed nine core control audits and three horizontal audits to address areas of government-wide risk. All horizontal audit reports are available on the Secretariat’s website.
- Economic Action Plan 2012 resulted in the consolidation of the internal audit functions of the five regional development agencies to achieve efficiency gains. By leveraging the Secretariat’s internal audit capacity and expertise, the regional development agencies were able to reduce their staff complement by 25 internal audit positions. To meet the additional workload, the Secretariat audit team was increased by 5 additional positions, resulting in a net cross-government reduction of 20 positions.
Advanced Talent Management
- Supported the development of succession planning for chief financial officers (CFOs) and chief audit executives through the Talent Management Framework, various community development initiatives and the launch of the CFO talent management process.
Sub-Program 1.4.1 Financial Management, Oversight and Reporting
Through the Financial Management, Oversight and Reporting sub-program, the Secretariat seeks to strengthen financial management, oversight of financial performance in departments and agencies, and financial reporting in the Government of Canada. The Secretariat establishes performance expectations for effective financial management and assists departments and agencies in achieving these expectations.
The Secretariat provides advice on the interpretation of financial policy instruments, clarifies the roles and responsibilities of policy stakeholders, monitors compliance with policy instruments and reviews government financial statements to ensure they comply with accounting standards. It also provides enabling functions, community development and capacity building.
These activities are ultimately intended to improve the financial management function across government, as well as the quality and timeliness of the financial information provided to parliamentarians and Canadians on the state of government-wide financial results.
| Planned Spending 2012–13 | Actual Spending 2012–13 | Difference 2012–13 |
|---|---|---|
| 14,885 | 15,803 | (918) |
| Planned 2012–13 | Actual 2012–13 | Difference 2012–13 |
|---|---|---|
| 85 | 94 | (9) |
Actual spending and FTEs aligned with plans.
| Expected Results | Performance Indicators | Targets | Actual Results |
|---|---|---|---|
| Government departments and agencies are equipped to implement and sustain performance in financial management, oversight and reporting | Percentage of departments and agencies that obtained a MAF rating of at least “Acceptable” for financial management and control | 80% by March 2013 | 98% |
Departmental results exceeded targeted expectations, demonstrating that the financial management function is performing well and is generally mature in departments and agencies.
Sub-Program 1.4.2 Internal Audit
Through the Internal Audit sub-program, the Secretariat provides leadership in applying the internal audit function across government and promotes independent audit assurance through internal audit practices. The Secretariat establishes performance expectations for effective internal audit. It assists departments and agencies in achieving these expectations by providing them with advice on the interpretation of the Policy on Internal Audit, clarifying the roles and responsibilities of policy stakeholders and monitoring compliance.
To further strengthen the internal audit function government-wide, the Secretariat promotes professionalism and capacity building in the internal audit community and supports the recruitment, appointment and development of external audit committee members. The Secretariat also leads horizontal audits in large departments and agencies; performs horizontal and core control audits in small departments and agencies; and, since April 2012, provides internal audit services to the regional development agencies.
The Secretariat performs this work to increase and strengthen stewardship, accountability, risk management, governance and internal controls within departments and agencies across the federal government.
| Planned Spending 2012–13 | Actual Spending 2012–13 | Difference 2012–13 |
|---|---|---|
| 10,536 | 7,445 | 3,091 |
| Planned 2012–13 | Actual 2012–13 | Difference 2012–13 |
|---|---|---|
| 45 | 41 | 4 |
Actual spending was less than planned spending due to amounts set aside as a result of Economic Action Plan 2012 cost-containment measures and delays in project implementation.
| Expected Results | Performance Indicators | Targets | Actual Results |
|---|---|---|---|
| Internal audit functions in departments and agencies provide independent assurance to their deputy heads on governance, risk management and control processes | Percentage of departments and agencies that obtained a MAF rating of at least “Acceptable” for capacity to sustain the effective delivery of internal audit services | Maintain 90% by March 2014, 2015 and 2016 | 89% |
| Percentage of departments and agencies that have received a rating of “Generally Conforms” on their practice inspection | 85% by March 2013 | 84% |
In the area of internal audit, the Secretariat has achieved significant progress on meeting its targets. For the first indicator, the capacity of the internal audit function remains stable, with a large majority of departments achieving a rating of at least “Acceptable” for lines of evidence related to the capacity to sustain effective delivery of internal audit services. The Secretariat is on track for meeting the 2013–14 target.
For the second indicator, the revised Policy on Internal Audit (2009) required departments to complete a practice inspection within five years. For those departments that completed the inspection during the reporting period, 84 per cent achieved a result of “Generally Conforms.” The remaining departments are on track for meeting the five-year target.
Sub-Program 1.4.3 Assets and Acquired Services
Through the Assets and Acquired Services sub-program, the Secretariat monitors performance on the management of real property, materiel, procurement, projects and investment planning. The Secretariat provides leadership and oversight to inform decision making by ministers and officials in central agencies and departments. It develops and implements Treasury Board’s policies to support efficient management of public assets and acquired services.
To help departments achieve performance expectations, the Secretariat provides advice on the interpretation of policies and standards, monitors compliance and facilitates capacity development within the relevant functional communities.
| Planned Spending 2012–13 | Actual Spending 2012–13 | Difference 2012–13 |
|---|---|---|
| 7,491 | 7,619 | (128) |
| Planned 2012–13 | Actual 2012–13 | Difference 2012–13 |
|---|---|---|
| 40 | 45 | (5) |
Actual spending and FTEs aligned with plans.
| Expected Results | Performance Indicators | Targets | Actual Results |
|---|---|---|---|
| Departments and agencies have the tools and policies they need to implement and sustain effective acquired services and asset management practices and performance | Percentage of large departments and agencies (LDAs) that have an approved See footnote [3] or an acknowledged See footnote [4] investment plan | 100% annually | LDA 80% |
| Percentage of small departments and agencies (SDAs) that have an approved or an acknowledged investment plan | 100% annually | SDA 60% |
Departments with very little planned spending on assets and acquired services have been slower than larger departments in producing a long-term plan. However, significant progress has been made by departments that completed their investment plans in demonstrating the requisite level of integrated planning, processes, governance and tools.
The Secretariat anticipates increased performance in this area as departments become more familiar with the policy expectations and better integrate their decision making in developing an investment plan. In the current climate of cost containment, more departments are looking to their investment planning processes to identify opportunities to reduce planned spending and take full advantage of all available resources.
The Secretariat will continue to provide targeted policy advice, guidance and other support to departments and the program sector. It will also continue to work collaboratively with departments and support relevant communities of practice as a means to identify, promote and share sound management practices, giving practitioners the opportunity to benefit from the experiences of others facing similar management challenges in this time of fiscal restraint.
Program 1.5 Government-Wide Funds and Public Service Employer Payments
The Government-Wide Funds and Public Service Employer Payments program accounts for funds that are held centrally to supplement other appropriations, from which allocations are made to, or payments and receipts are made on behalf of, other federal organizations. These funds supplement the standard appropriations process and meet certain responsibilities of the Treasury Board as the employer of the core public administration, including employer obligations under the public service pension and benefits plans.
The administration of these funds falls under the Expenditure Management program and the People Management program, but their financial resources are shown separately in the Program Alignment Architecture for visibility and reporting purposes.
| Total Budgetary Expenditures (Main Estimates) 2012–13 |
Planned Spending 2012–13 |
Total Authorities (available for use) 2012–13 |
Actual Spending (authorities used) 2012–13 |
Difference (Planned vs. Actual Spending) |
|---|---|---|---|---|
| 5,430,433 | 5,430,433 | 3,718,185 | 2,500,373 | 2,930,060 |
This program consists of two components, which are explained below.
| Total Budgetary Expenditures (Main Estimates) 2012–13 |
Planned Spending 2012–13 |
Total Authorities (available for use) 2012–13 |
Actual Spending (authorities used) 2012–13 |
Difference (Planned vs. Actual Spending) |
|---|---|---|---|---|
| 3,153,193 | 3,153,193 | 997,942 | 0 | 3,153,193 |
This component of the program pertains to centrally managed funds administered by the Secretariat on behalf of other departments and agencies. Planned spending (equal to Main Estimates) was $3.2 billion.
Each year Parliament approves the funding authorities for these votes within the Secretariat’s reference levels. However, throughout the year, the amounts for these votes are distributed to other departments and agencies. Expenditures appear in their operating votes, and Secretariat authorities are reduced accordingly. Any unused authorities lapse at year-end.
| Total Budgetary Expenditures (Main Estimates) 2012–13 |
Planned Spending 2012–13 |
Total Authorities (available for use) 2012–13 |
Actual Spending (authorities used) 2012–13 |
Difference (Planned vs. Actual Spending) |
|---|---|---|---|---|
| 2,277,240 | 2,277,240 | 2,720,243 | 2,500,373 | (223,133) |
This component of the program pertains to group insurance and benefit programs including statutory payments. Planned spending (equal to Main Estimates) was $2.3 billion.
During the year, authorities were increased by $0.4 billion for a statutory payment related to an actuarial adjustment in virtue of the Public Service Superannuation Act (PSSA). Year-end expenditures were less than total authorities by approximately $220 million. This difference was due to surpluses in the Public Service Health Care Plan attributable to a greater realization of savings from cost-containment measures than originally forecasted, as well as to surpluses in provincial payroll taxes related to lower-than-anticipated financial impacts of workforce adjustments and severance pay liquidation.
| Planned 2012–13 | Actual 2012–13 | Difference 2012–13 |
|---|---|---|
| Not applicable | Not applicable | Not applicable |
| Expected Results | Performance Indicators | Targets | Actual Results |
|---|---|---|---|
| Allocations, payments and receipts managed by the Secretariat are made, as required | Percentage of allocations and payments made as required | 100% annually | 100% of payments and allocations were made |
Internal Services
Program 1.6 Internal Services
Internal services are groups of related activities and resources that are administered to support the needs of programs and other corporate obligations of an organization. These groups include the following services:
- Management and oversight;
- Communications;
- Legal;
- Human resources management;
- Financial management;
- Information management;
- Information technology;
- Real property;
- Materiel;
- Acquisition; and
- Travel and other administrative services.
Internal services include only those activities and resources that apply across an organization and do not include those provided for a specific program.
Federal Sustainable Development Strategy (FSDS)
The Secretariat participates in the Federal Sustainable Development Strategy and contributes to its Greening Government Operations targets through the Internal Services program. The Secretariat contributes to the following target areas of Theme IV, Shrinking the Environmental Footprint – Beginning with Government: electronic waste, managed printing devices, paper consumption, green meetings and green procurement.
For additional details on the Secretariat's activities in this area, please refer to the supplementary information in Greening Government Operations.
| Total Budgetary Expenditures (Main Estimates) 2012–13 |
Planned Spending 2012–13 |
Total Authorities (available for use) 2012–13 |
Actual Spending (authorities used) 2012–13 |
Difference (Planned vs. Actual Spending) |
|---|---|---|---|---|
| 74,946 | 75,564 | 90,075 | 80,221 | (4,657) |
In 2012–13, the difference between Main Estimates and Total Authorities is due to the receipt of funding for the Human Resources Modernization (HRMOD) initiative and cyber security, and to transfers for severance and parental leave. The $9.9 million surplus at year-end (difference between authorities and actual spending) is mostly due to a $7 million frozen allotment for litigation costs and to efficiency gains from information technology projects.
| Planned 2012–13 | Actual 2012–13 | Difference 2012–13 |
|---|---|---|
| 677 | 642 | 35 |
Performance Analysis and Lessons Learned
Through the Internal Services program, the Secretariat continued to pursue greater efficiency and effectiveness in its internal operations by implementing a range of plans set out in its 2012–13 Report on Plans and Priorities. The Secretariat, for example:
Contained Costs and Achieved Savings
- Successfully met its departmental cumulative savings target of $9.7 million outlined in the 2010 Strategic Review results. The Secretariat is on track to achieve the total ongoing savings target of $11.5 million by 2013–14.
- Identified $7.6 million in savings through increased efficiencies to operations in the Secretariat in response to the departmental spending review highlighted in Economic Action Plan 2012.
- Implemented the last year of the three-year freeze on departmental operating budgets announced in Economic Action Plan 2010, which required departments to absorb salary increases within existing budgets.
Improved Operational Effectiveness
- Began implementation of an information management system to replace the legacy system, which will improve corporate information management and facilitate automated correspondence management through an automated workflow management tool.
- Completed the Paperless Pay Campaign to successfully modernize compensation service delivery, leveraging technology for e-access to pay and pension information in lieu of paper options.
- Reduced costs by replacing inefficient printing and copying devices with multi-function devices capable of performance reporting, which resulted in planned savings of $364,000 per year.
- Piloted an initiative to replace approximately 1,700 telephone lines with BlackBerries.
- Used Skype to conduct interviews across Canada and abroad for the 2012–13 University Recruitment Campaign. This innovative approach reduced campaign costs by 97% over the previous year.
- Continued to centrally manage language training for the Secretariat’s employees, resulting in a decrease in annual language training costs to $844,000. This represents a 59-per-cent decrease in annual language training costs since 2009–10.
- Began the implementation of activities identified in the Departmental Evaluation Plan to build performance measurement capacity with the objective of increasing the quality, utility and efficiency of future evaluations within the Secretariat.
Advanced Modernization of the Workplace
- Launched a four-year Workplace Renewal Initiative focused on three interrelated areas: technology renewal, workspace renewal and back office renewal. In 2012–13, the implementation of the Secretariat's long-term accommodation plan involving the adoption of Workplace 2.0 concepts commenced. The Secretariat introduced the “Pathfinder” demonstration workplace, which highlights office designs that are flexible and that maximize the use of space and enabling technology, with the objective of enhancing collaboration, productivity and sustainability, and attracting and retaining employees.
Financial Statements Highlights
The highlights presented in this section are drawn from the Secretariat’s financial statements, which are prepared on an accrual basis. These financial statements have been prepared using Government of Canada accounting policies, which are based on Canadian public sector accounting standards.
The variance between the figures that follow and the figures provided in other sections of this report relate to such items as non-respendable revenues, services without charge received from other government departments, amortization, severance and vacation pay liability adjustments.
The Secretariat's assets consist mainly of accounts receivable from other government departments and agencies, whereas its liabilities are mainly for accounts payable to these organizations, as well as for payables related to the employer's share of public service insurance. Expenses include $2.5 billion for government-wide programs such as the employer's share of the Public Service Health Care Plan, the Public Service Dental Care Plan, and other insurance and pension programs. Revenues of $10.5 million consist mainly of government-wide parking revenues, internal support services and recovery of pension administration costs.
| 2012–13 Planned Results (Restated) See endnote 4* | 2012–13 Actual | 2011–12 Actual (Restated) See endnote 4* | $ Change (2012–13 Actual vs. Planned) | $ Change (2012–13 Actual vs. 2011–12 Actual) | |
|---|---|---|---|---|---|
| * Refer to financial statements for further details. | |||||
| Total expenses | 2,583,283 | 2,786,054 | 2,457,175 | 202,771 | 328,879 |
| Total net revenues | 13,044 | 10,525 | 12,410 | (2,519) | (1,885) |
| Net cost of operations before government funding and transfers | 2,570,239 | 2,775,529 | 2,452,091 | 205,290 | 323,438 |
| Departmental net financial position | (40,746) | (23,759) | (30,463) | 16,987 | 6,704 |
The increase in total actual expenses in 2012–13 of $329 million as compared with 2011–12 actuals and the increase of $203 million over 2012–13 planned results are both mainly due to an increase in payments to fund actuarial deficits in the Public Service Pension Plan. The increase is partially offset by a one-time payment that was made to a disability plan in 2011–12 only and due to reductions attributable to the 2012 Budget's review of departmental spending.
The decrease in total actual revenues of $2.5 million as compared with 2011–12 is mainly due to a decrease in government-wide parking fees. Public Works and Government Services Canada no longer has the responsibility to provide parking at some locations across the country. Employees must make their own arrangements with private sector companies. This change is being implemented on a site-by-site basis, and the parking revenue is expected to decline gradually over the next few years.
| 2012–13 | 2011–12 (Restated) See endnote 5* | $ Change | |
|---|---|---|---|
| * Refer to financial statements for further details. | |||
| Total liabilities | 478,639 | 471,316 | 7,323 |
| Total net financial assets | 446,774 | 425,794 | 20,980 |
| Departmental net debt | 31,865 | 45,522 | (13,657) |
| Total non-financial assets | 8,106 | 15,059 | (6,953) |
| Departmental net financial position | (23,759) | (30,463) | 6,704 |
Total net financial assets increased by $21 million mainly due to an increase in the Due from Consolidated Revenue Fund (CRF) account, which represents the net amount of cash that the Secretariat is entitled to draw from the CRF without further authorities to discharge its liabilities.
Departmental net debt, calculated as the difference between total liabilities and net financial assets, has decreased by $14 million in 2012–13. The change is mainly due to expenses that were accrued in 2011–12 but only funded in 2012–13 when the expenses were paid, thereby reducing the net debt. The departmental net financial position (deficit) has decreased for the same reason, but the decrease was partially offset by a capital asset write-down.
Financial Statements
See the complete Treasury Board of Canada Secretariat Financial Statements (Unaudited) for the Year Ended March 31, 2013, which includes the Statement of Management Responsibility Including Internal Control Over Financial Reporting and its Annex for fiscal year 2012–13, at their designated page on the Secretariat's website.
Treasury Board of Canada Secretariat
Financial Statements (Unaudited)
For the Year Ended March 31, 2013
Statement of Management Responsibility Including Internal Control Over Financial Reporting
Responsibility for the integrity and objectivity of the accompanying financial statements for the year ended March 31, 2013, and all information contained in these statements rests with the management of the Treasury Board of Canada Secretariat (Secretariat). These financial statements have been prepared by management using the government’s accounting policies, which are based on Canadian public sector accounting standards.
Management is responsible for the integrity and objectivity of the information in these financial statements. Some of the information in the financial statements is based on management’s best estimates and judgment, and gives due consideration to materiality. To fulfill its accounting and reporting responsibilities, management maintains a set of accounts that provides a centralized record of the Secretariat’s financial transactions. Financial information submitted in the preparation of the Public Accounts of Canada and included in the Secretariat’s Departmental Performance Report is consistent with these financial statements.
Management is also responsible for maintaining an effective system of internal control over financial reporting designed to provide reasonable assurance that financial information is reliable, that assets are safeguarded and that transactions are properly authorized and recorded in accordance with the Financial Administration Act and other applicable legislation, regulations, authorities and policies.
Management seeks to ensure the objectivity and integrity of data in its financial statements through careful selection, training and development of qualified staff; through organizational arrangements that provide appropriate divisions of responsibility; through communication programs aimed at ensuring that regulations, policies, standards and managerial authorities are understood throughout the Secretariat; and through conducting an annual risk-based assessment of the effectiveness of the system of internal control over financial reporting.
A risk-based assessment for the year ended March 31, 2013, was completed in accordance with the Policy on Internal Control, and the results and action plans are summarized in the annex.
The system of internal control over financial reporting is designed to mitigate risks to a reasonable level based on an ongoing process to assess key risks, to assess effectiveness of associated key controls and to make any necessary adjustments.
The system of internal control is monitored by Internal Audit, which conducts periodic audits and reviews of different areas of the Secretariat’s operations. In addition, the Chief Audit Executive has free access to the Audit Committee, which oversees and provides advice to management on its responsibilities for maintaining adequate control systems and the quality of financial reporting. This committee undertakes a review of the financial statements, including all significant accounting estimates and judgments therein, and advises the Secretariat on any apparent material concerns.
The financial statements of the Secretariat have not been audited.
Yaprak Baltacioğlu
Secretary of the Treasury Board
Ottawa, Canada
September 3, 2013
Christine Walker
Chief Financial Officer
Ottawa, Canada
September 3, 2013
| 2013 | 2012 Restated (Note 13) |
|
|---|---|---|
| (in thousands of dollars) | ||
|
Table Notes: |
||
| Liabilities | ||
| Accounts payable and accrued liabilities (Note 4) | 445,510 | 438,134 |
| Vacation pay and compensatory leave | 7,998 | 8,805 |
| Employee future benefits (Note 5) | 25,131 | 24,377 |
| Total liabilities | 478,639 | 471,316 |
| Financial assets | ||
| Due from Consolidated Revenue Fund | 275,809 | 224,490 |
| Accounts receivable and advances (Note 6) | 171,312 | 206,195 |
| Total gross financial assets | 447,121 | 430,685 |
| Financial assets held on behalf of government | ||
| Accounts receivable and advances (Note 6) | (347) | (4,891) |
| Total financial assets held on behalf of government | (347) | (4,891) |
| Total net financial assets | 446,774 | 425,794 |
| Departmental net debt | 31,865 | 45,522 |
| Non-financial assets | ||
| Prepaid expenses | 36 | 81 |
| Tangible capital assets (Note 7) | 8,070 | 14,978 |
| Total non-financial assets | 8,106 | 15,059 |
| Departmental net financial position | (23,759) | (30,463) |
Yaprak Baltacioğlu
Secretary of the Treasury Board
Ottawa, Canada
September 3, 2013
Christine Walker
Chief Financial Officer
Ottawa, Canada
September 3, 2013
| 2013 Planned Results RestatedSee endnote 6* (Note 2) |
2013 | 2012 Restated (Note 13) |
|
|---|---|---|---|
| (in thousands of dollars) | |||
|
Table Notes:
Return to endnote reference 6 * Planned results were presented in the 2012–13 future-oriented financial statements and included in the 2012–13 Report on Plans and Priorities (RPP), which are based on plans as at April 26, 2012 (see also Note 2a). |
|||
| Expenses | |||
| Government-Wide Funds and Public Service Employer Payments | 2,283,440 | 2,492,654 | 2,126,950 |
| Management Frameworks | 60,514 | 60,325 | 75,528 |
| People Management | 71,688 | 69,763 | 73,851 |
| Expenditure Management | 38,019 | 42,087 | 52,515 |
| Financial Management | 37,712 | 31,349 | 30,463 |
| Internal Services | 91,910 | 89,876 | 97,868 |
| Total expenses | 2,583,283 | 2,786,054 | 2,457,175 |
| Revenues | |||
| Internal support services | 6,209 | 6,674 | 8,016 |
| Parking fees – Government-wide | 6,819 | 4,787 | 7,544 |
| Recovery of pension administration costs | 8,426 | 4,725 | 5,356 |
| Other | 46 | 50 | 68 |
| Gross revenue | 21,500 | 16,236 | 20,984 |
| Revenues earned on behalf of government | (8,456) | (5,711) | (8,574) |
| Total net revenues | 13,044 | 10,525 | 12,410 |
| Net cost from continuing operations | 2,570,239 | 2,775,529 | 2,444,765 |
| Transferred operations (Note 11) | |||
| Expenses | 0 | 0 | 7,717 |
| Revenue | 0 | 0 | 391 |
| Net cost of transferred operations | 0 | 0 | 7,326 |
| Net cost of operations before government funding and transfers | 2,570,239 | 2,775,529 | 2,452,091 |
| Government funding and transfers | |||
| Net cash provided by government | 2,544,691 | 2,707,235 | 2,389,068 |
| Change in due from Consolidated Revenue Fund | 6,033 | 51,319 | 45,106 |
| Services provided without charge by other government departments (Note 10) | 23,779 | 23,658 | 23,801 |
| Transfer of assets and liabilities from (to) other government departments (Note 7 and Note 11) | 0 | 21 | (5,658) |
| Net cost of operations after government funding and transfers | (4,264) | (6,704) | (226) |
| Departmental net financial position – Beginning of year | (45,010) | (30,463) | (30,689) |
| Departmental net financial position – End of year | (40,746) | (23,759) | (30,463) |
| 2013 Planned ResultsSee endnote 7* (Note 2) |
2013 | 2012 Restated (Note 13) |
|
|---|---|---|---|
| (in thousands of dollars) | |||
|
Table Notes: Return to endnote reference 7 * Planned results were presented in the 2012–13 future-oriented financial statements and included in the 2012–13 Report on Plans and Priorities (RPP), which are based on plans as at April 26, 2012 (see also Note 2a). |
|||
| Net cost of operations after government funding and transfers | (4,264) | (6,704) | (226) |
| Change due to tangible capital assets | |||
| Acquisition of tangible capital assets | 95 | 2,411 | 7,952 |
| Amortization of tangible capital assets | (1,459) | (965) | (3,265) |
| Proceeds from disposal of tangible capital assets | (10) | 0 | (23) |
| Loss on write-off of tangible capital assets | 0 | (8,375) | 0 |
| Gain on disposal of tangible capital assets | 10 | 0 | 9 |
| Transfer from (to) other government departments | 0 | 21 | (6,610) |
| Total change due to tangible capital assets | (1,364) | (6,908) | (1,937) |
| Change due to prepaid expenses | (19) | (45) | 23 |
| Net increase (decrease) in departmental net debt | (5,647) | (13,657) | (2,140) |
| Departmental net debt – Beginning of year | 53,684 | 45,522 | 47,662 |
| Departmental net debt – End of year | 48,037 | 31,865 | 45,522 |
| 2013 | 2012 Restated (Note 13) |
|
|---|---|---|
| (in thousands of dollars) | ||
|
Table Notes: |
||
| Operating activities | ||
| Net cost of operations before government funding and transfers | 2,775,529 | 2,452,091 |
| Non-cash items: | ||
| Amortization of tangible capital assets | (965) | (3,265) |
| Gain on disposal of tangible capital assets | 0 | 9 |
| Loss on write-off of tangible capital assets | (8,375) | 0 |
| Services provided without charge by other government departments (Note 10) | (23,658) | (23,801) |
| Variations in Statement of Financial Position: | ||
| Decrease in accounts receivable and advances | (30,339) | (150,116) |
| Increase (decrease) in prepaid expenses | (45) | 23 |
| Decrease (increase) in accounts payable and accrued liabilities | (7,376) | 92,209 |
| Decrease in vacation pay and compensatory leave | 807 | 288 |
| Decrease (increase) in future employee benefits | (754) | 14,653 |
| Transfer of liabilities to other government departments (Note 11) | 0 | (952) |
| Cash used in operating activities | 2,704,824 | 2,381,139 |
| Capital investing activities | ||
| Acquisitions of tangible capital assets | 2,411 | 7,952 |
| Proceeds from disposition of tangible capital assets | 0 | (23) |
| Cash used in capital investing activities | 2,411 | 7,929 |
| Net cash provided by the Government of Canada | 2,707,235 | 2,389,068 |
1. Authority and Objectives
Under the broad authority of sections 5 to 13 of the Financial Administration Act, the Secretariat supports the Treasury Board as a committee of ministers in its role as the general manager and employer of the core public administration. The Secretariat is headed by a Secretary, who reports to the President of the Treasury Board.
The mission of the Secretariat is to ensure that the rigorous stewardship of public resources achieves results for Canadians.
The core business of the Secretariat is currently organized into the following key programs:
a) Government-Wide Funds and Public Service Employer Payments
The Government-Wide Funds and Public Service Employer Payments program accounts for funds that are held centrally to supplement other appropriations, from which allocations are made to, or payments and receipts are made on behalf of, other federal organizations. These funds supplement the standard appropriations process and meet certain responsibilities of the Treasury Board as the employer of the core public administration, including employer obligations under the public service pension and benefits plans.
b) Management Frameworks
In support of Treasury Board’s role as management board, the Secretariat provides the framework for the management of government operations. It does so by developing specific policies, regulations, directives and guidelines that, once approved by the Treasury Board, provide the parameters within which deputy heads manage their departments. The Secretariat also helps build understanding and capacity by reaching out to the different communities within departments and agencies (e.g., finance, human resources) that support deputy heads in implementing Treasury Board policies.
c) People Management
The People Management program supports activities of the Treasury Board in its role as the employer of the core public administration. The program’s primary objectives are to lead people management and promote leadership excellence, to support human resources infrastructure and to ensure the appropriate degree of consistency in people management across the public service. In certain instances, activities extend beyond the core public administration to separate agencies, members of the Royal Canadian Mounted Police and the Canadian Forces, students and appropriation-dependent Crown corporations.
d) Expenditure Management
The Expenditure Management program helps align resources to achieve government priorities in a way that maximizes value for money and provides a whole-of-government perspective on matters related to direct program spending. Working with all federal organizations that are subject to budget appropriation, the Secretariat undertakes the review, analysis and challenge of plans and proposals that involve departmental spending, expenditure forecasting and strategies, expenditure management of total compensation and results-based management.
e) Financial Management
The Financial Management program provides oversight and direction to federal organizations to improve the stewardship of taxpayers’ dollars and government assets.
The program works to strengthen financial management, internal audit, management of real property and materiel, investment planning, project management and procurement across the federal public service. This is accomplished by providing direction to departments; demonstrating leadership; developing and maintaining policies, guidance and practices; nurturing sustainable and professional communities (e.g., finance, procurement, audit); and helping to improve government operations.
f) Internal Services
Internal Services are groups of related activities and resources that are administered to support the needs of programs and other corporate obligations of an organization. These include support functions such as communications, financial and human resources management, real property, information technology, legal and procurement.
Internal Services include only those activities and resources that apply across an organization and do not include those provided for a specific program.
2. Summary of Significant Accounting Policies
These financial statements have been prepared using the government’s accounting policies stated below, which are based on Canadian public sector accounting standards. The presentation and results using the stated accounting policies do not result in any significant differences from Canadian public sector accounting standards.
Significant accounting policies are as follows:
a) Parliamentary authorities
The Secretariat is financed by the Government of Canada through parliamentary authorities. Financial reporting of authorities provided to the Secretariat do not parallel financial reporting according to generally accepted accounting principles since authorities are primarily based on cash flow requirements. Consequently, items recognized in the Statement of Operations and Departmental Net Financial Position and in the Statement of Financial Position are not necessarily the same as those provided through authorities from Parliament.
Note 3 provides a reconciliation between the bases of reporting. The planned results amounts in the Statement of Operations and Departmental Net Financial Position and the Statement of Change in Departmental Net Debt are the amounts reported in the future-oriented financial statements included in the 2012–13 Report on Plans and Priorities. The planned results amounts have been restated to reflect the changes resulting from the implementation of the revised Treasury Board Accounting Standard 1.2 - Departmental and Agency Financial Statements and the revised methodology for calculating the amounts due from the Consolidated Revenue Fund (see also Note 13).
This restatement resulted in an increase of $8,456 thousand in net costs of operations before government funding and transfers and an increase of $368 thousand in the change in due from the Consolidated Revenue Fund. In addition, the planned results amounts have also been reclassified to conform to the current year presentation.
b) Net cash provided by government
The Secretariat operates within the Consolidated Revenue Fund (CRF), which is administered by the Receiver General for Canada. All cash received by the Secretariat is deposited to the CRF, and all cash disbursements made by the Secretariat are paid from the CRF. The net cash provided by government is the difference between all cash receipts and all cash disbursements, including transactions between government departments.
c) Amounts due from/to the Consolidated Revenue Fund (CRF)
Amounts due from or to the Consolidated Revenue Fund (CRF) are the result of timing differences at year-end between when a transaction affects authorities and when it is processed through the CRF. Amounts due from the CRF represent the net amount of cash that the Secretariat is entitled to draw from the CRF without further authorities to discharge its liabilities.
d) Revenues
Revenues are accounted for in the period in which the related transaction or event that gave rise to the revenues occurred.
Revenues that are non-respendable are not available to discharge the Secretariat’s liabilities. While the Secretary is expected to maintain accounting control, he or she has no authority regarding the disposition of non-respendable revenues. As a result, non-respendable revenues are considered to be earned on behalf of the Government of Canada and are therefore presented as a reduction of the entity’s gross revenues.
e) Expenses
Expenses are recorded on an accrual basis:
- Transfer payments are recorded as expenses when authorization for the payment exists and the recipient has met the eligibility criteria or the entitlements established for the transfer payment program. Transfer payments that become repayable as a result of conditions specified in the contribution agreement that have come into being are recorded as a reduction to transfer payment expenses and as a receivable.
- Vacation pay and compensatory leave are accrued as the benefits are earned by employees under their respective terms of employment.
- Services provided without charge by other government departments for accommodation and legal services are recorded as operating expenses at their estimated cost.
f) Government-wide employee benefits
(i) Pension and other employee benefits
Eligible public service employees participate in the Public Service Pension Plan, a defined benefit pension plan sponsored by the Government of Canada. In support of the Treasury Board’s role as employer for the public service, the Secretariat funds employer contributions to the pension plan for all departments and agencies, including additional contributions in respect of any actuarial deficits, via statutory authorities.
Starting with the plan year 2012–13, and based on the March 31, 2011, triennial actuarial valuation of the public service pension plan tabled in Parliament on June 21, 2012, an annual adjustment of $435 million will be made to the Pension Fund for a period of 13 years ending in 2025. This amount, along with an annual adjustment of $8 million for Retirement Compensation Arrangement Account No. 2, comprises the $443 million that has been expensed in the Secretariat’s financial statements (refer to Note 12b).
Employer contributions to the Public Service Pension Plan are expensed in the year incurred, and the Secretariat recovers a portion of the employer contributions from other departments and agencies.
Eligible employees of the Secretariat also participate in the Public Service Pension Plan. The Secretariat’s financial reporting responsibility in respect of its own employees’ participation in the pension plan is limited to its employer contributions.
The Government of Canada also sponsors a variety of other employee benefit plans that the Secretariat is responsible for administering and/or funding through its centrally managed funds. Benefit payments for these plans are recognized as expenses in the Secretariat’s financial statements when they become due, and no accruals are recorded for future benefits. A portion of these benefits is also recovered from other departments and agencies. This accounting treatment corresponds to the funding provided to the Secretariat through parliamentary appropriations.
For all pension and other employee future benefits, the actuarial liabilities and related disclosures as well as actuarial surpluses or deficiencies for the whole of government are recognized in the financial statements of the Government of Canada. It is the government that ultimately bears actuarial and investment risks inherent to these defined benefit plans as the plans’ sponsor.
(ii) Severance benefits
Certain employee groups are entitled to severance benefits under labour contracts or conditions of employment. These benefits are accrued as employees render the services necessary to earn them. The obligation relating to the benefits earned by employees is calculated using information derived from the results of the actuarially determined liability for employee severance benefits for the Government of Canada as a whole.
As a result of collective agreement negotiations with certain employee groups and changes to conditions of employment for executives and certain non-represented employees, the accumulation of severance benefits under the employee severance pay program ceased for these employees, commencing in 2012. Employees subject to these changes have been given the option to be immediately paid the full or partial value of benefits earned to date or to collect the full or remaining value of benefits on termination from the public service. As a result, the obligation related to these employee groups has ceased to accumulate.
g) Accounts receivable and advances
Accounts receivable and advances are stated at the lower of cost or net recoverable value. A valuation allowance would be recorded for receivables where recovery is considered uncertain.
h) Contingent liabilities
Contingent liabilities are potential liabilities that may become actual liabilities when one or more future events occur or fail to occur. To the extent that the future event is likely to occur or fail to occur and a reasonable estimate of the loss can be made, an estimated liability is accrued, and an expense is recorded. If the likelihood is not determinable or an amount cannot be reasonably estimated, the contingency is disclosed in the notes to the financial statements.
i) Tangible capital assets
All tangible capital assets and leasehold improvements having an initial cost of $10,000 or more are recorded at their acquisition cost. The Secretariat does not capitalize intangibles, works of art and historical treasures that have cultural, aesthetic or historical value.
Amortization of tangible capital assets is done on a straight-line basis over the estimated useful life of the asset as follows:
| Asset class | Amortization period |
|---|---|
| Computer hardware | 3 years |
| Computer software | 3 to 10 years |
| Machinery and equipment | 3 to 10 years |
| Motor vehicles | 3 years |
| Assets under construction | Once in service in accordance with asset type |
| Leasehold improvements | Lesser of the remaining term of the lease or useful life of the improvement |
Assets under construction are recorded in the applicable capital asset class in the year that they become available for use and are not amortized until they become available for use.
j) Measurement uncertainty
The preparation of these financial statements requires management to make estimates and assumptions that affect the reported amounts of the assets, liabilities, revenues and expenses in the financial statements. At the time of the preparation of these statements, management believes the estimates and assumptions to be reasonable. The most significant items where estimates are used are contingent liabilities, the liability for employee future benefits and the useful life of tangible capital assets. Actual results could significantly differ from the estimated results. Management’s estimates are reviewed periodically and, as adjustments become necessary, they are recorded in the financial statements in the year they become known.
3. Parliamentary Authorities
The Secretariat receives most of its funding through expenditure authorities provided by Parliament. Items recognized in the Statement of Operations and Departmental Net Financial Position and the Statement of Financial Position one year may be funded through the parliamentary authorities of prior, current or future years. Accordingly, the Secretariat has different net results of operations for the year on a government funding basis than on an accrual accounting basis. The differences are reconciled in the following tables:
a) Reconciliation of net cost of operations to current year authorities used
| 2013 | 2012 Restated (Note 13) |
|
|---|---|---|
| (in thousands of dollars) | ||
| Net cost of operations before government funding and transfers | 2,775,529 | 2,452,091 |
| Adjustments for items affecting net cost of operations but not affecting authorities: | ||
| Amortization of tangible capital assets | (965) | (3,265) |
| Gain on disposal of tangible capital assets | 0 | 9 |
| Loss on write-off of tangible capital assets | (8,375) | 0 |
| Services provided without charge by other government departments | (23,658) | (23,801) |
| Decrease in vacation pay and compensatory leave | 807 | 74 |
| Decrease (increase) in employee future benefits | (284) | 13,915 |
| Refund of prior years' expenditures | 12,698 | 62,742 |
| Decrease (increase) in accrued liabilities related to workforce adjustment costs | 8,095 | (8,095) |
| Other | (5,079) | 2,857 |
| Subtotal | (16,761) | 44,436 |
| Adjustments for items not affecting net cost of operations but affecting authorities: | ||
| Acquisitions of tangible capital assets | 2,411 | 7,952 |
| Proceeds from disposal of tangible capital assets | 0 | (23) |
| Increase Advances | 847 | 52 |
| Subtotal | 3,258 | 7,981 |
| Current year authorities used | 2,762,026 | 2,504,508 |
b) Authorities provided and used
| 2013 | 2012 | |
|---|---|---|
| (in thousands of dollars) | ||
| Authorities provided | ||
| Vote 1 — Program expenditures | 255,132 | 299,631 |
| Vote 5 — Government contingencies | 750,000 | 750,000 |
| Vote 10 — Government-wide initiatives | 2,093 | 8,511 |
| Vote 20 — Public service insurance | 2,277,220 | 2,380,408 |
| Vote 25 — Operating budget carry-forward | 0 | 8,061 |
| Vote 30 — Pay list Requirements | 26,193 | 361,781 |
| Vote 33 — Capital budget carry-forward | 219,656 | 241,899 |
| Subtotal | 3,530,294 | 4,050,291 |
| Statutory authorities: | ||
| Contributions to employee benefit plans | 29,698 | 32,071 |
| Unallocated employer contributions made under the Public Service Superannuation Act and other retirement Acts, and the Employment Insurance Act | 443,000 | 6,200 |
| Payments for the pay equity settlement pursuant to section 30 of the Crown Liability and Proceedings Act | 22 | 72 |
| President of the Treasury Board and Minister for the Federal Economic Development Initiative for Northern Ontario – Salary and car allowance | 78 | 78 |
| Payments under the Public Service Pension Adjustment Act | 1 | 2 |
| Spending of proceeds from the disposal of surplus Crown assets | 1 | 24 |
| Subtotal | 472,800 | 38,447 |
| Less: | ||
| Lapsed or transferred authorities: | ||
| Vote 1 — Program expenditures | (23,255) | (20,141) |
| Vote 5 — Government contingencies | (750,000) | (750,000) |
| Vote 10 — Government-wide initiatives | (2,093) | (8,511) |
| Vote 20 — Public service insurance | (219,870) | (193,813) |
| Vote 25 — Operating budget carry-forward | 0 | (8,061) |
| Vote 30 — Pay list Requirements | (26,193) | (361,781) |
| Vote 33 — Capital budget carry-forward | (219,656) | (241,899) |
| Spending of proceeds from the disposal of surplus Crown assets | (1) | (24) |
| Subtotal | (1,241,068) | (1,584,230) |
| Current year authorities used | 2,762,026 | 2,504,508 |
4. Accounts Payable and Accrued Liabilities
The following table presents the details of the Secretariat accounts payable and accrued liabilities:
| 2013 | 2012 | |
|---|---|---|
| (in thousands of dollars) | ||
| Accounts payable to other government departments and agencies | 307,476 | 289,031 |
| Accounts payable to external parties | 13,636 | 11,301 |
| Subtotal | 321,112 | 300,332 |
| Accrued liabilities | 124,398 | 137,802 |
| Total accounts payable and accrued liabilities | 445,510 | 438,134 |
5. Employee Future Benefits
a) Pension benefits
The Secretariat’s employees participate in the Public Service Pension Plan, which is sponsored and administered by the Government of Canada. Pension benefits accrue up to a maximum period of 35 years at a rate of 2 per cent per year of pensionable service times the average of the best five consecutive years of earnings. The benefits are integrated with Canada/Québec Pension Plan benefits and are indexed to inflation.
Employees and the Secretariat both contribute to the cost of the pension plan. The 2012–13 employer expense amounts to $21,205 thousand ($23,059 thousand in 2011–12) in respect of its own employees, which represents approximately 1.7 times (1.8 times in 2011–12) the contributions of employees.
For all pension and other employee future benefits, the actuarial liabilities and related disclosures as well as actuarial surpluses or deficiencies for the whole of government are recognized in the financial statements of the Government of Canada. It is the government that ultimately bears actuarial and investment risks inherent to these defined benefit plans as the plans’ sponsor.
b) Severance benefits
The Secretariat provides severance benefits to certain employee groups based on eligibility, years of service and final salary. These severance benefits are not pre-funded. Benefits will be paid from future authorities. Information about the severance benefits, measured as at March 31, is as follows (see also Note 2f (ii)):
| 2013 | 2012 | |
|---|---|---|
| (in thousands of dollars) | ||
| Accrued benefit obligation - Beginning of year | 24,377 | 39,030 |
| Transferred to other government departments, effective November 15, 2011 (Note 11) | 0 | (738) |
| Subtotal | 24,377 | 38,292 |
| Expense for the year | 8,038 | 5,005 |
| Benefits paid during the year | (7,284) | (18,920) |
| Accrued benefit obligation - End of year | 25,131 | 24,377 |
6. Accounts Receivable and Advances
The following table presents details of the Secretariat accounts receivable and advance balances:
| 2013 | 2012 | |
|---|---|---|
| (in thousands of dollars) | ||
| Receivables - Other government departments and agencies | 169,301 | 200,200 |
| Receivables - External parties | 1,994 | 5,920 |
| Advances to employees | 17 | 71 |
| Deposits in transit to the Receiver General | 0 | 4 |
| Gross accounts receivable and advances | 171,312 | 206,195 |
| Accounts receivable held on behalf of government | (347) | (4,891) |
| Net accounts receivable and advances | 170,965 | 201,304 |
The bulk of receivables from other government departments and agencies are related to receivables established at year-end as a result of employee benefit plans.
7. Tangible Capital Assets
The following table presents the details of tangible capital assets:
| Capital asset class | Cost | Accumulated Amortization | Net Book Value | |||||||||
|---|---|---|---|---|---|---|---|---|---|---|---|---|
| Opening balance restated (Note 13) |
Acquisi-tions | Adjust-ments | Disposals and write-offs | Closing balance | Opening balance restated (Note 13) |
Amorti-zation | Adjust-ments | Disposals and write-offs | Closing balance | 2013 | 2012 Restated (Note 13) |
|
| (in thousands of dollars) | ||||||||||||
| Assets under construction | 3,092 | 1,707 | (4,139) | 0 | 660 | 0 | 0 | 0 | 0 | 0 | 660 | 3,092 |
| Machinery and equipment | 630 | 239 | 0 | 0 | 869 | 77 | 64 | 0 | 0 | 141 | 728 | 553 |
| Motor vehicles | 120 | 0 | 2 | 0 | 122 | 94 | 27 | (19) | 0 | 102 | 20 | 26 |
| Leasehold improvements | 1,952 | 0 | 0 | 0 | 1,952 | 1,952 | 0 | 0 | 0 | 1,952 | 0 | 0 |
| Computer hardware | 10 | 0 | 0 | 0 | 10 | 10 | 0 | 0 | 0 | 10 | 0 | 0 |
| Computer software | 17,276 | 465 | 4,139 | (14,086) | 7,794 | 5,969 | 874 | 0 | (5,711) | 1,132 | 6,662 | 11,307 |
| Total | 23,080 | 2,411 | 2 | (14,086) | 11,407 | 8,102 | 965 | (19) | (5,711) | 3,337 | 8,070 | 14,978 |
Adjustments made to the class “assets under construction” represent assets that were put into use during the year and that have been transferred to the class “computer software.” One vehicle was transferred in from Transport Canada with a net book value of $21,000. Another vehicle was transferred out to Public Works and Government Services Canada with a zero net book value.
There was a disposal and write-off of the Budget Office Systems Renewal (BOSR) software for a net amount of $8.3 million (historical cost of $14 million and accumulated amortization of $5.7 million). BOSR was replaced by the Expenditure Management Component (EMC) software in May of 2012.
8. Contractual Obligations
The nature of the Secretariat’s activities can result in some large multi-year contracts and obligations whereby the Secretariat will be obligated to make future payments when the services or goods are received. Significant contractual obligations that can be reasonably estimated are summarized in the following table:
| 2014 | 2015 | 2016 | 2017 | Total | |
|---|---|---|---|---|---|
| (in thousands of dollars) | |||||
| Public service health and dental care plans | 34,940 | 32,097 | 34,831 | 20,899 | 122,767 |
| Other professional services | 4,480 | 0 | 0 | 0 | 4,480 |
| Management consulting | 2,377 | 0 | 0 | 0 | 2,377 |
| Computer services | 3,076 | 0 | 0 | 0 | 3,076 |
| Translation services | 2,100 | 0 | 0 | 0 | 2,100 |
| Rentals and leases | 635 | 616 | 621 | 803 | 2,675 |
| Total | 47,608 | 32,713 | 35,452 | 21,702 | 137,475 |
Other professional services are mainly comprised of accounting and audit services, mail services and information technologies services.
9. Contingent Liabilities
Claims and litigations
Claims have been made against the Secretariat in the normal course of operations. These claims include items with pleading amounts and others for which no amount is specified. Claims for which the outcome is not determinable and a reasonable estimate can be made by management amount to approximately $295 million ($65 billion in 2011–12) as at March 31, 2013. Some of these potential liabilities may become actual liabilities when one or more future events occur or fail to occur. To the extent that the future event is likely to occur or fail to occur and that a reasonable estimate of the loss can be made, an estimated liability is accrued, and an expense is recorded in the financial statements. No accrual for these contingent liabilities has been made in these financial statements.
In late 1999, the major public service unions and pensioner associations launched three lawsuits against the Crown challenging the validity of the legislation granting authority to the President of the Treasury Board to debit the pension surplus from three superannuation accounts. Lower courts dismissed these lawsuits and, in December 2012, the Supreme Court of Canada dismissed the final appeal. In the 2011-12 year-end financial statements, the estimated contingent liability included an amount for these lawsuits for $65 billion. The 2012-13 contingent liability estimate does not include this amount, as the case is now closed.
In addition to the claims identified above, an action was commenced in the Federal Court of Canada on June 6, 2008, challenging the reduction of former RCMP members’ long-term disability payments under their RCMP insurance policy by the amount of their Pension Act disability benefit. This case is similar to a class action lawsuit between disabled Canadian Forces veterans and the Government of Canada. In May 2012, the Federal Court of Canada ruled that the insurance policy for Canadian Forces’ members does not permit the reduction. The parties are attempting to reach a negotiated settlement, and no accrual for this contingent liability has been made in these financial statements.
10. Related-Party Transactions
The Secretariat is related, as a result of common ownership, to all Government of Canada departments, agencies and Crown corporations. The Secretariat enters into transactions with these entities in the normal course of business and on normal trade terms. In addition, the Secretariat has the responsibility to administer and fund on behalf of other government departments the employer’s contribution to the health, dental and other employee insurance plans and payroll benefits through its centrally managed funds (refer to 10b below). During the year, the Secretariat received and provided common services as disclosed in the next section.
Common services provided without charge by other government departments
During the year, the Secretariat received services without charge from certain common service organizations that were related to accommodation and legal services. These services provided without charge have been recorded in the department’s Statement of Operations and Departmental Net Financial Position as follows:
| 2013 | 2012 | |
|---|---|---|
| (in thousands of dollars) | ||
| Accommodation | 19,905 | 20,294 |
| Legal services | 3,753 | 3,507 |
| Total | 23,658 | 23,801 |
In order to achieve efficiency and cost-effectiveness and to deliver programs economically to the public, the government has centralized some of its administrative activities. As a result, the government uses central agencies and common service organizations so that one department performs services for all other departments and agencies without charge. The cost of these services, such as the payroll and cheque issuance services provided by Public Works and Government Services Canada and the email, network and data centre services provided by Shared Services Canada, are not included in the Secretariat’s Statement of Operations and Departmental Net Financial Position.
b) Common services provided without charge to other government departments
The Secretariat provided services without charge to other government departments for the provision of the employer’s contribution to health, dental and other employee insurance plans and payroll benefits in the amount of $1,741,172 thousand in 2012–13 (compared with $1,690,387 thousand in 2011–12).
c) Other transactions with related parties
| 2013 | 2012 | |
|---|---|---|
| (in thousands of dollars) | ||
| Expenses – Other government departments and agencies | 23,263 | 24,808 |
| Revenues – Other government departments and agencies | 11,407 | 13,372 |
Expenses and revenues disclosed in (c) exclude common services provided without charge, which have already been disclosed in (a) and (b). The expenses are related to a variety of both goods and services and salary transactions with other departments and agencies. The revenues are mainly related to internal support services and the recovery of public service pension administration costs.
11. Transfers From (to) Other Government Departments
Effective November 15, 2011, the Secretariat transferred the control and supervision of the portion of its administration costs and functions related to email, network and data centre services to Shared Services Canada in accordance with order-in-council OIC-2011-1297, including stewardship responsibility of the assets related to these functions.
Effective October 1, 2011, the Secretariat transferred computer hardware and machinery and equipment to the Department of Finance Canada.
Effective January 1, 2012, the management of pension, insurance and social security programs for locally engaged staff was transferred from the Secretariat to Foreign Affairs and International Trade Canada See endnote 8 [1] and to National Defence. The transfer of these programs is the result of the 2008 Human Resources Agencies Horizontal Strategic Review including Public Service Employer Payments.
The impact of transfers from (to) other government departments in the financial statements is as follows:
| 2013 | 2012 | |
|---|---|---|
| (in thousands of dollars) | ||
| Assets | ||
| Tangible capital assets transfer (from) to other government departments | ||
| To Shared Services Canada (net book value) (Note 7) | 0 | 6,222 |
| To the Department of Finance Canada | 0 | 409 |
| From Industry Canada | 0 | (21) |
| From Transport Canada | (21) | 0 |
| Total assets transferred (from) to other government departments | (21) | 6,610 |
| Liabilities | ||
| Vacation pay and compensatory leave transferred to Shared Services Canada | 0 | 214 |
| Employee future benefits transferred to Shared Services Canada | 0 | 738 |
| Total liabilities transferred to Shared Services Canada | 0 | 952 |
| Adjustment to the departmental net financial position | (21) | 5,658 |
12. Segmented Information
a) Main programs
Presentation by segment is based on the Secretariat’s program alignment architecture. This presentation is based on the same accounting policies described in the summary of significant accounting policies in Note 2. The following table presents the expenses incurred and revenues generated for the main programs, by major categories of expenses and revenues.
| GF & PSEP |
MF | PM | EM | FM | IS | 2013 total | 2012 total Restated (Note 13) |
|
|---|---|---|---|---|---|---|---|---|
| (in thousands of dollars) | ||||||||
Legend:
|
||||||||
| Transfer payment | ||||||||
| Industry | 0 | 65 | 0 | 0 | 200 | 0 | 265 | 452 |
| Total transfer payment | 0 | 65 | 0 | 0 | 200 | 0 | 265 | 452 |
| Operating expenses | ||||||||
| Government-wide funds and public service employer payments | 2,492,654 | 0 | 0 | 0 | 0 | 0 | 2,492,654 | 2,126,950 |
| Salary and employee benefits | 0 | 44,019 | 47,660 | 28,457 | 22,437 | 58,142 | 200,715 | 229,513 |
| Professional and special services | 0 | 10,937 | 11,486 | 1,940 | 5,935 | 17,323 | 47,621 | 62,524 |
| Accommodation | 0 | 3,981 | 4,578 | 2,588 | 1,991 | 6,768 | 19,906 | 20,294 |
| Transport and telecommunications | 0 | 492 | 798 | 82 | 404 | 751 | 2,527 | 2,851 |
| Machinery, equipment, parts and tools | 0 | 221 | 141 | 56 | 96 | 3,388 | 3,902 | 4,844 |
| Repair and maintenance | 0 | 8 | 9 | 0 | 4 | 1,214 | 1,235 | 1,333 |
| Utilities, materiel and supplies | 0 | 116 | 275 | 56 | 70 | 339 | 856 | 1,280 |
| Information | 0 | 22 | 54 | 38 | 37 | 231 | 382 | 599 |
| Rentals | 0 | 346 | 267 | 38 | 85 | 1,554 | 2,290 | 945 |
| Amortization | 0 | 0 | 363 | 440 | 80 | 82 | 965 | 1,922 |
| Other subsidies and expenses | 0 | 118 | 4,132 | 8,392 | 10 | 84 | 12,736 | 3,668 |
| Total operating expenses | 2,492,654 | 60,260 | 69,763 | 42,087 | 31,149 | 89,876 | 2,785,789 | 2,456,723 |
| Total expenses | 2,492,654 | 60,325 | 69,763 | 42,087 | 31,349 | 89,876 | 2,786,054 | 2,457,175 |
| Revenues | ||||||||
| Internal support services | 0 | 0 | 0 | 0 | 0 | 6,674 | 6,674 | 8,016 |
| Parking fees and other revenues | 4,832 | 0 | 877 | 0 | 0 | 5 | 5,714 | 7,612 |
| Recovery of pension administration costs | 0 | 0 | 3,848 | 0 | 0 | 0 | 3,848 | 5,356 |
| Revenues earned on behalf of government | (4,832) | 0 | (877) | 0 | 0 | (2) | (5,711) | (8,574) |
| Total revenues | 0 | 0 | 3,848 | 0 | 0 | 6,677 | 10,525 | 12,410 |
| Net cost from continuing operations | 2,492,654 | 60,325 | 65,915 | 42,087 | 31,349 | 83,199 | 2,775,529 | 2,444,765 |
b) Government-wide funds and public service employer payments
The Government of Canada sponsors defined benefit pension plans covering most of its employees. The Secretariat also funds payments to, or in respect of, the following:
- Employer’s share of contributions to the Public Service Death Benefit Account;
- Employer’s share of Canada/Québec Pension Plan contributions and Employment Insurance premiums;
- Employer’s share of health, disability, and life insurance premiums and related Québec sales tax;
- Employer’s share of the Québec Parental Insurance Plan premium;
- Claims and related costs under the Public Service Dental Care Plan and the Pensioners’ Dental Services Plan;
- Provincial payroll taxes in respect of employees who work in the provinces of Quebec, Ontario, Manitoba and Newfoundland and Labrador. The payroll tax is levied on employers in each province to help fund their respective health plans; and
- Returns to certain employees of their share of the Employment Insurance premium reduction.
Generally, Public Service Pension Plan contributions, Public Service Death Benefit Account contributions, Canada/Québec Pension Plan contributions and Employment Insurance premiums are recovered from all departments, agencies and revolving funds based on salaries and wages incurred. Contributions to health care plans are recovered from certain departments, agencies and all revolving funds based on a percentage of salaries and wages incurred.
The following table presents a breakdown by major category.
| 2013 | 2012 | |
|---|---|---|
| (in thousands of dollars) | ||
| Public Service Pension Plan and Retirement Compensation Arrangement contributions (statutory) | 2,608,360 | 2,682,048 |
| Public Service Health Care Plan premiums (Vote 20) | 965,314 | 906,252 |
| Canada/Québec Pension Plan contributions (statutory) | 670,212 | 659,944 |
| Provincial payroll taxes (Vote 20) | 521,468 | 535,107 |
| Group disability and life insurance premiums (Vote 20) | 507,371 | 610,817 |
| Employment Insurance premiums (statutory) | 299,992 | 285,759 |
| Public Service Dental Care Plan claims (Vote 20) | 268,845 | 279,270 |
| Pensioners' Dental Services Plan claims (Vote 20) | 142,796 | 136,980 |
| Pension and other government employee benefits in respect of locally engaged staff employed in Canadian missions abroad (Vote 20) | 0 | 106 |
| Provincial health insurance plan premiums (Vote 20) | 35,187 | 33,576 |
| Québec Parental Insurance Plan premiums (Vote 20) | 35,801 | 35,484 |
| Public Service Death Benefit Account contributions (statutory) | 12,669 | 12,753 |
| Public Service Pension Plan and Retirement Compensation Arrangement contributions in respect of actuarial deficits (statutory) (see also Note 2.f.(i)) | 443,000 | 6,200 |
| Operating expenses (Vote 20) | 1,013 | 3,375 |
| Pension and similar payments to former government employees (Vote 20) | 3,893 | 3,684 |
| Employment Insurance premium reduction (Vote 20) | 2,105 | 2,092 |
| Miscellaneous special payments (statutory) | 22 | 72 |
| Total expenses | 6,518,048 | 6,193,519 |
| Recoveries | ||
| Employer's contributions to government employee benefit plans recovered from government departments and agencies (statutory) | 3,591,233 | 3,640,503 |
| Employer's contributions to government employee insurance plans recovered from government departments and agencies and other organizations (Vote 20) | 184,418 | 184,421 |
| Employee's contributions to the Public Service Health Care Plan recovered from government departments and other organizations (Vote 20) | 176,067 | 171,806 |
| Pensioners' contributions to the Pensioners' Dental Services Plan (Vote 20) | 73,676 | 69,733 |
| Total recoveries | 4,025,394 | 4,066,463 |
| Net expenses before reclassified activities | 2,492,654 | 2,127,056 |
| Less: reclassified activities (Note 11) | 0 | 106 |
| Net expenses after reclassified activities | 2,492,654 | 2,126,950 |
13. Accounting Changes
- During 2012–13, the Secretariat conducted a review of its tangible capital assets and determined that there were tangible capital assets from prior years that had not been recorded. These tangible capital assets consisted mainly of in-house developed software and pooled purchases of furniture and desktop software. Consequently, the financial statements for the year ended March 31, 2012, have been restated. The effect of the restatement is shown in the table below; and
- For the year ended March 31, 2011, the Secretariat adopted the revised Treasury Board Accounting Standard 1.2 – Departmental and Agency Financial Statements, which required the recording of amounts due from the Consolidated Revenue Fund as an asset on the Statement of Financial Position. In 2012–13, the Secretariat reviewed the calculation of this account and determined that certain changes to the methodology are required. The financial statements for the year ended March 31, 2012, have been restated, and the impact is shown in the table below.
| As Previously Stated 2011–12 |
Effect of the Adjustments | Revised Amounts 2011–12 |
||
|---|---|---|---|---|
| Note 13a) | Note 13b) | |||
| (in thousands of dollars) | ||||
| Statement of Financial Position | ||||
| Due from Consolidated Revenue Fund | 128,899 | 0 | 95,591 | 224,490 |
| Departmental net debt | 141,113 | 0 | (95,591) | 45,522 |
| Tangible capital assets | 8,745 | 6,233 | 0 | 14,978 |
| Departmental net financial position | (132,287) | 6,233 | 95,591 | (30,463) |
| Statement of Operations and Departmental Net Financial Position | ||||
| Total expenses | 2,461,735 | (4,560) | 0 | 2,457,175 |
| Net cost from continuing operations | 2,449,325 | (4,560) | 0 | 2,444,765 |
| Net cost of operations before government funding and transfers | 2,456,651 | (4,560) | 0 | 2,452,091 |
| Change in due from Consolidated Revenue Fund | 84 | 0 | 45,022 | 45,106 |
| Departmental net financial position – Beginning of year | (82,931) | 1,673 | 50,569 | (30,689) |
| Departmental net financial position – End of year | (132,287) | 6,233 | 95,591 | (30,463) |
| Statement of Change in Departmental Net Debt | ||||
| Departmental net debt – Beginning of year | 98,231 | 0 | (50,569) | 47,662 |
| Departmental net debt – End of year | 141,113 | 0 | (95,591) | 45,522 |
| Statement of Cash Flows | ||||
| Amortization of tangible capital assets | 2,983 | 282 | 0 | 3,265 |
| Acquisitions of tangible capital assets | 3,110 | 4,842 | 0 | 7,952 |
14. Comparative Information
Comparative figures have been reclassified to conform to the current year’s presentation.
Return to endnote reference 8 [1]. In July 2013, Foreign Affairs and International Trade Canada changed its name to Foreign Affairs, Trade and Development Canada.
Annex to the
Statement of Management Responsibility
Including Internal Control Over Financial Reporting
Treasury Board of Canada Secretariat
Fiscal Year 2012–13
Table of Contents
- Introduction
- Departmental System of Internal Control Over Financial Reporting
- Assessment Results in Fiscal Year 2012–13
- Departmental Action Plan
1. Introduction
This document provides a summary of the measures taken by the Treasury Board of Canada Secretariat (the Secretariat) to maintain an effective system of internal control over financial reporting (ICFR), which includes information on internal control management, assessment results and related action plans.
Detailed information on the Secretariat’s authority, mandate and programs can be found in its Departmental Performance Report and Report on Plans and Priorities.
2. Departmental System of Internal Control Over Financial Reporting
2.1 Secretariat’s Control Environment Relevant to ICFR
The Secretariat recognizes the importance of senior management leadership in ensuring that employees at all levels understand their role in maintaining an effective ICFR system and are well equipped to exercise their responsibilities. The Secretariat’s objective is to continually improve its internal control environment using a risk-based approach and targeted resource investments to achieve the required level of effectiveness at a manageable cost.
2.1.1 Key positions, roles and responsibilities
Following are the Secretariat’s key positions and committees that have responsibilities for maintaining and reviewing the effectiveness of its ICFR system:
- Secretary of the Treasury Board
The Secretariat’s deputy head, as accounting officer, assumes overall responsibility and leadership for the measures taken to maintain an effective system of internal control. In this role, the Secretary chairs the Executive Committee and is a member of the Departmental Audit Committee.
- Chief financial officer (CFO)
The Secretariat’s CFO reports directly to the Secretary and provides leadership for the coordination, coherence, and design and maintenance of an effective, integrated system of ICFR, including its annual assessment.
- Assistant secretaries and other senior departmental managers
The Secretariat’s senior departmental managers in charge of program delivery are responsible for maintaining and reviewing the effectiveness of the ICFR system, as related to their respective mandates.
- Chief audit executive (CAE)
The Secretariat’s CAE reports directly to the Secretary and provides assurance through periodic internal audits, which are instrumental in maintaining an effective system of ICFR.
- Government of Canada Audit Committee (GCAC)
The GCAC is an advisory committee to the Secretary that provides objective views on the Secretariat’s financial statements and its risk management, control and governance frameworks. The committee comprises the Secretary and three external members. As such, it reviews the Secretariat’s corporate risk profile, internal audit reports and system of internal control, including the assessment and action plans relating to the ICFR system.
2.1.2 Key organization-wide controls in the Secretariat
The Secretariat’s control environment includes measures and tools to ensure compliance with ICFR and to support the management and oversight of its ICFR system. It also serves to raise awareness and help develop employees’ internal control knowledge and skill sets. Such measures include:
- A Values and Ethics Office, which provides educational and awareness programs and which has developed a departmental code of conduct;
- A corporate risk profile that is updated annually;
- A risk-based internal audit plan;
- A requirement for accounting designations in all financial executive positions, key financial management positions and all employees in the section in the Financial Management Directorate that is focused on the Secretariat’s ICFR system;
- Financial management policies , as well as the documentation of the Secretariat’s main business processes, and related key risk and control points;
- A regularly updated delegated authorities matrix;
- A financial management framework, including internal controls;
- Integrated financial planning, forecasting and reporting processes including investment planning;
- Training programs and regular communication to employees on core areas of financial and contract management; and
- Secure financial and contracting information technology (IT) processing systems to ensure enhanced security, data integrity, and transaction efficiency and effectiveness.
2.2 Service Arrangements Relevant to Financial Statements
2.2.1 Secretariat reliance on other federal government organizations
As a department, the Secretariat relies on other organizations to process certain transactions that are recorded in its financial statements. There are two types of arrangements as detailed below; common arrangements which are used by most departments and specific arrangements which are used specifically by TBS.
Common arrangements:
- Public Works and Government Services Canada (PWGSC) centrally administers the payment of salaries and the procurement of goods and services, as per PWGSC’s delegation of authority, and also provides accommodation services;
- Treasury Board of Canada Secretariat, as a government central agency, provides the department with information used to calculate various accruals and allowances, such as the accrued severance liability;
- The Department of Justice Canada provides legal services to the Secretariat; and
- Shared Services Canada manages IT general controls in the areas of email, data centre and network services. These controls include related security controls.
Specific arrangements:
- PWGSC performs the day-to-day administration of the Public Service Pension Plan (PSPP);
- The Office of the Chief Actuary within the Office of the Superintendent of Financial Institutions Canada prepares a triennial actuarial valuation of the PSPP;
- PWGSC performs the day-to-day administration of some centrally funded expenses, such as the employer’s share of Canada and Québec Pension Plan (CPP/QPP) contributions, employment insurance premiums and provincial payroll taxes. These types of expenses are recorded on the Secretariat’s financial statements as government-wide funds and reflect Treasury Board’s role as the employer of the public service.
2.2.2 Secretariat reliance on non-governmental service providers
The Secretariat relies on the internal controls of a number of insurance companies that provide specific services such as health care plan administration, dental plan administration and insurance services.
2.2.3 Secretariat services upon which other departments rely
Other government departments rely on the Secretariat to process certain transactions and to provide information that impacts their financial statements.
Common arrangements:
- The Office of the Comptroller General within the Secretariat provides all departments with percentage ratios, derived from the actuarially determined liability for severance benefits for the entire public service population, to be used when calculating their severance pay liability for purposes of their departmental financial statements;
- The Secretariat provides all departments with a percentage amount that allows them to calculate an annual dollar figure for the services they receive without charge for the public service insurance benefit plans funded centrally; and
- The Secretariat provides all departments with details regarding the calculation required to determine the employer’s share of employee benefit plans. These plans include costs to the government for the employer’s contributions and payments to the public service superannuation, the CPP/QPP and the death benefit and employment insurance accounts.
Specific arrangements:
The Secretariat provides certain corporate services to several departments, including the Department of Finance Canada, the Privy Council Office, the Canada School of Public Service and the Immigration and Refugee Board of Canada.
3. Assessment Results in Fiscal Year 2012–13
Business cycle controls at the Secretariat are grouped into two categories: business processes that concern the Secretariat in its role as manager of government-wide funds and public service employer payments and business processes that concern the Secretariat as a department.
In 2012–13, the Secretariat completed design effectiveness testing for its major government-wide pension and employee benefits plans, and conducted operating effectiveness testing for departmental business processes. In addition, the Secretariat continued to perform ongoing monitoring of selected controls related to its financial system, particularly user access and security controls.
3.1 Design Effectiveness Testing of Key Controls
3.1.1 Business cycle controls
The Secretariat in its role as a manager of government-wide funds and public service employer payments completed the assessment of design effectiveness testing of its majority of benefits plans. These plans represent $6.2 billion of the $6.5 billion total gross expenses reported in 2012–13 (approximately 95 per cent).
In 2012-13, design effectiveness testing was completed for the following processes:
- Public Service Dental Care Plan (PSDCP);
- Provincial payroll taxes;
- CPP/QPP contributions; and
- Employment insurance premiums.
In addition and as planned, the Secretariat completed the validation of observations related to design effectiveness testing for the Public Service Health Care Plan (PSHCP).
As a result of design effectiveness testing, the Secretariat identified the following remediation:
- Enhance the review of charges incurred through interdepartmental transfers from PWGSC related to CPP/QPP, employment insurance and provincial payroll taxes. A management action plan was prepared to address observations;
- Review the accounting presentation in the departmental financial statements of the contributions from participating employers under the PSHCP and PSDCP. Remediation of design deficiencies was initiated;
- Enhance verification of the accuracy of payments made to the plan administrator and of the contributions related to the PSHCP and PSDCP received from participating employers. Remediation of design deficiencies was initiated; and
- Enhance review of premiums related to the PSHCP for supplementary and comprehensive coverage. A management action plan is being prepared.
TBS also initiated assessment of the Service Income Security Insurance Plan (SISIP), including documenting process descriptions and design effectiveness testing for the SISIP is scheduled to be completed in 2013–14.
In its role as a department, the Secretariat completed validation of the process descriptions for low dollar value contracts.
3.2 Operating Effectiveness Testing of Key Controls
3.2.1 Business cycle controls
In 2012–13, the Secretariat, in its role as a department, completed operating effectiveness testing for acquisition card charges. The assessment focused on controls related to payments and account verification. As a result of the operating effectiveness testing, the Secretariat identified the need to update its procedures to align with current practices. This work has been completed.
During the year, the Internal Audit and Evaluation Bureau (IAEB) completed an audit of the interdepartmental settlements (IS) process in the Secretariat. The IS processes support the Secretariat in both of its roles. The audit objectives were to assess the adequacy and effectiveness of the management of IS and to determine whether the SAP financial system supports the IS process effectively and efficiently. Evidence supporting IT-dependent manual controls and application controls were also assessed to ensure maintenance of data integrity.
As a result of the audit of the IS process, certain gaps related to approvals and supporting documentation were identified for transactions related to employee benefits, the pension and taxes. A management action plan was prepared to ensure that these observations are addressed and will be completed by March 2014.
During 2012-13, the audit of the Administration of the External Expert Contract for the Strategic and Operating Review was completed. The objective of the audit was to assess the adequacy and effectiveness of the management control framework over the administration of the contract for the Strategic and Operating Review. In conclusion of this audit it was found that the management control framework over the administration of the contract for the Strategic and Operating Review was adequate and effective.
Some IAEB and Internal Control Unit activities are complementary. In these cases, both groups work together to ensure alignment of complementary activities to maximize results.
3.2.2 Information technology general controls
In 2012–13, the Secretariat initiated operating effectiveness testing of the IT general controls for the SAP financial system that impact the Secretariat’s financial statements. Areas of testing will cover controls related to information system operations, information security, back-up recovery, and application and database implementation and maintenance. The operating effectiveness testing is to be completed in 2013–14.
3.3 Ongoing Monitoring of Key Controls
In the current year, the Secretariat completed planned ongoing monitoring of the SAP financial system’s information security, specifically as related to user access control and segregation of duties. As a result of this monitoring, the Secretariat identified the need to update its procedures to reflect current practice. This work has been initiated and will be completed in 2013-14.
In addition, the Secretariat requested that its Integrated Financial and Materiel System (IFMS) Program Office conduct a security and authorization review of the SAP financial system, including a review of the authentication, security administration, and access and authorization control protocols. Assessment of operations and maintenance policies was part of this review. The review stated that the controls assessed were adequate and noted opportunities for further enhancing controls related to segregation of duties associated with the procurement to pay cycle and user access to functional configuration and view tables. A management action plan was prepared to address these observations which will be fully implemented in 2013-14. The previous formal review was completed in 2009, going forward, the Secretariat plans to conduct a formal review on a triennial basis.
4. Departmental Action Plan
4.1 Progress in Fiscal Year 2012–13
In 2012–13, the Secretariat has continued to make significant progress in assessing and improving its key controls. Following is the summary of the main progress made by the Secretariat based on the plans identified in previous years’ Annexes.
| Element in Previous Year’s Action Plan | Status |
|---|---|
| Secretariat as a department | |
| IT General Controls – Ongoing monitoring. This monitoring activity was identified in the 2010–11 Annex. |
Ongoing monitoring of the SAP financial system’s information security (user access control and segregation of duties) completed as planned. In addition unplanned operating effectiveness testing initiated for the SAP financial system to complement the above work. |
| Operating expenses / accounts payable – Design effectiveness and operating effectiveness testing. |
Documentation and validation of system description were completed for the new process related to low dollar value contracts. Operating effectiveness testing for acquisition card charges and remediation completed. Operating effectiveness testing for travel and hospitality deferred to 2013–14 due to other management priorities. |
| Secretariat as the manager of government-wide funds and public service employer payments | |
| Public Service Health Care Plan (PSHCP) – Design effectiveness testing. | Design effectiveness testing was completed in 2011–12, and validation of observations continued during 2012–13. Remediation of design deficiencies initiated as planned. |
| Public Service Dental Care Plan (PSDCP) – Design effectiveness testing. | Design effectiveness testing completed as planned. Remediation of design deficiencies initiated. |
| Provincial payroll taxes – Design effectiveness testing and operating effectiveness testing. | Design effectiveness testing and operating effectiveness testing completed. A management action plan was prepared to address deficiencies. |
| Employment insurance (EI) premiums – Design effectiveness testing and operating effectiveness testing. | Design effectiveness testing and operating effectiveness testing completed. A management action plan was prepared to address deficiencies. |
| Canada/Québec Pension Plan (CPP/QPP) contributions – Design effectiveness testing and operating effectiveness testing. | Design effectiveness testing and operating effectiveness testing completed. A management action plan was prepared to address deficiencies. |
| Service Income Security Insurance Plan (SISIP) – Design effectiveness testing. | Design effectiveness testing initiated as planned. |
| Pensioners’ Dental Services Plan (PDSP) – Design effectiveness testing. | Design effectiveness testing deferred to 2013–14 due to management priorities. |
| Public Service Management Insurance Plan – Design effectiveness testing. | Design effectiveness testing deferred to 2013–14 due to management priorities. |
| Provincial Health Insurance Plan premiums – Operating effectiveness testing. | Operating effectiveness testing completed through the internal audit of the IS process. |
| Québec Parental Insurance Plan – Operating effectiveness testing. | Operating effectiveness testing completed through the internal audit of the IS process. |
| Supplementary Death Benefit Plan – Operating effectiveness testing. | Operating effectiveness testing completed through the internal audit of the IS process. |
4.2 Status and Action Plan for the Next Fiscal Year and Subsequent Years
The Secretariat has made significant efforts to complete in-depth design effectiveness testing for the majority of its business processes related to government-wide funds and public service employer payments. With the assistance of Ernst & Young, the Secretariat is planning to substantially complete operating effectiveness testing for all levels of controls (entity level controls, IT general controls and business processes) by 2013–14 (see Table 2 below).
The Secretariat has reviewed its strategy for assessing the system of ICFR going forward. Instead of pursuing an in-depth assessment of design effectiveness for the remaining benefits plans, the Secretariat has decided to move to operating effectiveness testing in all areas of controls.
Based on this strategy, the Secretariat will not reassess the design of the Provincial Health Insurance Plan premiums, the Québec Parental Insurance Plan and the Supplementary Death Benefit Plan. The initial assessment conducted by an external consulting firm is considered to be sufficient given that the processes associated with these plans have not significantly changed. In addition, the controls related to these plans were assessed during the recent audit of the IS process by the IAEB. These plans represent $84 million (or approximately 1 per cent) of the Secretariat’s $6.5 billion total gross expenses reported in 2012–13.
Building on progress to date, the Secretariat is positioned to substantially complete the full assessment of its system of ICFR in 2013–14. At that time, the Secretariat will apply its rotational ongoing monitoring plan to reassess control performance on a risk basis across all areas.
The status and action plan for the 2013–14 fiscal year and subsequent years is as detailed in Table 2.
| Key Control Areas | Assessment Elements | ||
|---|---|---|---|
| Design Effectiveness Testing and Remediation See annex note (1) | Operating Effectiveness Testing and Remediation See annex note (1) | Ongoing Monitoring Rotation | |
|
|||
| Secretariat as a department | |||
| Entity level controls | Complete | 2013–14 | Future years See annex note (5) |
| IT general controls under departmental management | Complete | 2013–14 | 2015–16 See annex note (2) |
| Payroll and benefits | Complete | 2013–14 | Future years See annex note (5) |
| Operating expenses / accounts payable | Complete | 2013–14 | Future years See annex note (5) |
| Financial reporting and closing cycle | Complete | 2013–14 | Future years See annex note (5) |
| Revenues / accounts receivable | Complete | 2013–14 | Future years See annex note (5) |
| Budgeting and forecasting | Complete | 2014–15 | Future years See annex note (5) |
| Capital assets (new assessment element) | 2014–15 | 2015–16 | Future years See annex note (5) |
| Secretariat as manager of government-wide funds and public service employer payments | |||
| Public Service Pension Plan (PSPP) | Complete | 2013–14 | 2015–16 |
| Disability Insurance (DI) Plan | Complete | 2013–14 | 2015–16 |
| Public Service Health Care Plan (PSHCP) | Complete See annex note (3) | 2013–14 | 2016–17 |
| Public Service Dental Care Plan (PSDCP) | Complete | 2013–14 | 2016–17 |
| Provincial payroll taxes | Complete | Complete See annex note (4) | Future years See annex note (5) |
| Employment insurance (EI) premiums | Complete | Complete See annex note (4) | Future years See annex note (5) |
| Canada/Québec Pension Plan (CPP/QPP) contributions | Complete | Complete See annex note (4) | Future years See annex note (5) |
| Pensioners’ Dental Services Plan (PDSP) | 2013–14 | 2013–14 | Future years See annex note (5) |
| Public Service Management Insurance Plan | 2013–14 | 2013–14 | Future years See annex note (5) |
| Service Income Security Insurance Plan (SISIP) | 2013–14 | 2014–15 | Future years See annex note (5) |
| Provincial Health Insurance Plan premiums | Complete | Complete See annex note (4) | Future years See annex note (5) |
| Québec Parental Insurance Plan | Complete | Complete See annex note (4) | Future years See annex note (5) |
| Supplementary Death Benefit Plan | Complete | Complete See annex note (4) | Future years See annex note (5) |
Supplementary Information Tables
- Greening Government Operations
- Internal Audits and Evaluations
- Response to Parliamentary Committees and External Audits
- Sources of Respendable and Non-Respendable Revenue
- Status Report on Projects Operating With Specific Treasury Board Approval
- User Fees Reporting
Greening Government Operations (GGO)
Overview
The following outlines the Secretariat’s targets and implementation strategies to meet federal targets identified in the Federal Sustainable Development Strategy (FSDS) under Goal 8: Greening Government Operations (GGO). The targets that are relevant to the Secretariat’s operations relate to the areas of electronic waste (8.6), printing units (8.7), paper consumption (8.8), green meetings (8.9) and green procurement (8.10 and 8.11). For more information on the GGO targets, visit the Environment Canada website.
Note:
- RPP refers to the Report on Plans and Priorities and represents planned/expected results.
- DPR refers to the Departmental Performance Report and represents actual results.
Surplus Electronic and Electrical Equipment Target
| Performance Measure | RPP | DPR | |
|---|---|---|---|
| Target Status | Achieved | ||
| Existence of implementation plan for the disposal of all departmentally generated EEE. (Optional in RPP 2011–12) | Yes, completed December 2011 | Yes, completed December 2011 | |
| Total number of departmental locations with EEE implementation plan fully implemented, expressed as a percentage of all locations, by the end of the given fiscal year. | FY 2011–12 | 100% | 100% |
| FY 2012–13 | 100% | 100% | |
| FY 2013–14 | 100% | ||
Strategies/Comments
- FY 2011–12: The Secretariat has evaluated and adjusted its practices to be fully compliant in all 11 of its employment locations. These practices are documented in the Secretariat’s Asset Management Framework and reinforced at operational levels.
- FY 2012–13: The Secretariat continues to maintain 100 per cent compliance.
- FY 2013–14: The Secretariat will monitor compliance and adjust operations as appropriate.
- Rationale for traffic light indicator selected: The Secretariat has achieved 100 per cent of locations that have an EEE implementation plan fully implemented.
Printing Unit Reduction Target
| Performance Measure | RPP | DPR | |
|---|---|---|---|
| Target Status | Achieved | ||
| Ratio of departmental office employees to printing units in fiscal year (FY) 2010–11, where building occupancy levels, security considerations and space configuration allow. (Optional) | N/A | N/A | |
| Ratio of departmental office employees to printing units at the end of the given fiscal year, where building occupancy levels, security considerations and space configuration allow. | FY 2011–12 | 2.4:1 | 2.4:1 |
| FY 2012–13 | 8:1 | 8:1 | |
| FY 2013–14 | 8:1 | ||
Strategies/Comments
- FY 2011–12: The Secretariat has undertaken a study to determine the departmental inventory of printing units.
- A centralized procurement model and associated controls were implemented to replace the decentralized approach historically used within the department.
- A plan has been developed to consolidate and reduce the number of printing units in order to move rapidly toward achieving the 8:1 ratio of staff to printing units in 2012–13. A senior advisor and a project manager are in place to ensure that the plan is implemented; they will be working with the Secretariat’s administrators in the first two quarters of 2012–13 to confirm plans and implement next steps.
- “Printing units” has been defined as desktop printers, networked printers, multi-functional devices and photocopiers.
- A tracking methodology for the printing units deployed and the number of office employees has been established. The number and location of printers are available through information technology (IT) system reports. The number of office employees is provided by the department’s financial management plans (2,273 employees). This number includes casual, term and full-time employees, as well as consultants.
- A non-compliance directive is being developed for senior management approval.
- FY 2012–13: The Secretariat has implemented the printer device reduction plan. It has disposed of 651 local and network printers in an environmentally sound and secure manner; 91 non-multi-function devices (photocopiers) were replaced by multi-function devices.
- FY 2013–14: The Secretariat will continue its effort in reducing the number of printing devices.
- Rationale for traffic light indicator selected: The Secretariat is on track to achieve its target.
Paper Consumption Target
| Performance Measure | RPP | DPR | |
|---|---|---|---|
| Target Status | Achieved | ||
| Number of sheets of internal office paper purchased or consumed per office employee in the baseline year selected, as per departmental scope. (Optional in RPP 2011–12) | 12,318 per employee in 2011–12 (51 sheets per employee per day) | ||
| Cumulative reduction (or increase) in paper consumption, expressed as a percentage, relative to baseline year selected. (Optional in RPP 2011–12) | FY 2011–12 | 12,318 per employee in 2011–12 (51 sheets per employee per day) | 12,318 per employee in 2011–12 (51 sheets per employee per day) |
| FY 2012–13 | 10% or 5 fewer sheets per employee per day | 9,922 per employee in 2012–13 (42 sheets per employee per day | |
| FY 2013–14 | 20% or 10 fewer sheets per employee per day | ||
Strategies/Comments
- In FY 2011–12, the Secretariat conducted a baseline study of its estimated annual paper usage per employee per day.
- A measurement methodology for tracking paper consumption and employee counts has been developed. The paper consumption rate was determined from the quantity of paper used in one fiscal year. The employee number of 2,273 was derived from financial management plans for the department. This number includes casual, term and full-time employees, as well as consultants.
- A strategy to reduce consumption by targeting a number of specific initiatives has been developed (green meetings, double-sided printing and employee engagement). New technologies (e.g., tablets) are also being piloted in the department to demonstrate leadership in achieving the digital office of the future.
- The ratio of 51 sheets per employee per day was calculated by dividing the overall quantity of paper used by the number of employees and then dividing the result by the average number of annual working days (242) in a fiscal year.
- In FY 2011–12, Departmental Performance Reports and the 11th edition of the Canada’s Performance report were made available to members of Parliament and Canadians in electronic format, rather than in thousands of pages of printed volumes, as was done only a year earlier.
- In FY 2012–13, the Secretariat achieved a 20-per-cent reduction in paper consumption per employee, which is represented by 10 fewer sheets per employee per day. Multi-function devices have been introduced and defaulted to print double-sided and in black and white.
- In FY 2013–14, the Secretariat anticipates attaining a higher ratio than 20 per cent less paper consumption per employee when a stronger campaign to raise awareness is undertaken.
- Rationale for traffic light indicator selected: The Secretariat has achieved the 20-per-cent reduction in paper consumption.
Green Meetings Target
| Performance Measure | RPP | DPR |
|---|---|---|
| Target Status | Achieved | |
| Presence of a green meeting guide. (Optional in RPP 2011–12) | N/A | Yes: March 2012 |
Strategies/Comments
- The Secretariat defines adoption as occurring once the guide has been formally endorsed by the appropriate senior management committee.
- In FY 2011–12, the Secretariat’s Sustainable Development Committee assessed a proven, federally accepted guide for green meetings and adapted it for the department’s meeting purposes.
- The key components of the guide include information for meeting organizers and meeting participants, roles and responsibilities, key principles of green meetings and key greening areas.
- In FY 2012–13, the Secretariat continued to communicate the guide in a prominent location on its website.
- Rationale for traffic light indicator selected: The Secretariat has adopted a green meeting guide.
Green Procurement Targets
8.10 As of April 1, 2011, each department will establish at least three SMART (specific measurable, achievable, realistic, time-bound) green procurement targets to reduce environmental impacts.
| Performance Measure | RPP | DPR |
|---|---|---|
| Target Status | Achieved | |
| By March 31, 2012, the Secretariat has surveyed its existing equipment, procures only compliant equipment and has developed an implementation plan. | N/A | 100% |
| By April 1, 2014, the Secretariat has implemented its plan. | ||
Strategies/Comments
- This SMART target was selected by management after a full review of internal corporate services' operations. It meets the criteria for being specific, measurable, achievable, relevant and time-bound.
- The settings are applied to all employees without exception. Shut-down time is set to start after midnight to provide flexibility for employees working late. Workstations include desktops and laptops.
- FY 2011–12: The Secretariat has surveyed its current equipment and has implemented a third-party application for desktop power management at the enterprise level. All new computers and monitors will support this power management system.
- FY 2012–13: The Secretariat has sought to improve power management capabilities by deploying SMART procurement strategies for information technology and extending the duration of the shut-down periods, as the desktop operating system permits.
- FY 2013–14: The Secretariat seeks ongoing continuous improvement.
- Rationale for traffic light indicator selected: The Secretariat has achieved its self-selected target.
| Performance Measure | RPP | DPR |
|---|---|---|
| Target Status | Achieved | |
| By March 31, 2012, Secretariat procedures are documented and a monitoring strategy is developed. | N/A | 100% |
| By March 31, 2013, the monitoring strategy has been implemented. | 100% | 100% |
| By March 31, 2014, all purchases comply with the target. | 100% | |
Strategies/Comments
- This SMART target was selected by management after a full review of internal corporate services’ operations. It meets the criteria for being specific, measurable, achievable, relevant and time-bound.
- FY 2011–12: The Secretariat has ensured that the procedures for the purchase of small appliances were received by all employees through a formal communiqué. All purchases are now vetted through a central corporate services team to ensure consistency with energy use standards.
- FY 2012–13: The Secretariat continues to vet all purchases through a central corporate services team to ensure consistency with energy use standards.
- Rationale for traffic light indicator selected: The Secretariat has achieved its self-selected target.
| Performance Measure | RPP | DPR |
|---|---|---|
| Target Status | Achieved | |
| By April 1, 2011, all new vehicles are hybrids or ultra-low emissions vehicles. | N/A | 100% |
Strategies/Comments
- This SMART target was selected by management after a full review of internal corporate services’ operations. It meets the criteria for being specific, measurable, achievable, relevant and time-bound.
- The Secretariat operates a very small fleet of executive vehicles, which are purchased centrally. Effective April 1, 2011, any vehicles purchased to support these activities will meet the stated target. No vehicles were purchased this fiscal year.
- FY 2012–13: The Secretariat continues to ensure that all vehicles purchased are hybrids or ultra-low emissions vehicles.
- Rationale for traffic light indicator selected: The Secretariat has achieved its self-selected target.
Departmental SMART Targets
8.11 As of April 1, 2011, each department will establish SMART targets for training, employee performance evaluations, and management processes and controls, as they pertain to procurement decision making.
| Performance Measure | RPP | DPR |
|---|---|---|
| Target Status | Achieved | |
| By March 31, 2013, the Secretariat has developed a procurement training program for fund centre managers that includes green procurement training. | 100% | 100% of relevant fund centre managers have received green procurement training as of March 31, 2012. |
| By March 31, 2014, all fund centre managers have completed the green procurement training. | 100% | 100% |
Strategies/Comments
- This SMART target was selected by management after a full review of internal corporate services’ operations. It meets the criteria for being specific, measurable, achievable, relevant and time-bound.
- The Secretariat’s Procurement and Contracting Division has reviewed and accepted the training material offered in the Delegation of Authority course for fund centre managers that is mandated by the department and offered by the Canada School of Public Service.
- The Secretariat’s fund centre managers receive green procurement training as part of their mandatory training to receive delegation of financial signing authority. Training statuses are monitored to ensure they are up to date.
- The Secretariat’s Procurement and Contracting Division is currently offering two-hour bilingual training sessions to all interested employees. Training material and discussion forums include Federal Sustainable Development Strategy components.
- FY 2012–13: The Secretariat continues to ensure monitoring.
- Rationale for traffic light indicator selected: The Secretariat has achieved its training target.
| Performance Measure | RPP | DPR |
|---|---|---|
| Target Status | Achieved | |
| By December 31, 2011, all procurement strategies developed in support of Secretariat requirements include green procurement considerations. | N/A | 100% |
Strategies/Comments
- This SMART target was selected by management after a full review of internal corporate services’ operations. It meets the criteria for being specific, measurable, achievable, relevant and time-bound.
- The Secretariat has documented its procurement procedures and incorporated green procurement considerations in the development of the procurement strategies for contracted goods and services; they form part of the integrated procurement planning process.
- For every significant purchase through the Procurement and Contracting Division, the Secretariat has adopted the use of the Procurement Strategy Form, which captures and documents any green procurement considerations. The form must be filled out and included in all contracting files.
- Rationale for traffic light indicator selected: The Secretariat has achieved its target.
| Performance Measure | RPP | DPR |
|---|---|---|
| Target Status | Achieved | |
| By December 31, 2011, the Secretariat has procurement processes that clearly incorporate green procurement considerations. | Processes and controls have been developed and are in place. | |
Strategies/Comments
- This SMART target was selected by management after a full review of internal corporate services' operations. It meets the criteria for being specific, measurable, achievable, relevant and time-bound.
- FY 2011–12: The Secretariat has documented its procurement procedures and controls.
- FY 2012–13: The Secretariat has incorporated its green procurement processes into its procurement guidance and training material, and the information site remains under development.
- Rationale for traffic light indicator selected: The Secretariat has achieved its target.
| Performance Measure | RPP | DPR |
|---|---|---|
| Target Status | Achieved | |
| Number of performance evaluations of identified positions that have environmental considerations relative to the total of identified positions. | 100% | 100% |
| Progress against measure in the given fiscal year. | 100% | 100% |
Strategies/Comments
- This SMART target was selected by management after a full review of internal corporate services’ operations. It meets the criteria for being specific, measurable, achievable, relevant and time-bound.
- FY 2011–12: The Secretariat identified six key positions within the department that have responsibility for managing or leading procurement services for programs and services.
- FY 2012–13 and ongoing: Environmental considerations remain part of performance measures.
- Rationale for traffic light indicator selected: The Secretariat has achieved its target.
Internal Audits and Evaluations
Internal Audits (current reporting period)
| Name of Internal Audit | Internal Audit Type | Status | Completion Date |
|---|---|---|---|
| Audit of Business Continuity Planning | Assurance | Completed | June 2012 |
| Audit of the Administration of the External Expert Contract for the Strategic Operating Review | Assurance | Completed | June 2012 |
| Audit of the Interdepartmental Settlements Process | Assurance | Completed | July 2013 |
| Audit of Human Resources Planning for Recruitment and Staffing | Assurance | Completed | July 2013 |
Evaluations (current reporting period)
| Name of Evaluation | Program Activity | Status | Completion Date |
|---|---|---|---|
| Evaluation of the Official Languages Centre of Excellence Initiative | People Management | Completed | May 2013 |
| Evaluation of the Secretariat’s Monitoring of High-Risk, Complex IT-Enabled Projects | Management Frameworks | In progress | November 2013 |
| Evaluation of the Right of First Refusal for Guard Services | Financial Management | In progress | March 2014 |
| Evaluation of the Student Employment Programs (joint evaluation with the Public Service Commission) |
People Management | In progress | March 2014 |
Response to Parliamentary Committees and External Audits
Response to Parliamentary Committees
| Summary of Report | Discussion of progress made to address recommendations | Link to the Secretariat's response |
|---|---|---|
|
The Committee noted that although amendments to the Lobbying Act were proposed by some witnesses, the testimony suggested that the Act is generally working well in accordance with its objectives. The Committee made eleven recommendations for changes to the Lobbying Act. Three of the recommendations made by the Commissioner of Lobbying in her report Administering the “Lobbying Act”: Observations and Recommendations Based on the Experience of the Last Five Years overlap with the Committee’s recommendations. The balance of the recommendations relate to issues brought forward by various witnesses to the Committee as part of the statutory review of the Act. |
The Government Response, tabled on September 17, 2012, supports two of the Committee’s recommendations. It proposes consideration of alternative means to implement another six recommendations and further study for the remaining three recommendations. The Government continues to study the recommendations with a view to improving transparency and accountability, while balancing the Lobbying Act’s objectives and taking into account any associated recommendations from the parliamentary-led legislative review of the Conflict of Interest Act. |
(Presented to the House on September 17, 2012) |
| Summary of Report | Discussion of progress made to address recommendations | Link to the Secretariat's response |
|---|---|---|
|
The Committee focused its study on examining the Estimates process on three levels - procedures, structure and support - in order to identify ways to strengthen parliamentary scrutiny. The Committee noted it was hopeful that the report would lead to greater and better standing committee scrutiny of the Estimates by improving parliamentary processes and by ensuring that parliamentarians receive clear and understandable information. |
For Recommendation 1, the Treasury Board of Canada Secretariat (the Secretariat) completed its study of accrual-based budgeting and appropriations, which concluded that both cash and accrual information is important to support decision making. The Secretariat will continue to support the use of accrual methods for budgeting, accounting and reporting; however, these methods are not suitable for appropriations. |
(Presented to the House on October 18, 2012) |
| Summary of Report | Discussion of progress made to address recommendations | Link to the Secretariat's response |
|---|---|---|
|
The Committee recognized the work done by the Office of the Comptroller General in providing leadership and direction to departments on internal audit and by departments in the improvements they have made in their internal audit activities. The Committee asked that certain departments and agencies provide the results of the external quality assessment of their internal audit activity. |
In its response, the Government affirmed its continued commitment to the Treasury Board Policy on Internal Audit and provided completed external quality assessment reports for the Secretariat, the Canada Border Services Agency, Correctional Services Canada, the Department of Finance Canada and Human Resources and Skills Development Canada. The remaining assessments will be provided to the Committee by the responsible ministers once completed. |
(Presented to the House on June 6, 2012) |
| Summary of Report | Discussion of progress made to address recommendations | Link to the Secretariat's response |
|---|---|---|
|
The Committee recognized the work done by the Office of the Comptroller General in providing leadership and direction to departments on financial management and control and risk management. It also noted the improvements that departments have made in these areas. The Committee asked that departments complete scheduled risk-based assessments of the design and effectiveness of their financial reporting controls and provide these assessments to the Committee. It also encouraged the Secretariat to complete its study of its evaluation of accrual-based budgeting and accrual-based appropriations. |
As requested in Recommendation 1, the completed assessments from the Department of Finance Canada and Veterans Affairs Canada were shared with the Committee. These two assessments demonstrated that both departments were maintaining an effective system of internal control over financial reporting, identifying risks and taking action to mitigate them. The Secretariat completed its study of accrual-based budgeting and accrual-based appropriations, which concluded that both cash and accrual information is important to support decision making. The Secretariat will continue to support the use of accrual methods for budgeting, accounting and reporting; however, these methods are not suitable for appropriations. |
(Presented to the House on August 22, 2012) |
| Summary of Report | Discussion of progress made to address recommendations | Link to the Secretariat's response |
|---|---|---|
|
The Committee recommended that the Secretariat provide the results of its review of the circumstances in which capital votes are required and of the factors that determine which expenditures are to be charged to capital votes. The Committee also recommended that the Secretariat update its guidance on these matters in time for the preparation of the 2013–14 Main Estimates. |
In consultation with departments, the Secretariat developed a common definition of capital items. The definition was finalized and communicated to the chief financial officers of capital-intensive departments on May 25, 2012. This definition provides greater clarity and direction to departments, with the aim of improving consistency of practice. While some departments are already using the common definition of capital expenditure, other departments will require additional time to make the necessary changes to departmental policies, financial systems, and costing and planning processes. The Secretariat will continue to monitor implementation, which will be phased in over the next few Estimates cycles. |
(Presented to the House on October 4, 2012) |
| Summary of Report | Discussion of progress made to address recommendations | Link to the Secretariat's response |
|---|---|---|
|
The Committee’s report is based on an audit of bilingual passenger services at Air Canada, released by the Office of the Commissioner of Official Languages in September 2011, and on evidence presented to the Committee during public hearings held in the fall of 2011. The Committee made a number of recommendations directly to the Air Canada Corporation to ensure the provision of services of equal quality in English and French. The two final recommendations were for the Secretariat regarding amending the Official Languages (Communications with and Services to the Public) Regulations and ensuring protection of the language rights of Air Canada employees. |
The Government response noted that since Air Canada’s privatization in 1988, the Government has clearly stated its intention to maintain the carrier’s official languages obligations as a “federal institution” under the Official Languages Act. The Secretariat continues to work closely with all federal institutions to ensure they meet their obligations under the Official Languages Act. |
(Tabled in the Senate on October 4, 2012) |
Response to the Auditor General (including to the Commissioner of the Environment and Sustainable Development)
2012 Spring Report of the Auditor General of Canada
Chapter 2, “Replacing Canada’s Fighter Jets”
The audit objectives were to determine whether National Defence and Industry Canada applied due diligence in managing Canada’s participation in the United States–led Joint Strike Fighter (JSF) Program, and whether National Defence and Public Works and Government Services Canada applied due diligence in managing the Canadian Next Generation Fighter Capability project for the replacement of the CF-18 fighter jets.
The Secretariat received no recommendations.
Chapter 3, “Interest-Bearing Debt”
The audit examined whether the Department of Finance Canada (the Department) and the Secretariat, consistent with their respective responsibilities, effectively managed the interest-bearing debt of the Government of Canada.
The audit had the following sub-objectives:
- Determine whether the Department implemented a sound decision-making system to support and develop effective market debt strategies;
- Determine whether the debt management strategies responded to emerging risks and changing funding requirements;
- Determine whether the Department assessed the performance of the debt management strategies by establishing objectives and monitoring performance, and used performance results to support debt management decisions; and
- Determine whether the Department and the Secretariat reported comprehensive and clear information on the budgetary impact of the public sector pension plans.
The Secretariat received two recommendations. The Secretariat’s responses can be found in this chapter’s Appendix B—List of recommendations.
2012 Spring Report of the Commissioner of the Environment and Sustainable Development
Chapter 3, “Federal Contaminated Sites and Their Impacts”
The objective of the audit was to determine whether federal entities have appropriate systems in place to manage and report the financial impact of environmental damages arising from federal contaminated sites.
The Secretariat received two recommendations. The Secretariat’s responses can be found in this chapter’s Appendix—List of recommendations.
2012 Fall Report of the Auditor General of Canada
Chapter 1, “Planning the Use of Professional Service Contractors”
The objective of the audit was to determine whether selected departments adequately plan their use of professional service contractors.
The Secretariat received no recommendations.
Chapter 2, “Grant and Contribution Program Reforms”
The overall objective of the audit was to determine whether the government adequately implemented the 2008 Government of Canada Action Plan to Reform the Administration of Grant and Contribution Programs.
The audit had the following sub-objectives:
- Determine whether the government has fulfilled the commitments made in the 2008 Government of Canada Action Plan to Reform the Administration of Grant and Contribution Programs;
- Determine whether the Secretariat (as a central agency) is meeting the policy requirements it was assigned, as articulated in the 2008 Policy on Transfer Payments; and
- Determine whether selected federal organizations have implemented selected policy requirements in the 2008 Policy on Transfer Payments for selected programs.
The Secretariat received two recommendations. The Secretariat’s responses can be found in this chapter’s Appendix—List of recommendations.
Chapter 3, “Protecting Canadian Critical Infrastructure Against Cyber Threats”
The objective of the audit was to determine whether selected departments and agencies of the federal government are leading and coordinating activities, with partners, to secure Canada’s critical infrastructure from cyber threats.
The Secretariat received one recommendation. The Secretariat’s response can be found in this chapter’s Appendix—List of recommendations.
2012 Fall Report of the Commissioner of the Environment and Sustainable Development
Chapter 2, “Financial Assurances for Environmental Risks”
The objective of the audit was to determine whether federal entities have appropriate systems in place to manage the risks of the financial impact of environmental damages. The focus was on determining whether selected entities had systems for obtaining and managing environmental financial assurances that would reflect risks and minimize cost, including whether liability limits were sufficient.
The Secretariat received no recommendations.
Chapter 5, “Environmental Petitions”
The objective of this annual report was to inform Parliament and Canadians about environmental petitions. In accordance with section 23 of the Auditor General Act, Part I of the report describes the number, nature and status of petitions received, and the timeliness of responses from ministers. Part II of the report provides an update on the federal government’s responses to petitions on hydraulic fracturing.
The Secretariat received no recommendations.
External Audits Conducted by the Public Service Commission of Canada or the Office of the Commissioner of Official Languages
Not applicable
Sources of Respendable and Non-Respendable Revenue
Respendable Revenue
| Program | Actual 2010–11 ($ thousands) |
Actual 2011–12 ($ thousands) |
2012–13 ($ thousands) | |||
|---|---|---|---|---|---|---|
| Main Estimates |
Planned Revenue |
Total Authorities |
Actual | |||
|
1 Respendable revenue is received to cover salaries and operating costs related to public service superannuation pursuant to the Public Service Superannuation Act. 2 Effective April 1, 2011, and pursuant to section 29.2 of the Financial Administration Act, departments are authorized to provide internal support services to other departments. In previous years, the costs for services provided were recovered from other departments and offset against the related expenditures. 3 Respendable revenue is received to cover health care insurance plan costs from revolving funds and from departments and agencies that pay for employee benefit plans from an appropriation. This account is also used to record pensioners’ share of dental care plan contributions. |
||||||
| People Management | ||||||
| Revenue related to the administration of the Public Service Superannuation Act See Respendable Revenue note 1 | 4,564 | 4,375 | 6,835 | 6,835 | 6,370 | 3,847 |
| Internal Services See Respendable Revenue note 2 | 0 | 8,407 | 6,209 | 6,209 | 6,674 | 6,674 |
| Government-Wide Funds and Public Service Employer Payments | ||||||
| Revenue related to public service insurance See Respendable Revenue note 3 | 371,986 | 425,959 | 445,197 | 445,197 | 441,164 | 434,162 |
| Total Respendable Revenue | 376,550 | 438,741 | 458,241 | 458,241 | 454,208 | 444,683 |
Non-Respendable Revenue
| Program | Actual 2010–11 ($ thousands) |
Actual 2011–12 ($ thousands) |
2012-13 ($ thousands) | |
|---|---|---|---|---|
| Planned Revenue |
Actual | |||
|
1 The revenue represents parking fees collected from public servants in government-owned or government-leased facilities. This revenue is deposited directly to the Consolidated Revenue Fund and cannot be used to offset operating expenditures. Revenue has been decreasing due to the implementation of the 2010 policy requiring employees to pay market rates for government parking. 2 The revenue is received from the Public Service Superannuation Account and the Public Service Pension Fund for the costs of the administration of the Public Service Superannuation Act. These costs represent the expenses directly attributable to the delivery of pension plan administration, including employee salaries, benefit plans, health and accommodation. 3 The reversals of the payables at year end (PAYE) are attributed to estimated claims based on plan experience for the Public Service Health Care Plan, the Public Service Dental Care Plan and the Pensioners’ Dental Services Plan. The majority of the PAYE reversals relate to 2009–10 estimates that did not occur as expected. |
||||
| Revenue from parking fees See Non-Respendable Revenue note 1 | 10,672 | 7,545 | 6,819 | 4,787 |
| Revenue related to the administration of the Public Service Superannuation Act See Non-Respendable Revenue note 2 | 931 | 981 | 1,591 | 877 |
| Refunds of previous year’s expenditures See Non-Respendable Revenue note 3 | 590 | 62,449 | 0 | 4,013 |
| Other | 76 | 26 | 0 | 39 |
| Total Respendable Revenue | 12,269 | 71,000 | 8,410 | 9,716 |
Status Report on Projects Operating with Specific Treasury Board Approval
| Project | Original Estimated Total Cost |
Revised Estimated Total Cost |
Actual Total Cost to Date |
Main Estimates 2012–13 |
Planned Spending 2012–13 |
Total Authorities 2012–13 |
Actual 2012–2013 |
Expected date of close-out |
|---|---|---|---|---|---|---|---|---|
|
Notes:
|
||||||||
| Real Property Services | ||||||||
| Workspace Renewal Project (PPA) See Status Report on Projects Operating note 1 * | 54,000 | 54,000 | 2,838 | 0 | 2,110 | 2,110 | 1,876 | 2016 |
| Management of Information Technology | ||||||||
| Human Resource Business Solution Pilot (EPA) See Status Report on Projects Operating note 2 ** | 13,189 | 13,189 | 8,927 | 0 | 6,740 | 8,240 | 6,021 | 2014 |
| Human Resource Data Interoperability (PPA) | 2,960 | 2,960 | 586 | 0 | 0 | 600 | 586 | 2014 |
User Fees Reporting
User fee: Fees charged for the processing of access requests filed under the Access to Information Act
Fee type: Other Goods and Services (O)
Fee-setting authority: Access to Information Act
Year last modified: Current fees allowed since 1983
Performance standards: Response provided within 30 days following receipt of request; the response time may be extended pursuant to section 9 of the Access to Information Act. Notice of extension is to be sent within 30 days after receipt of the request.
Performance results: Statutory deadline met 95 per cent of the time.
|
2012–13 ($ thousands) |
Planning years ($ thousands) |
||||
|---|---|---|---|---|---|
| Forecast revenue | Actual revenue | Full cost | Fiscal year | Forecast revenue | Estimated full cost |
| 2.0 | 1.1 | 430 | 2013-14 | 2.5 | 400 |
| 2014-15 | 2.8 | 410 | |||
| 2015–16 | 2.9 | 420 | |||
Tax Expenditures and Evaluations Report
The tax system can be used to achieve public policy objectives through the application of special measures such as low tax rates, exemptions, deductions, deferrals and credits. The Department of Finance Canada publishes cost estimates and projections for these measures annually in its Tax Expenditures and Evaluations publication. The tax measures presented in this publication are solely the responsibility of the Minister of Finance.
Footnotes
Return to footnote reference [1] In July 2013, Foreign Affairs and International Trade Canada changed its name to Foreign Affairs, Trade and Development Canada.
Return to footnote reference [2] In July 2013, Foreign Affairs and International Trade Canada changed its name to Foreign Affairs, Trade and Development Canada.
Return to footnote reference [3] “Approved” plans reflect those that have been approved by Treasury Board ministers.
Return to footnote reference [4] “Acknowledged” plans reflect those received by the Secretariat that do not require approval by Treasury Board ministers.