Common menu bar links
Breadcrumb Trail
ARCHIVED - Natural Sciences and Engineering Research Council - Report
 This page has been archived.
Archived Content
Information identified as archived on the Web is for reference, research or recordkeeping purposes. It has not been altered or updated after the date of archiving. Web pages that are archived on the Web are not subject to the Government of Canada Web Standards. As per the Communications Policy of the Government of Canada, you can request alternate formats on the "Contact Us" page.
Section II: Analysis of Program Activities by Strategic Outcome
Strategic Outcome People: Highly skilled science and engineering professionals in Canada
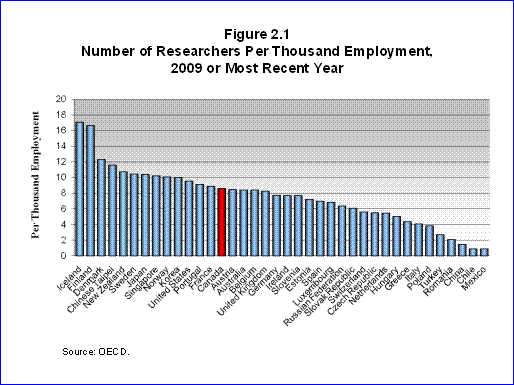
In 2010-11, NSERC supported 29,200 students and fellows at Canadian universities and abroad and provided programs to support nearly 11,800 university professors at Canadian universities and to attract leading global researchers to Canada. NSERC also promoted science and engineering to Canadian youth to stimulate their interest in pursuing advanced education, and to ensure a reliable supply of highly skilled workers. Through its investments in people, NSERC helps build a diverse, globally-competitive and technologically advanced knowledge-based economy for Canada. Figure 2.1 presents the total researchers per thousand employed relative to other Organization for Economic Cooperation and Development (OECD) countries. Canada is currently in 14th place, ahead of Germany, Australia and the United Kingdom.
Number of Researchers Per Thousand Employment, 2009 or Most Recent Year
Program Activity: Promote Science and Engineering
Program Activity Description
This program activity encourages popular interest in science, math and engineering and aims to develop science, math and engineering abilities in Canadian youth.
| Planned Spending | Total Authorities | Actual Spending |
|---|---|---|
| 5.66 | 5.66 | 11.93 |
| Planned | Actual | Difference |
|---|---|---|
| 1 | 1 | 0 |
| Expected Results |
Performance Indicators |
Targets | Performance Status |
|---|---|---|---|
| Student interest in research in the sciences, math and engineering is encouraged | Percentage of science promotion projects that successfully complete the planned activity | Greater than 80% | Exceeded - Post award surveys indicate that 86% of PromoScience grants successfully fulfill the objectives of the grant. |
| Program | Description | Expenditures 2010-11 ($ millions) |
|---|---|---|
| PromoScience | PromoScience provides support to non-profit and public organizations that work with young Canadians in order to build their interest in science and engineering, motivate and encourage their participation in science and engineering activities, and train teachers who are responsible for the science and math education of young Canadians. | 2.7 |
| Prizes | NSERC prizes recognize outstanding individual Canadian researchers, research teams and students. They enhance the career development of outstanding and highly promising scientists and engineers and distinguish the sustained excellence of faculty members at Canadian universities. They also publicly recognize lasting partnerships in R&D between university and industry and celebrate young Canadian entrepreneurs. | 2.7 |
Performance Summary and Analysis of Program Activity
The PromoScience program allows organizations active in science promotion to expand their efforts and engage many more young Canadians, especially girls and aboriginal youth. A final report was submitted at the end of each PromoScience grant. For grants ending in 2010-11, 86% of recipients rated the outcome of the grant as successful.
The grants have enabled recipient organizations to reach hundreds of thousands of Canadian youth and promote a science culture. The profile of one of the 2010-11 PromoScience recipients is presented below.
PromoScience Recipient – Bamfield Marine Sciences Centre
PromoScience funding supports the Bamfield Marine Sciences Centre's Public Education Program, which promotes science and science careers to youth through field trips, professional development workshops for teachers, youth forums, and youth-targeted outreach.
During field trips, youth are immersed in science, particularly oceanography, and are supported to design experiments, collect and analyze data and share the results with their peers. This approach encourages the integration of geology, physics, chemistry, math and technology with biology.
While the Public Education Program primarily reaches youth living within British Columbia, the PromoScience grant has helped the Bamfield Marine Sciences Centre expand its reach to a national level. Schools across Canada are now able to participate in the program through Live Labs and Live Dives using video-conferencing and diving technology. All of the resources developed for remote participation facilitate engaged learning. The activities supported by NSERC reach close to 4,000 participants, including 450 teachers every year. Through their involvement with the program, youth learn that they have a significant role to play in shaping the new generation of discoverers and innovators.
In 2010-11, NSERC awarded significant research prizes to individuals and teams of Canadian research scientists and engineers, to recognize their important achievements, and, in the process, to help retain faculty in Canada. The profile of the 2010-11 winner of NSERC's Gerhard Herzberg Canada Gold Medal for Science and Engineering is presented below.
Geoffrey Hinton, Computer science - University of Toronto
The staggering volume of data available today has generated a growing need for automated systems that can spot patterns, learn from examples, understand the "big picture" and make predictions. This trend makes machine learning one of the most important frontiers in modern science.
The University of Toronto's Geoffrey Hinton is among the world's foremost researchers in the field. His contributions to machine learning and artificial intelligence have benefited virtually every discipline in science, engineering, social science and medicine.
As a result of Dr. Hinton's research, computers are now better at finding complicated patterns in scientific, medical, economic or other data. He has developed algorithms used in applications such as creating better systems for voice recognition, automatically reading bank cheques and monitoring industrial plants for improved safety. Dr. Hinton has also contributed to cognitive psychology and neuroscience by proposing influential theories of how the brain generates its internal representations of the visual world from the sensory input it receives from the eyes.
Dr. Hinton's numerous international awards include the inaugural David E. Rumelhart Prize in 2001, which recognizes outstanding contributions to the theoretical foundations of human cognition. He also received the 2005 International Joint Conferences on Artificial Intelligence Research Excellence Award, a prestigious honour that has been awarded to only 12 recipients over the past 24 years.
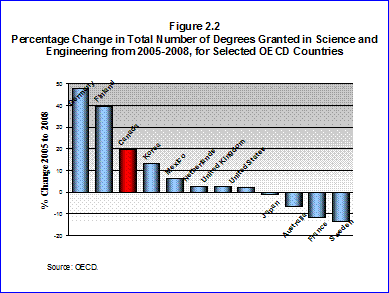
Canada's per capita production of science and engineering university degrees at all levels lags behind many of its major competitors. The situation, however, is improving. Canada is amongst the top OECD countries in terms of the percentage change in the number of university degrees granted in science and engineering from 2005-2008 (see Figure 2.2).
Canada's number of degrees granted in science and engineering increased 19.9 percent from 2005 to 2008; a much higher rate than that of the United States, Japan and the United Kingdom and at a rate which was only surpassed by Finland and Germany.
Program Activity: Support Students and Fellows
Program Activity Description
This program activity supports training of highly qualified personnel through scholarship and fellowship programs.
| Planned Spending | Total Authorities | Actual Spending |
|---|---|---|
| 166.08 | 167.85 | 153.76 |
| Planned | Actual | Difference |
|---|---|---|
| 24 | 30 | 6 |
| Expected Results |
Performance Indicators |
Targets | Performance Status |
|---|---|---|---|
| A supply of highly qualified people with leading-edge scientific and research skills for Canadian industry, government, and universities. | (1) Percentage of students supported that are actively employed in Canada after graduation. (2) Average completion rates among NSERC award recipients vs. general natural sciences and engineering (NSE) student population award recipients vs. general natural sciences and engineering (NSE) student population. |
(1) 75% (2) Completion rate 10% greater than general NSE student population |
(1) Exceeded - 82% of students supported were working in Canada 9 years after their award. More than half of those abroad were planning to come back to Canada. (2) Exceeded - The completion rate of NSERC award recipients was 17% higher than the general NSE population. 97% of respondents completed the degree (master's or doctoral) for which they received NSERC funding vs. the overall degree completion of 80%. |
| Program | Description | Expenditures 2010-11 ($ millions) |
|---|---|---|
| Undergraduate Student Research Awards | Held in university (3,254) or industry laboratories (875), this program provides funding for an undergraduate student to spend a four-month work term in a university or industrial research environment. | 18.5 |
| NSERC Postgraduate Scholarships | At the master's (269) and doctoral (1,599) levels, NSERC supports students by providing an annual stipend that enables them to continue to pursue their research interests. Up to four years of support is available over the course of a candidate's graduate studies. Opportunities for study at institutions in Canada and abroad as well as at Canadian industrial laboratories (555) are available. | 41.2 |
| Canada Graduate Scholarships (CGS) | Canada Graduate Scholarships (tenable only at Canadian universities) are awarded to the most outstanding candidates at the master's (1,033) and doctoral (1,115) levels. The CGS Michael Smith Foreign Study Supplements (57) allow CGS scholars to pursue short-term training outside the country. | 62.1 |
| NSERC Postdoctoral and Industrial R&D Fellowships | These two-year awards support researchers who have completed their doctoral programs, and provide them with funds to continue their programs of research. The awards may be held at any academic institution through a Postdoctoral Fellowship (526), or at a Canadian company that conducts research through an Industrial R&D Fellowship (225). | 21.7 |
Performance Summary and Analysis of Program Activity
In 2010-11, NSERC provided direct financial support to students from the undergraduate to postdoctoral levels, through key programs. NSERC also funds students and fellows indirectly through support provided by NSERC-funded professors from their NSERC grants.
All of NSERC's scholarship and fellowship programs are achieving their objectives and funded students are going on to well-paying and productive jobs in Canada. Almost all (97%) of NSERC-funded students complete their degree, and they do so at a much higher rate than unfunded students (80%).
Since its creation in 1978, NSERC has supported the training of nearly 95,000 master's and doctoral students in the NSE through programs such as the Industrial R&D Fellowships Program (IRDF) and the Undergraduate Student Research Award Program (USRA).
Industrial R&D Fellowships Program: A summative evaluation of the IRDF program covering the 8 year period from 2000-2008 was initiated in 2010-11. A summary of the preliminary file review is presented below:
|
Industrial R&D Fellowships Program |
|---|
|
Undergraduate Student Research Awards: A summative evaluation of the USRA program for the period covering 1999-2006 was also initiated in 2010-11. A preliminary summary of the survey findings is presented below:
|
Undergraduate Student Research Awards Surveys 1999-2006 |
|---|
|
NSERC conducts ongoing surveys of funded students at all levels. The table below highlights important achievements of NSERC-funded postgraduate students and fellows:
| Short-term Outcomes8 |
|---|
|
| Longer-term Outcomes9 |
|
| Short-term Outcomes8 |
|---|
|
| Longer-term Outcomes9 |
|
General macro-level economic outcomes for university graduates in the natural sciences and engineering provide evidence for the positive outcomes of NSERC-funded students.
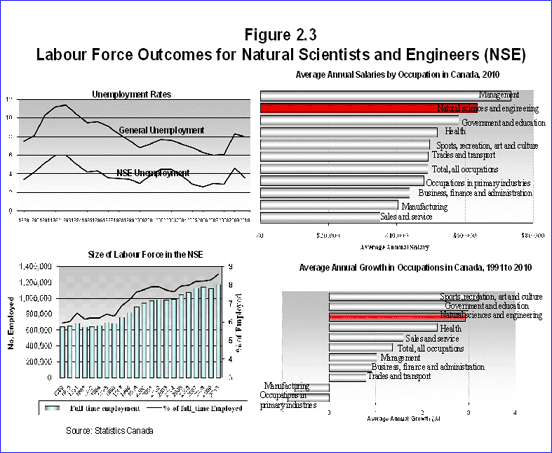
As Figures 2.3 below demonstrates, unemployment levels for job-seekers in the natural science or engineering occupations are considerably below national levels; annual salaries for this group are 30% greater than the national average for all occupations; and employment opportunities continue to grow as the natural science and engineering labour force is set to surpass the 1.1 million mark, resulting in the fastest growing occupational group over the past 20 years.
Labour Force Outcomes for Natural Scientists and Engineers (NSE)
Increasing women's participation in science and engineering: In November 2010, NSERC partnered with Engineers Canada and Research in Motion, to bring together leaders from academia, the private sector, policy makers and students at a Summit focused on maximizing opportunities for increasing women's participation in science and engineering. The Summit demonstrated a clear need for sustained efforts to foster women's participation in the natural sciences and engineering fields. It also allowed businesses, colleges and universities to share best practices aimed at attracting more women to careers in science and engineering and retaining those already in them.
Program Activity: Attract and Retain Faculty
Program Activity Description
This program activity aims to attract and retain faculty.
| Planned Spending | Total Authorities | Actual Spending |
|---|---|---|
| 175.78 | 173.40 | 161.12 |
| Planned | Actual | Difference |
|---|---|---|
| 11 | 10 | 1 |
| Expected Results |
Performance Indicators |
Targets | Performance Status |
|---|---|---|---|
| Enhanced research capacity in science and engineering | (1) Number of foreign-educated new applicants to NSERC's Discovery Grants program (2) Number of NSERC-funded professors leaving the country (3) Number of industrial partners supporting and participating in industrial chairs |
(1) Greater than 100 per year (2) Less than 100 per year (3) Five percent growth per year |
(1) Exceeded - In the year 2010-11, 107 new Discovery applicants were foreign-educated. Canada continues to attract faculty from abroad in large numbers (see Figures 2.4 and 2.5). (3) Somewhat Met – In 2010-11, there was a relative decline of 6%. However, the average growth has been 3.2% over the past ten years (see Figure 2.7). |
| Program | Description | Expenditures 2010-11 ($ millions) |
|---|---|---|
| Canada Research Chairs | This tri-agency (NSERC, CIHR and SSHRC) program provides financial support for up to 2,000 researchers across Canada, including 900 positions within the NSE. The key objectives of this program are to enable Canadian universities to achieve the highest levels of research excellence and to become world-class research centres in the global knowledge-based economy. | 117.5 |
| NSERC Industrial Research Chairs | NSERC's Industrial Research Chairs program helps universities build the critical mass of expertise and long-term relationships with corporate partners in areas of research that are of importance to industry. Industrial Research Chairs can also enhance the ability of universities to recruit senior-level researchers and research leaders from industry or other sectors. | 24.5 |
Performance Summary and Analysis of Program Activity
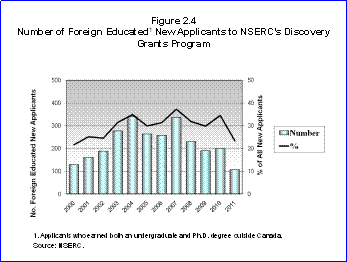
Figure 2.4 presents the number of new applicants to NSERC's largest program, the Discovery Grants program, who received both their bachelor's and doctoral degrees outside Canada- this number represents a good approximation of performance in terms of attracting leading faculty from abroad to Canada, since the vast majority of new professors in the natural sciences and engineering apply to the program.
Number of Foreign Educated New Applicants to NSERC's Discovery Grants Program
As Figure 2.4 indicates, Canadian universities have continued to attract hundreds of foreign educated personnel every year to become professors. On average, 30 percent of first-time NSERC applicants are foreign educated.
Canada Research Chairs: The Canada Research Chairs program has helped create a research environment that is conducive to the long-term retention and attraction of top researchers in Canada.
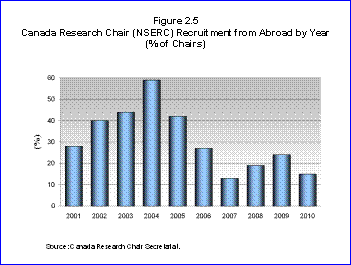
A significant number of Chair holders have been attracted from abroad and many top Canadian scientists have stayed in Canada as a result of Chair support. Figure 2.5 presents the percentage of foreign recruits awarded a Canada Research Chair in the natural sciences and engineering since the program's inception. (Note: fluctuations in Figure 2.5 are due to small cohorts in some years.)
Canada Research Chair (NSERC) Recruitment from Abroad by Year (% of Chairs)
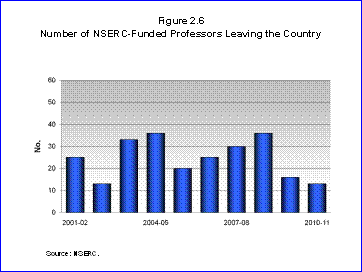
NSERC also tracks the reasons grantees provide when they terminate their awards before the end date. Only a small number of professors receiving NSERC support listed "leaving the country" as the reason for terminating their award over the past decade, as shown in Figure 2.6. The number of NSERC-funded professors leaving the country is an extremely small percentage of the nearly 12,000 professors receiving NSERC support each year and is much smaller than the number of new professors attracted to Canada each year. In 2010-11 this number was 13, compared to the more than 100 new professors recruited. (See Figures 2.4 and 2.5)
Number of NSERC-Funded Professors Leaving the Country
Recent investments by the government in university research have also created an attractive environment to conduct research in Canada for highly trained people from other countries. The new Canada Excellence Research Chairs and the Industrial Research Chairs are two examples of NSERC programs which serve to attract and retain leading Canadian and foreign educated researchers in Canada.
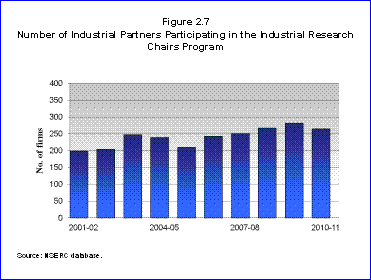
Industrial Research Chairs: The number of industrial partners participating in the Industrial Research Chairs program (IRC) is presented in Figure 2.7. The average annual growth in the number of partners over the past ten year period has been 3.2%, slightly below NSERC's target of 5%. There was a small decline in the number of partners in 2010-11, but it is too early to tell whether this represents a trend or whether it is related to normal fluctuations in the data.
The relative decline seen in industry participation in the IRC program during 2010-11 can be attributed to the lower demand seen for the program seen that year. This lower demand in turn, is likely linked to the trend of lower levels of industrial R&D spending, as measured by the weak BERD (Business Expenditures in R&D), and as noted by the Science, Technology and Innovation Council in their State of the Nation Report 201010.
Number of Industrial Partners Participating in the Industrial Research Chairs Program
A profile of one of the 2010-11 Industrial Research Chair recipients, Yusuf Altintas of the University of British Columbia, is presented below.
Yusuf Altintas –
NSERC/Pratt & Whitney Canada Industrial Research Chair in Virtual High-Performance Machining
Canadian manufacturers from different industry sectors are gaining a competitive edge with a new virtual cutting system that enables them to machine parts correctly, cost effectively and in the shortest amount of time.
The underlying technology was developed and commercialized in 1999 by Dr.Yusuf Altintas at University of British Columbia, with financial support from NSERC, Pratt and Whitney Canada (P&WC), Boeing and General Motors. Canadian companies were the first to exploit the machining technology, which companies from around the world have now begun licensing and which could become the norm over the next five to ten years.
In 2002, NSERC and P&WC provided funding to establish an Industrial Research Chair in Virtual High-Performance Machining, led by Dr. Altintas, who is developing a system that can mathematically model and optimize machining processes. The current approach used in industry involves costly and time-consuming trials. With the Chair's virtual machining system, operators are able to produce more repeatable and consistent results.
Another initiative, the Canadian Network for Research and Innovation in Machining Technology, was launched in 2010. The network was established with funding from NSERC and P&WC and brings together eight large and smaller manufacturers, seven universities and two federal government departments.
The Chair is one of the world's foremost experts in the field of virtual machining and has trained over 130 post graduate students over the past 25 years.
Canada Excellence Research Chairs: The Canada Excellence Research Chairs Program is a tri-agency initiative established in 2008 to attract Canadian and international leading researchers who can positively contribute to Canada's global competitiveness. The Chairs' research focuses on the federal government's priority research areas. In May 2010, the first group of Canada Excellence Research Chairs was announced. A profile of Dr.Ali Emad, Canada Excellence Research Chair in Hybrid Powertrain at McMaster University, is presented below.
Ali Emadi –
Canada Excellence Research Chair in Hybrid Powertrain – McMaster University
The automotive industry is currently undergoing a major paradigm shift. Engineers around the world are competing to build the next generation of cost-effective, energy-efficient cars. Plug-in hybrid vehicles are at the forefront of this shift and are expected to become one of the main forms of transportation in Canada and across the globe by 2030.
One of the keys to engineering the next generation of hybrid electric cars will be improving their powertrain, which transmits propulsion power. Dr. Ali Emadi is at the leading edge of new developments in transportation electrification. He is internationally recognized for his in-depth research on hybrid electric vehicle powertrains and electric drives.
Prior to his appointment in Canada, Emadi was a Professor of Engineering and director of the Electric Power and Power Electronics Centre at the Illinois Institute of Technology. He also founded and served as president of spin-off company Hybrid Electric Vehicle Technologies, Inc. He has been awarded several patents, including one for his design of the digitally controlled electric motor—an energy-efficient motor available to manufacturers of everyday appliances at a lower cost than earlier versions of electric motors. Emadi's research provides solutions that meet the current demands of the Canadian automotive sector, helping Canada's economy grow and remain globally competitive with a strong position in the green energy economy.
Strategic Outcome Discovery: High quality Canadian-based competitive research in the natural sciences and engineering
NSERC promotes and enables global excellence in discovery research. Basic research provides the foundation for all scientific and technological advances, and to train the people who will generate new knowledge in Canada and who can understand the new knowledge generated around the world. Having a solid capacity for basic research across a broad range of fields in natural sciences and engineering and in rapidly evolving fields, such as Information and Communication Technologies, ensures that Canada remains a leader in knowledge creation and competitive on the world stage.
One of the first tangible outcomes of an investment in university R&D is a publication in a scientific or engineering journal. Nearly 90% of Canada's scientific and engineering publications are produced by university researchers. Therefore, publications are a good indicator of outcomes from NSERC research funding and can be used to benchmark our performance against the rest of the world.
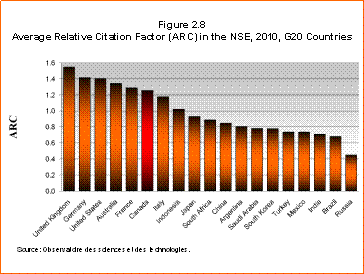
Citations are a measure of the potential use of a researcher's work by fellow researchers. Based on the number of citations received by papers over the three years following the publication year, a standardized measure called the Average Relative Citation Factor (ARC) is calculated for each country. The world average is then normalized to a value of 1.0. Figure 2.8 presents the ARC values in the natural sciences and engineering (NSE) for G20 countries. In 2010-11, Canada maintained its 6th ARC ranking in the NSE amongst the G20.
Average Relative Citation Factor (ARC) in the NSE, 2010, G20 Countries
Program Activity: Fund Basic Research
Program Activity Description
This program activity invests in discovery through grants focusing on basic research activities.
| Planned Spending | Total Authorities | Actual Spending |
|---|---|---|
| 356.43 | 357.92 | 369.06 |
| Planned | Actual | Difference |
|---|---|---|
| 53 | 53 | 0 |
| Expected Results |
Performance Indicators |
Targets | Performance Status |
|---|---|---|---|
| The discovery, innovation and training capability of university researchers in natural sciences and engineering is enhanced by the provision of support for ongoing programs of basic research | (1) World ranking in number of publications (2) Percentage of funds spent on training of students and postdoctoral fellows (3) Higher education expenditure on R&D (HERD) as a percentage of gross domestic product (GDP) compared to G8 countries |
(1) Maintain top 10 world ranking (Canada was 7th in 2005) (2) 35 percent (3) Maintain current world ranking (Canada was first in 2007 among G8 countries) |
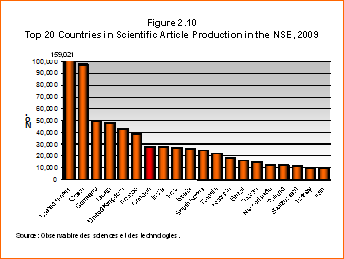
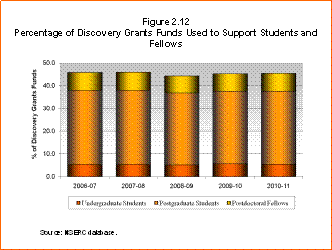
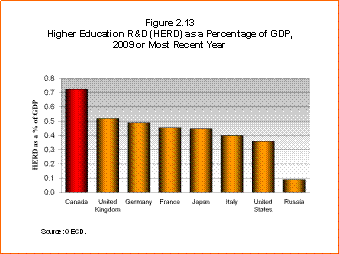
(1) Met All - Canada is within the top 10 world rankings. It has maintained its 7th place world ranking in publication production (see Figure 2.10). (2) Exceeded - In 2010-11, 45.2% of Discovery Grants funds were used to support students and fellows (see Figure 2.12). (3) Met All - In 2010-11, Canada stayed in 1st place in the HERD ranking as a % of GDP in the G8 (see Figure 2.13). |
| Program | Description | Expenditures 2010-11 ($ millions) |
|---|---|---|
| Discovery Grants | The Discovery Grants program is the mainstay of support for university-based research. The program provides funding for ongoing programs of research. Researchers are free to work in the mode most appropriate for the research area and they may pursue new research interests provided they are within NSERC's mandate. To be funded, they must demonstrate both research excellence and high productivity, and contributions to the training of highly qualified people. | 345.0 |
Performance Summary and Analysis of Program Activity
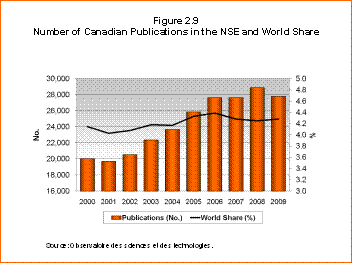
Canada is among an elite group of countries publishing a significant number of articles in science and engineering journals. Since the beginning of the century, Canadian researchers (all sectors) in NSE have increased their annual production of publications from roughly 20,000 per year to current averages of approximately 28,000 publications per year, as shown in Figure 2.9.
Overall, Canada's world share of NSE papers stood at 4.3% in 2009, ranking seventh in the world (see Figure 2.10).
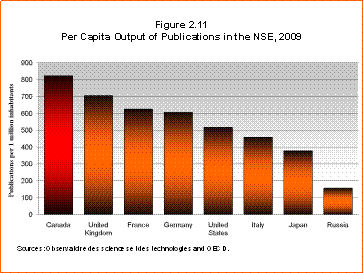
Another indicator of productivity related to scientific publication production is a measure of a country's output of NSE publications per capita population. Figure 2.11 presents the 2009 per capita output per one million inhabitants for the G8. Using this criterion, Canada has the highest per capita output.
Number of Canadian Publications in the NSE and World Share
Top 20 Countries in Scientific Article Production in the NSE, 2009
Per Capita Output of Publications in the NSE, 2009, G8 Countries
Discovery Grants: Each year, over 45% of the Discovery Grants program expenditures are used by professors to support students at the undergraduate, masters, doctoral levels and postdoctoral fellows (see Figure 2.12). In 2010-11, 10,800 students and fellows were supported by Discovery Grants funding.
When measured as a percentage of GDP, Canada spends more on university research than all of its G8 competitors (see Figure 2.13).
Percentage of Discovery Grants Funds Used to Support Students and Fellows
Higher Education R & D (HERD) as a Percentage of GDP, 2009 or Most Recent Year
Program Activity: Support for Research Equipment and Major Resources
Program Activity Description
This program activity helps to support the establishment, maintenance and operation of the research equipment, major research resources and research capacity necessary to carry out high quality research in the natural sciences and engineering.
| Planned Spending | Total Authorities | Actual Spending |
|---|---|---|
| 38.49 | 44.94 | 71.04 |
| Planned | Actual | Difference |
|---|---|---|
| 10 | 10 | 0 |
| Expected Results |
Performance Indicators |
Targets | Performance Status |
|---|---|---|---|
| The discovery, innovation and training capability of university researchers in the natural sciences and engineering is supported by their access to research equipment and major regional or national research facilities | (1) Average number of researchers benefiting from equipment awards. (2) Average number of researchers benefiting from a Major Research Support (MRS) Award. |
(1) Over 1500 (2) Greater than 10 |
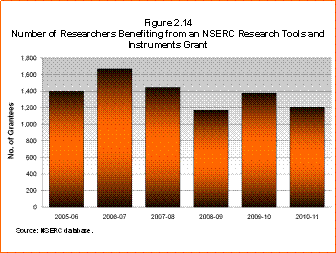
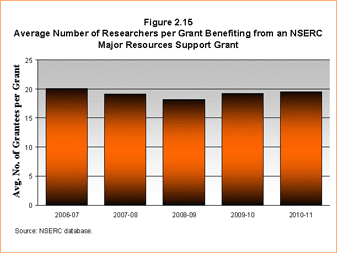
(1) Mostly Met - In 2010-11, 1,206 researchers benefited from an NSERC Research Tools and Instruments (RTI) grant (see Figure 2.14). (2) Met All - In 2010-11, NSERC supported an average of 20 researchers per MRS award (see Figure 2.15). |
| Program | Description | Expenditures 2010-11 ($ millions) |
|---|---|---|
| Major Resources Support | The MRS program supports researchers' access to major regional or national research facilities by assisting these facilities to remain in a state of readiness for researchers to use. This program is the vehicle for NSERC investments in facilities such as the Canadian Light Source synchrotron in Saskatoon. | 38.1 |
| Research Tools and Instruments Grants | Canada Foundation for Innovation funding enhances the laboratory setting by funding major equipment and infrastructure purchases. RTI grants enable professors to purchase the smaller pieces of laboratory equipment necessary to conduct world-class research. This critical source of funding ensures researchers have access to the modern research tools required to ensure the maximum return on other investments in research, such as Discovery Grants. | 31.9 |
Performance Summary and Analysis of Program Activity
It is difficult for researchers to find funding for small equipment and NSERC is a major source. NSERC’s Research Tools and Instruments funding provides necessary equipment that leads, in general, to more, faster and more in-depth research as well as better trained students. These impacts are felt across the spectrum of disciplines, in all regions and in large and small institutions.
Research Tools and Instruments: Figure 2.14 highlights the number of researchers benefiting from an NSERC RTI grant. The slight drop in the number of researchers benefiting from an RTI grant, relative to 2009-10 numbers, is attributable to a decrease in the budget available for the program in 2010-11.
Number of Researchers Benefiting from an NSERC Research Tools and Instruments Grant
Major Resources Support: The Major Resources Support (MRS) program leads to a better use of the funded facilities, increased collaboration among researchers and improved international competitiveness of Canadian researchers. The program also complements CFI funding for several facilities, such as the Canadian Light Source Synchrotron, by providing the necessary operating and maintenance support to fully utilize the facilities. Figure 2.15 presents the average number of researchers benefiting from an MRS award. The average value has been fairly steady over the past five years.
Average Number of Researchers per Grant Benefiting from an NSERC Major Resources Support Grant
Canadian Light Synchrotron: The text box below highlights one of the major facilities supported by the MRS program:
Canadian Light Source Synchrotron (CLS)
Located at the University of Saskatchewan, the CLS generates brilliant beams of light that allow researchers to observe matter down to the atomic level. The facility is one of the most advanced synchrotron facilities in the world.
Research carried out at the CLS has applications in a wide range of fields that are important to Canadian science and industrial research and development. These applications range from the development of advanced materials, to biomedical devices, to the detection of environmental pollutants. Use of the CLS by industry promotes Canada's competitiveness in sectors such as environmental remediation, natural resource utilization, energy, pharmaceuticals, novel materials and nanotechnology. The CLS serves to attract the best academic scientists from all over the world to Canada, while providing a unique training environment for the next generation of Canadian researchers.
Through the Major Resources Support Program, NSERC continues to invest in one of Canada's largest and most important research facilities by helping it expand its operational capacity.
Strategic Outcome Innovation: Productive use of new knowledge in the natural sciences and engineering
NSERC aims to maximize the value of public investments in research for the benefit of all Canadians by promoting the translation of research discoveries into new goods, services and technologies through academic-industry partnerships and training people with the required scientific and business skill sets. Highly skilled, knowledgeable and creative workers are the foundation of an innovative economy.
NSERC also provides Canadian-based companies access to the special knowledge, expertise and educational resources at Canadian postsecondary institutions and offers opportunities for mutually beneficial collaborations that result in industrial or economic benefits to Canada. The industrial partners contribute financially to university research projects, scholarships and fellowships.
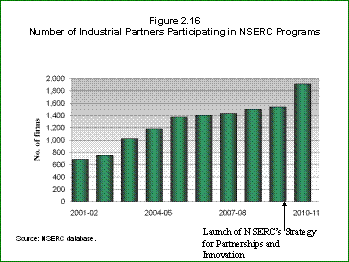
In 2010-11, 1,913 firms partnered with NSERC, nearly 400 more than in the previous year (see Figure 2.16). This increase in the number of industrial partners participating in NSERC programs is a result of the implementation of NSERC's Strategy for Partnerships and Innovation. Sixty of the top 100 R&D firms in Canada are currently partners with NSERC.
Number of Industrial Partners Participating in NSERC Programs
Program Activity: Fund Research in Strategic Areas
Program Activity Description
This program activity funds research projects of national importance and in emerging areas that are of potential significance to Canada.
| Planned Spending | Total Authorities | Actual Spending |
|---|---|---|
| 134.00 | 134.08 | 108.14 |
| Planned | Actual | Difference |
|---|---|---|
| 22 | 21 | 1 |
| Expected Results |
Performance Indicators |
Targets | Performance Status |
|---|---|---|---|
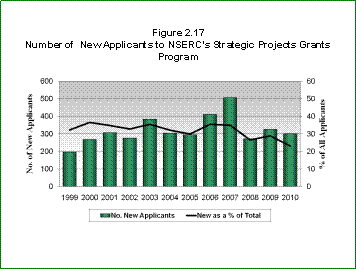
| Research and training in targeted and emerging areas of national importance is accelerated | Percentage of researchers applying for a strategic grant for the first time (or who have never applied in a specific area) | 5% | Exceeded - In 2010-11, 23% of applicants in the Strategic Project competition were new (see Figure 2.17). |
| Program | Description | Expenditures 2010-11 ($ millions) |
|---|---|---|
| Strategic Project Grants | This program accelerates research and training in targeted and emerging areas of national importance. The research is early-stage with the potential to lead to breakthrough discoveries. The program target areas coincide with the government's current priority areas of the environment, energy, information and communications technologies, manufacturing, automotive applications, forestry, fisheries, and health. | 57.3 |
| Strategic Network Grants | This program funds large scale, complex research programs that involve multi-sectoral collaborations on a common research topic. The topic to be investigated can be of local concern, requiring a focused local network, or of regional or national importance, requiring a larger, more complex network. | 33.5 |
Performance Summary and Analysis of Program Activity
The Strategic Partnerships Programs are designed to focus on NSERC Strategic Target Areas and provide an excellent framework to implement the Federal S&T Strategy.
In 2010-11, a total of $39.0M was leveraged from partners in Strategic Partnership grants in addition to NSERC's funding of $90.8M.The resulting leverage ratio of 43% indicates excellent partner participation. Four hundred industrial partners participated in these programs in 2010-11.
Strategic Projects: An important component of the Strategic Projects program is creating new partnerships between professors and industrial/government partners to facilitate the knowledge and technology transfer process in priority areas. Figure 2.17 presents the number of researchers who have applied for a Strategic Project grant for the first time.
Number of New Applicants to NSERC's Strategic Projects Grants Program
Program Activity: Fund University-Industry-Government Partnerships
Program Activity Description
This program activity fosters collaborations between university researchers and other sectors, including government and industry, in order to develop new knowledge and expertise, and to transfer this knowledge and expertise to Canadian-based organizations.
| Planned Spending | Total Authorities | Actual Spending |
|---|---|---|
| 107.57 | 113.10 | 122.03 |
| Planned | Actual | Difference |
|---|---|---|
| 47 | 60 | 13 |
| Expected Results |
Performance Indicators |
Targets | Performance Status |
|---|---|---|---|
| Mutually beneficial collaborations between the private sector and researchers in universities, resulting in industrial or economic benefits to Canada. | (1) Increase in the number of industrial partners supporting and participating in university-industry collaborations (2) Partner satisfaction with research results |
(1) Greater than five percent per year (2) 75 percent of partners indicating satisfaction |
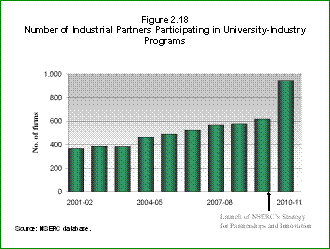
(1) Exceeded – There was a 58% relative increase in the number of industrial partners participating in university-industry collaborations in 2010-11 (Figure 2.18). The average annual growth rate over the past ten years in industrial partner participation has also remained steady at 11%. (2) Exceeded- Post award surveys indicate that over three-quarters (75%) of partners are extremely satisfied with their collaboration with university researchers and students. |
| Program | Description | Expenditures 2010-11 ($ millions) |
|---|---|---|
| Collaborative Research and Development Grants | This program gives companies operating from a Canadian base access to the unique knowledge, expertise and educational resources available at Canadian postsecondary institutions and offers opportunities for mutually beneficial collaborations that result in industrial or economic benefits to Canada. | 55.5 |
| Networks of Centres of Excellence | The Networks of Centres of Excellence (including the Business-Led Networks) are unique partnerships among universities, industry, government and not-for-profit organizations aimed at turning Canadian research and entrepreneurial talent into economic and social benefits for all Canadians. These nationwide, multidisciplinary and multi-sectoral research partnerships connect excellent research with industrial know-how and strategic investment. They create a critical mass of research capacity by networking researchers and partners across Canada. | 48.3 |
Performance Summary and Analysis of Program Activity
Programs such as the Collaborative Research and Development (CRD) and Engage Grants (EG) give Canadian companies access to the unique knowledge and expertise available at Canadian universities and train students in essential technical skills required by industry. The number of industrial partners participating in these programs grew an impressive 58% since the launch of NSERC's Strategy for Partnerships and Innovation, and has grown by an average of 11% per year over the past decade (see Figure 2.18).
Number of Industrial Partners Participating in University-Industry Programs
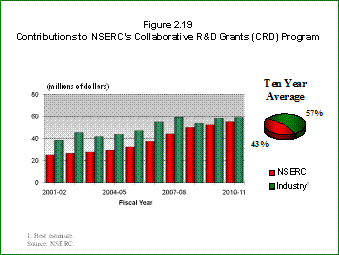
Collaborative R&D Grants- Industry participation: Industrial contributions related to the CRD Grants are an important indicator of the value NSERC's partners place on university research. A comparison of NSERC funding and industry contributions to the CRD program is presented in Figure 2.19. NSERC's industrial partners contribute more to the CRD projects than NSERC. The ten year average of industry contributions to the CRD program is 57%, whereas NSERC contributions have been 43%.
Contributions to NSERC's Collaborative R&D Grants (CRD) Program
Engage Grants: The purpose of the EG Program is to foster the development of a new relationship between a company and the academic researcher. Results from end of grant reports (see below) show that more than half of participating companies plan future collaborations with their academic partners, and 94% of companies have gained new knowledge or developed new technologies as a result of their EG partnership. Most companies (90%) use or plan to use the new knowledge acquired through the partnership. By building better links between researchers and businesses, NSERC is helping accelerate the translation of knowledge into practical applications.
|
Engage Grants Program |
|---|
|
Companies that participated in the Engage Grants Program reported the following outcomes as a result of collaborative R&D projects undertaken with their academic partner:
|
Program Activity: Support Commercialization
Program Activity Description
This program activity supports innovation and promotes the transfer of knowledge and technology to Canadian companies.
| Planned Spending | Total Authorities | Actual Spending |
|---|---|---|
| 40.60 | 54.34 | 53.11 |
| Planned | Actual | Difference |
|---|---|---|
| 18 | 17 | 1 |
| Expected Results |
Performance Indicators |
Targets | Performance Status |
|---|---|---|---|
| The transfer of knowledge and technology residing in Canadian universities and colleges to the user sector is facilitated | Increase in technology and knowledge transfer activities | Five percent growth per year | Exceeded - For the eight years of data available (see Figure 2.21) the average annual growth rates for university commercialization indicators have exceeded 5% except for the number of inventions protected and patents issued. |
| Program | Description | Expenditures 2010-11 $ millions) |
|---|---|---|
| Centres of Excellence for Commercialization & Research | The program funds world-class centres to advance research and facilitate commercialization of technologies, products and services. These centres operate in the priority areas of the S&T Strategy: information and communications technology, environment, energy and natural resources, and health. | 17.4 |
| College and Community Innovation Program | The objective of the CCIP is to increase innovation at the community and/or regional level by enabling Canadian colleges to increase their capacity to work with local companies, particularly small and medium-sized enterprises. It supports applied research and collaborations that facilitate commercialization, as well as technology transfer, adaptation and adoption of new technologies. | 28.0 |
| Idea to Innovation (I2I) Program | I2I accelerates the pre-competitive development of promising technologies and promotes its transfer to Canadian companies. The program supports R&D projects with recognized technology- transfer potential by providing crucial assistance to university researchers in the early stages of technology validation and market connection. | 5.7 |
Performance Summary and Analysis of Program Activity
Every year, Statistics Canada conducts a survey of intellectual property commercialization in the university sector, which indicates performance in technology and knowledge transfer activities in Canada. It is highly likely that the majority of the commercialization indicators presented in this survey are attributable to overall NSERC funding. In the period from 1999 to 2008, most commercialization activities at Canadian universities have increased. (Figure 2.20)
Figure 2-20
| Commercialization Activity | 1999 | 2001 | 2003 | 2004 | 2005 | 2006 | 2007 | 2008 |
|---|---|---|---|---|---|---|---|---|
| Inventions disclosed | 829 | 1,105 | 1,133 | 1,432 |
1,452 |
1,356 | 1,357 | 1,613 |
| Inventions protected | 509 | 682 | 597 | 629 | 761 | 707 | 668 | 820 |
| New patent applications | 616 | 932 | 1,252 | 1,264 | 1,410 | 1,442 | 1,634 | 1,791 |
| Patents issued | 325 | 381 | 347 | 397 | 374 | 339 | 479 | 346 |
| Total patents held | 1,826 | 2,133 | 3,047 | 3,827 | 3,961 | 4,784 | 4,185 | 5,908 |
| New licences | 218 | 320 | 422 | 494 | 621 | 437 | 538 | 524 |
| Total active licences | 1,109 | 1,338 | 1,756 | 2,022 | 2,836 | 2,038 | 2,679 | 3,343 |
| Royalties from licensing ($M) | $18.9 | $52.5 | $55.5 | $51.2 | $55.2 | $59.7 | $52.5 | $53.2 |
| Total spin-off companies | 454 | 680 | 876 | 968 | 1,027 | 1,103 | 1,174 | 1,242 |
Source: Statistics Canada
College and Community Innovation Program: Recent government investment for expanding the innovation capacity of colleges by building bridges between colleges and industry is already showing promising results. NSERC supports commercialization in colleges with key programs such as the College and Community Innovation Program (CCIP). Key findings from a 2010-11 file review of the 18-month progress on the Innovation Enhancement Grants element of the CCIP are presented below.
|
College and Community Innovation Program- Innovation Enhancement Grants |
|---|
|
Program Activity: Internal Services
Program Activity Description
Internal Services are groups of related activities and resources that are administered to support the needs of programs and other corporate obligations of NSERC. These groups are: Management and Oversight Services; Communications Services; Legal Services; Human Resources Management Services; Financial Management Services; Information Management Services; Information Technology Services; Real Property Services; Materiel Services; Acquisition Services; and Travel and Other Administrative Services. Internal Services include only those activities and resources that apply across all of NSERC.
| Planned Spending | Total Authorities | Actual Spending |
|---|---|---|
| 26.08 | 28.51 | 25.75 |
| Planned | Actual | Difference |
|---|---|---|
| 186 | 170 | 16 |
Performance Summary and Analysis of Program Activity
NSERC's corporate strategic action plan is updated every year and presented for approval by Council. Once approved by Council, NSERC's corporate strategic action plan serves as the framework by which NSERC manages and oversees the effective planning and delivery of NSERC's operations and resources.
Currently, NSERC is developing an integrated planning cycle to improve the alignment of corporate priorities and resource allocations and to incorporate risk management. It is also developing a comprehensive corporate plan to support the MAF.

