ARCHIVED - Fisheries and Oceans Canada - Report
 This page has been archived.
Archived Content
Information identified as archived on the Web is for reference, research or recordkeeping purposes. It has not been altered or updated after the date of archiving. Web pages that are archived on the Web are not subject to the Government of Canada Web Standards. As per the Communications Policy of the Government of Canada, you can request alternate formats on the "Contact Us" page.
2010-11
Departmental Performance Report
Fisheries and Oceans Canada
The original version was signed by
The Honourable Keith Ashfield, P.C., M.P.
Minister of Fisheries and Oceans
Table of Contents
Section I: Organizational Overview
- Raison d’�tre
- Responsibilities
- Program Activity Architecture (PAA)
- Organizational Priorities
- Risk Analysis
- Summary of Performance
- Expenditure Profile
- Estimates by Vote
Section II: Analysis of Program Activities by Strategic Outcome
- Strategic Outcome #1 - Safe and Accessible Waterways
- Strategic Outcome #2 - Sustainable Fisheries and Aquaculture
- Strategic Outcome #3 - Healthy and Productive Aquatic Ecosystems
- Internal Services
Section III: Supplementary Information
Section IV: Other Items of Interest
Minister's Message

It is my pleasure to present the 2010-11 Departmental Performance Report for Fisheries and Oceans Canada.
Our Department, including the Canadian Coast Guard, which is a Special Operating Agency within Fisheries and Oceans Canada, has again proven to be a leader in the management of oceans and freshwater resources, as well as in the crucial area of marine safety.
We continued to implement Canada's Economic Action Plan, using funding to finance vital fisheries and marine infrastructure, and provide support for coastal communities affected by the economic downturn.
In 2010-11, we focused on several areas to achieve our three strategic outcomes:
- Safe and accessible waterways;
- Sustainable fisheries and aquaculture; and
- Healthy and productive aquatic ecosystems.
Improving the Economic Viability of Canada's Fisheries
Sustainable fisheries and aquaculture make a significant contribution to Canada's economy. An estimated 80,000 Canadians make their living directly from fishing and related activities, and seafood is one of our largest commodity exports. Last year, our sales abroad totalled more than $3.9 billion. Our objective is to ensure Canada remains a world leader in sustainable fish and seafood products.
We continued to work closely with industry stakeholders to help them obtain the certification needed to expand access to markets, maintained our emphasis on conservation and sustainable management of fisheries and the enforcement of regulations, and invested substantially in aquaculture innovation.
Enhancing Marine Safety and Security through Fleet Renewal
The Canadian Coast Guard carries out critical work in support of Canada's commercial fishing industry, maritime transportation, and national sovereignty. This requires a well-equipped and adaptable fleet of vessels. Our Department continued fleet renewal for the Canadian Coast Guard, acquiring 81 new small boats. To support our government's commitment to security and sovereignty under the Northern Strategy, a new polar icebreaker will be delivered in 2017.
Our Department's Canadian Hydrographic Service continued its work surveying Canadian waters and producing and updating hydrographic products and services to ensure safe navigation of Canadian waterways. This work supports national security, emergency preparedness, and the establishment of Canada's offshore boundaries.
We repaired or undertook maintenance projects at more than 200 core fishing harbours and completed the majority of phase one construction work for a small craft harbour in Pangnirtung, Nunavut.
Ensuring Sustainable Development of our Fisheries and Oceans
To help ensure sustainable development of our fisheries and oceans, we continued to focus on habitat management. Our Department is creating new oceans centres of expertise to broaden our knowledge of Canada's waters. We continued to expand our network of Marine Protected Areas and develop strategies to monitor our Arctic boundary waters.
We also continued to support the work of the Commission of Inquiry into the Decline of Sockeye Salmon in the Fraser River to determine what can be done to restore and conserve the stock.
Improving our Effectiveness through Collaboration
We recognize that collaboration is the key to improving our effectiveness as a department.
By working with the provinces and territories, advisory groups, and the public, we will build strong, sustainable fisheries and maritime sectors for future generations.
The Honourable Keith Ashfield, P.C., M.P.
Minister of Fisheries and Oceans
Section I: Organizational Overview
Raison d’�tre
Fisheries and Oceans Canada (DFO) plays the lead role in managing Canada's fisheries and safeguarding its waters, ensuring safe, healthy, and productive waters and aquatic ecosystems for the benefit of present and future generations. The Department's work is built around three strategic outcomes:
Safe and Accessible Waterways
- Providing access to Canadian waterways and ensuring the overall safety and integrity of Canada's marine infrastructure for the benefit of all Canadians;
Sustainable Fisheries and Aquaculture
- Delivering an integrated fisheries and aquaculture program that is credible, science-based, affordable, and effective and contributes to sustainable wealth for Canadians while respecting Aboriginal and treaty rights; and
Healthy and Productive Aquatic Ecosystems
- Ensuring the sustainable development and integrated management of resources in or around Canada's aquatic environment and carrying out critical science and fisheries management activities.
Our Vision
Excellence in service to Canadians to ensure the sustainable development and safe use of Canadian waters.
Responsibilities
DFO is responsible for developing and implementing policies and programs in support of Canada's scientific, ecological, social, and economic interests in oceans and fresh waters.
DFO is a national and international leader in marine safety and in the management of oceans and freshwater resources. Departmental activities and presence on Canadian waters help to ensure the safe movement of people and goods. As a sustainable development department, DFO integrates environmental, economic and social perspectives to ensure Canada's oceans and freshwater resources benefit this generation and those to come.
The Canadian Coast Guard (CCG), a Special Operating Agency within DFO, is responsible for services and programs that contribute to the safety, security, and accessibility of Canada's waterways. CCG supports other government organizations through the provision of a civilian fleet and a broadly distributed shore-based infrastructure.
The Oceans Act entrusts the Minister with leading integrated oceans management and providing coast guard and hydrographic services, while the Fisheries Act gives the Minister responsibility for the management of fisheries, habitat, and aquaculture. The Species at Risk Act gives the Minister responsibilities associated with the management of aquatic species at risk.
Organization
Fisheries and Oceans Canada is a highly decentralized department, with more than eight of every ten employees located outside national headquarters. National headquarters, in Ottawa, establish national objectives, policies, procedures, and standards for the Department and CCG.
Information about DFO's six regions and the Canadian Coast Guard is available at http://www.dfo-mpo.gc.ca/dpr-rmr/2010-11/toc-tdm-eng.html. A diagram of DFO's organizational structure is available at http://www.dfo-mpo.gc.ca/us-nous/organisation-eng.htm.
Program Activity Architecture (PAA)
The Government of Canada's Management, Resources and Results Structure1 (MRRS) is the foundation of a common, government-wide approach to the collection, management, and reporting of financial and non-financial information. DFO's Program Activity Architecture (PAA) is a component of its MRRS and shows how DFO's programs align with the Department's three strategic outcomes.
Each program activity is linked to a single Government of Canada Outcome Area (as indicated in the figure that follows), permitting whole-of-government reporting. The Whole-of-Government Framework maps the financial and non-financial contributions of federal organizations receiving appropriations, by aligning their program activities to a set of high-level outcome areas defined for the government as a whole (additional information on the Whole-of-Government Framework is available at http://www.tbs-sct.gc.ca/ppg-cpr/frame-cadre-eng.aspx).
The PAA also includes a stand-alone program activity called Internal Services, defined as the activities and resources that support an organization's program needs and other corporate obligations. For more information on DFO's Internal Services, see Internal Services.
DFO'S Program Activity Architecture for 2010-11

Organizational Priorities
DFO focused on a number of priorities in 2010-11. Descriptions and key plans for each of the priorities can be found in the 2010-11 Report on Plans and Priorities.2 Key accomplishments are presented below, and an overall performance rating has been assigned to each priority based on the following:
| If this percentage of expected performance is achieved… | The performance rating is defined as… | The performance rating is shown graphically as… |
|---|---|---|
| More than 100% | Exceeded |  |
| 100% | Met All |  |
| 80 to 99% | Mostly Met |  |
| 60 to 79% | Somewhat Met |  |
| Less than 60% | Not Met |  |
Globally Competitive FisheriesContributing to …• Sustainable Fisheries and Aquaculture |
Performance Rating: |
|---|---|
| Priority Type3: Ongoing | |
Key Accomplishments
|
|
Health of the OceansContributing to …• Healthy and Productive Aquatic Ecosystems |
Performance Rating: |
|---|---|
| Priority Type: Previously committed to | |
Key Accomplishments
|
|
Fleet RenewalContributing to …• Safe and Accessible Waterways • Sustainable Fisheries and Aquaculture • Healthy and Productive Aquatic Ecosystems |
Performance Rating: |
|---|---|
| Priority Type: Ongoing | |
Key Accomplishments
|
|
Economic Action PlanContributing to …• Safe and Accessible Waterways • Sustainable Fisheries and Aquaculture • Healthy and Productive Aquatic Ecosystems |
Performance Rating: |
|---|---|
| Priority Type: New | |
Key Accomplishments
|
|
International LeadershipContributing to …• Safe and Accessible Waterways • Sustainable Fisheries and Aquaculture • Healthy and Productive Aquatic Ecosystems |
Performance Rating: |
|---|---|
| Priority Type: Ongoing | |
Key Accomplishments
|
|
Northern StrategyContributing to …• Safe and Accessible Waterways • Sustainable Fisheries and Aquaculture • Healthy and Productive Aquatic Ecosystems |
Performance Rating: |
|---|---|
| Priority Type: Previously committed to | |
Key Accomplishments
|
|
Regulatory Improvement (Streamlining)Contributing to …• Healthy and Productive Aquatic Ecosystems |
Performance Rating: |
|---|---|
| Priority Type: Revised | |
Key Accomplishments
|
|
Implementing e-Navigation in CanadaContributing to …• Safe and Accessible Waterways |
Performance Rating: |
|---|---|
| Priority Type: New | |
Key Accomplishments
|
|
People ManagementContributing to …• Safe and Accessible Waterways • Sustainable Fisheries and Aquaculture • Healthy and Productive Aquatic Ecosystems |
Performance Rating: |
|---|---|
| Priority Type: Ongoing | |
Key Accomplishments
|
|
Asset ManagementContributing to …• Safe and Accessible Waterways • Sustainable Fisheries and Aquaculture • Healthy and Productive Aquatic Ecosystems |
Performance Rating: |
|---|---|
| Priority Type: Previously committed to | |
Key Accomplishments
|
|
Information ManagementContributing to …• Safe and Accessible Waterways • Sustainable Fisheries and Aquaculture • Healthy and Productive Aquatic Ecosystems |
Performance Rating: |
|---|---|
| Priority Type: Previously committed to | |
Key Accomplishments
|
|
Risk Analysis
With continued support from senior management, the Department advanced its efforts to integrate risk management into decision-making processes and business practices at both the program and corporate levels during 2010-11.
2010-11 Accomplishments
Corporate Risk Governance
- A new governance structure was established where Directors General were designated Offices of Primary Interest for managing corporate risks.
- An advocate at the Assistant Deputy Minister level was named to serve alongside the Chief Financial Officer as a senior management mentor for the risk management function.
- The Departmental Legal Risk Management Committee was created in line with Treasury Board Secretariat's inter-departmental legal risk management initiative.
Risk Management Activity
- The Corporate Risk Profile (CRP) went through its first complete review, at both mid-year and year-end. The mid-year review on the status of controls of corporate risks was completed and presented to the Departmental Audit Committee in January 2011.
- Risk management was integrated into the departmental business planning process for 2011-12. This was the first time that business plans, including the identification of risks and risk mitigation strategies, were prepared for program activities using the Program Activity Architecture. In the past, business plans were prepared for each sector and region. This was also the first time that risks associated with investment plan projects were included in business plans.
- Risk profiles for nine program activities (as indicated in the 2011-12 Report on Plans and Priorities13) were completed over the course of the year.
- The risk management framework for the Department's Economic Action Plan continued to be implemented, and advice and consultation were provided on risk identification, mitigation and reporting.
Training and Communications
- A full-day Integrated Risk Management (IRM) workshop was held by the Departmental Management and Departmental Audit Committees to discuss the future direction of IRM.
- Information and training plenary sessions were held for Directors General to discuss their roles and responsibilities in regard to IRM.
- A two-day training session was held for the IRM Co-ordinators Network with participation from all sectors and regions.
While both the IRM processes and the corporate risk deliverables have improved from previous years, there is a need for further enhancement and refinement, in particular, for tracking and monitoring risks and for identifying how risk management affects performance.
Departmental Corporate Risks for 2010-11
At the beginning of the year, the Department identified eight horizontal corporate risks (see table below) that may have affected DFO's ability to deliver its outcomes, had they materialized.
From the risks identified, the Physical Infrastructure risk was noted as showing the greatest potential severity to the organization. Both the mid-year and year-end reviews attested that this risk materialized during the year and affected several programs. Three other notable risks were identified as having materialized during the year: Legal and Compliance, Human Capital, and Information for Decision-making.
All four risks have now been transferred to the Corporate Risk Profile for 2011-12. Mitigation actions undertaken to counter these risks include the establishment of a new Real Property Task Force and the revamped Investment Planning strategy (for Physical Infrastructure), Legal Risk Management Committee (for Legal and Compliance), national Human Resources Strategy (for Human Capital) and the Information Management Strategy (for Information for Decision- making).
A new risk related to climate change was noted, particularly by the science-based programs, and it too was added to the Corporate Risk Profile for 2011-12. Few programs identified risks relating to Stakeholder Expectations and Partnering and Collaboration as their main risks. These two have now been merged into a new risk, Third Party Reliance, and transferred to the Corporate Risk Profile 2011-12 as a non-mission-critical risk.
The table below lists the risks and their risk statements, identifies whether the risks materialized, and specifies how they affected program outcomes and related strategic outcomes if they did materialize.
| Key Corporate Risk (Corporate Risk Profile 2009) | Link to Departmental Priority | Risk Mitigation Measures in 2010-11 Report on Plans and Priorities (RPP) | Performance Summary and Analysis |
|---|---|---|---|
| Human Capital DFO may be unable to attract, develop and retain sufficiently qualified human resources to deliver on its mandate. |
• People Management • Information Management |
DFO will equip managers to fully address human capital risks impacting their delivery of policies and programs in support of DFO's mandate by identifying gaps in the recruitment, development, promotion, and retention of employees and ensuring access to appropriate guidance and tools. | • Four program activities, under all three strategic outcomes, identified this risk in their list of top three risks. • Three program activities indicated that this risk materialized during the year. Some programs re-focused and re-prioritized work to adjust to increasing staff turnover due to either an aging and retiring workforce or due to insufficient human resource capacity to effectively manage operations. Several program activities contended with delayed timelines for deliverables. • The main drivers for this risk continue to be an aging workforce and funding pressures. This risk was deemed "Tentatively Controlled" from a corporate perspective during the mid-year risk review in January 2011. This risk has now been transferred to the Corporate Risk Profile 2011-12, and it will be managed by those program activities where the risk continues to be an area of focus. |
| Information for Decision-making Sufficient and appropriate information may not be available on a timely basis to support decision-making. | • Information Management • Asset Management |
DFO will use an Information Management Strategic Plan to implement an enterprise approach to information management and will improve the management of information across the Department. | • Four program activities under two strategic outcomes, Sustainable Fisheries and Aquaculture and Healthy and Productive Aquatic Ecosystems, identified this risk in their list of top three risks. • This risk was deemed "Tentatively Controlled" from a corporate perspective during the mid-year risk review. This risk has now been transferred to the Corporate Risk Profile 2011-12, and it will be managed by those program activities where the risk continues to be an area of focus. |
| Organizational Adaptability DFO may be unable to effectively adapt to emerging priorities, directions and environmental conditions. |
• All Departmental Priorities | DFO will monitor and assess strategies developed by sectors to address emerging priorities and directions and continue to bolster its planning activities and regional committee work. | •None of the program activites identified this risk in their list of top three risks at the year-end review. • This risk was deemed "Tentatively Controlled" from a corporate perspective during the mid-year risk review. This risk has now been merged into a new risk in the Corporate Risk Profile 2011-12, under Strategic Alignment, which better articulates this risk. |
| Internal Alignment Activities, accountabilities and resources within DFO may not be optimally aligned to meet objectives. |
• No link specified in 2010-11 RPP | DFO will continue to use a risk-based process that analyzes departmental funding pressures, activities, and accountabilities to better align resources and priorities. | • Three program activities under the Healthy and Productive Aquatic Ecosystems strategic outcome identified this risk in their list of top three risks. • This risk was deemed "Controlled" from a corporate perspective during the mid-year risk review. Two program activities indicated that this risk materialized during the year. • This risk has now been merged into a new risk in the Corporate Risk Profile 2011-12, under Strategic Alignment, which better articulates this risk. |
| Physical Infrastructure DFO may be unable to invest in or maintain the infrastructure necessary to achieve its objectives. |
• Economic Action Plan • Fleet Renewal • Asset Management |
DFO will establish senior management accountabilities for asset management and develop a system to provide comprehensive and integrated asset information to ensure that investment planning will maintain DFO's physical infrastructure. | • Two program activities under two strategic outcomes, Safe and Accessible Waterways and Sustainable Fisheries and Aquaculture, identified this risk in their list of top three risks. • This risk was the only risk deemed "Attention Required" from a corporate perspective during the mid-year risk review. Several regions and sectors later indicated that this risk materialized during the year with repercussions on several fronts, including negative ratings for affected harbours and the inaccessibility of much-needed infrastructure by Science programs, compromising the delivery of the advice needed to support decision-making. This risk was considered a pressing concern for the regions because of funding pressures. • This risk has been transferred to the Corporate Risk Profile 2011-12. During the prioritization of corporate risks for 2011-12, this risk was assessed as having the highest severity rating for the Department. |
| Stakeholder Expectations DFO may be unable to manage expectations and maintain the confidence of stakeholder groups, the public, media and elected officials. |
• Globally Competitive Fisheries • Regulatory Streamlining • Information Management • International Leadership |
DFO will assess communications and consultation mechanisms as well as outreach efforts. DFO will assess learning and training strategies to foster more consistent core messages on priorities and strategic directions. | • None of the program activities identified this risk in their list of top three risks at the year-end review. • However, some program activities identified risks such as Legal and Compliance, Human Capital, Information for Decision-Making, and Internal Alignment as affecting Stakeholder Expectations over the year. • This risk has now been merged into a new risk in the Corporate Risk Profile 2011-12, under Third Party Reliance, which better articulates this risk. |
| Partnering and Collaboration DFO may be unable to create and sustain effective partnerships, or there will be failures on the part of third parties on which DFO relies. |
• Northern Strategy • Globally Competitive Fisheries • Regulatory Streamlining • Information Management |
DFO has begun to review and assess all types of collaborative arrangements that it has with organizations. | • None of the program activities identified this risk in their list of top three risks at the year-end review. • However, some program activities identified risks such as Legal and Compliance, Human Capital, Information for Decision-Making, and Internal Alignment as affecting Partnering and Collaboration over the year. • This risk has now been merged into a new risk in the Corporate Risk Profile 2011-12, under Third Party Reliance, which better articulates this risk. |
| Legal and Compliance DFO may be successfully challenged before the courts, resulting in either significant financial liability or negative effects on DFO’s legislative or regulatory authorities, and DFO may not be able to ensure public compliance with its legislation and regulations. |
• No link specified in 2010-11 RPP | The Department will develop and assess a complete, Department-wide inventory of key mitigation measures for this risk | • The Species at Risk Management Program, under the Healthy and Productive Aquatic Ecosystems strategic outcome, identified this risk in its list of top three risks. • The program activity stated that this risk made meeting the Department's legal obligations under the Species at Risk Act unfeasible because of capacity and human resources issues. • This risk was deemed "Tentatively Controlled" from a corporate perspective during the mid-year risk review. This risk remains in the Corporate Risk Profile 2011-12. During the prioritization of corporate risks for 2011-12, this risk was assessed as having the third-highest severity rating for the Department. |
| Additional Risks Identified: Climate Change |
• Not identified for 2010-11 | Not identified for 2010-11 | • While not identified as a corporate risk in the Corporate Risk Profile 2010-11, two program activities identified this risk as being in their list of top three risks. • Science for Safe and Accessible Waterways and Science for Healthy and Productive Aquatic Ecosystems have indicated that changes to ocean conditions and aquatic ecosystems resulting from climate change have challenged the Department's ability to deliver results against program outcomes. • This risk has been transferred to the Corporate Risk Profile for 2011-12 and included in a broader risk statement that encompasses hazard- or crisis- type risk for which climate change may be a driver. This risk will be managed by those program activities where the risk continues to be an area of focus. |
Summary of Performance
Financial Resources for 2010-11 ($ millions)
| Planned Spending | Total Authorities | Actual Spending |
|---|---|---|
| 1,992.2 | 2,073.1 | 1,992.9 |
2010-11 Human Resources (FTEs)
| Planned | Actual | Difference |
|---|---|---|
| 11,025 | 11,001 | -24 |
($ millions)
| Performance Indicators | Targets | 2010-11 Performance |
|---|---|---|
| Percentage of Canadian public reporting confidence in the safety of the marine transportation system in Canada | 90% by March 31, 2011 | This result was to be derived from a Transport Canada survey of public opinion. However, because of a moratorium on syndicated studies pending centralized negotiations between Public Works and Government Services Canada and private-sector contractors, CCG was not able to evaluate its 2010-11 performance on this expected result. |
| Percentage of core fishing harbours with performance ratings of fair, good, or very good | 70% by March 31, 2011 | 70% |
| Program Activity | 2009-10 | 2010-11 | Alignment to Government of Canada Outcomes | |||
|---|---|---|---|---|---|---|
| Actual Spending | Main Estimates |
Planned Spending |
Total Authorities |
Actual Spending |
||
| Canadian Coast Guard | 736.1 | 725.9 | 732.6 | 758.3 | 742.8 | Safe and Secure communities |
| Small Craft Harbours | 221.0 | 205.3 | 221.7 | 213.1 | 206.4 | Strong Economic Growth |
| Science for Safe and Accessible Waterways | 40.2 | 38.9 | 38.9 | 40.0 | 39.3 | Innovative and Knowledge-based Economy |
| Total | 997.4 | 970.0 | 993.2 | 1,011.5 | 988.5 | |
($ millions)
| Performance Indicators | Targets | 2010-11 Performance |
|---|---|---|
| Year-over-year improvement in management and conservation of major stocks to support sustainable fisheries, as evidenced in growth of the sustainability index | Baseline of 5.4/10 with target of 2% increase for 2010 to 5.5/10 and additional 2% increase to 5.6/10 for 2011 | 5.5/10 (It should be noted that the number of stocks covered by the Fisheries Checklist has increased from 120 to 136 major stocks.) |
| Year-over-year improvement in the social, economic and environmental sustainability of the Canadian aquaculture sector, as evidenced by a reduced regulatory burden, increased regulatory effectiveness, increased transparency, increased availability of scientific information, increased industry investment in innovation and certification projects and the development of sector-specific program and operational policy direction. | Development of a national data collection program and sustainability reporting process | The Reporting to Canadians draft was ready but the release was delayed because of the need for more collaborative work. |
| Implementation of Regulatory Program in British Columbia and possibly nationally | The new federal Pacific Aquaculture Regulations came into effect in December 2010. There has been no direction to scale up the British Columbia regulatory program nationally. |
| Program Activity | 2009-10 | 2010-11 | Alignment to Government of Canada Outcomes | |||
|---|---|---|---|---|---|---|
| Actual Spending | Main Estimates |
Planned Spending |
Total Authorities |
Actual Spending |
||
| Fisheries and Aquaculture Management | 339.6 | 349.0 | 350.2 | 372.9 | 356.2 | Strong Economic Growth |
| Science for Sustainable Fisheries and Aquaculture | 134.9 | 140.0 | 140.0 | 146.7 | 133.7 | Innovative and Knowledge-based Economy |
| Total | 474.5 | 489.0 | 490.2 | 519.6 | 490.0 | |
($ millions)
| Performance Indicators | Targets | 2010-11 Performance |
|---|---|---|
| Percentage of Canadian aquatic ecosystems where the risk to ecosystem health and productivity has been assessed as medium or low | To be determined – baseline value to be measured in 2010 | Data for this indicator is unavailable. As a proxy, program activity results have been used to assess performance against targets. Results range from mostly met to exceeded. |
| Program Activity | 2009-10 | 2010-11 | Alignment to Government of Canada Outcomes | |||
|---|---|---|---|---|---|---|
| ActualSpending | Main Estimates |
Planned Spending |
Total Authorities |
Actual Spending |
||
| Oceans Management | 15.8 | 15.9 | 15.9 | 15.8 | 14.6 | Clean and Healthy Environment |
| Habitat Management | 62.0 | 59.7 | 59.7 | 60.4 | 53.0 | Clean and Healthy Environment |
| Species at Risk Management | 21.8 | 23.0 | 23.0 | 23.8 | 22.1 | Clean and Healthy Environment |
| Science for Healthy and Productive Aquatic Ecosystems | 60.9 | 56.0 | 56.0 | 57.1 | 53.4 | Innovative and Knowledge-based Economy |
| Total | 160.6 | 154.7 | 154.7 | 157.1 | 143.2 | |
($ millions)
| Program Activity | 2009-10 | 2010-11 | |||
|---|---|---|---|---|---|
| Actual Spending | Main Estimates |
Planned Spending |
Total Authorities |
Actual Spending |
|
| Internal Services | 348.8 | 354.0 | 354.0 | 384.8 | 371.2 |
| Total | 348.8 | 354.0 | 354.0 | 384.8 | 371.2 |
Expenditure Profile
Departmental Spending Trend
The Department's total actual spending for 2010-11 was $1,992.9 million. Spending over the past two years has been relatively consistent. The increase in spending in 2009-10 and 2010-11 over the 2008-09 spending was due to increased spending authorities under Canada's Economic Action Plan.
The difference between Main Estimates and Total Authorities is largely due to additional funds received from the Operating Budget Carry Forward and Supplementary Estimates. The Supplementary Estimates funding was for items such as a small craft harbour in Pangnirtung, fleet and maritime services for the Canadian Coast Guard, and the establishment and implementation of the new federal Pacific Aquaculture Regulations in British Columbia.
Approximately 75% of the variance between Total Authorities and Actual Spending, after reimbursement for cash-managed items, will be spent in future years so the authorities will not be lost to the Department. The remaining variance, representing approximately 1% of total departmental authorities, will be lapsed.
Canada's Economic Action Plan
Canada's Economic Action Plan (EAP) allocated close to $12 billion in new infrastructure funding over two years to create jobs across Canada and to ensure that Canada emerges from the economic downturn with a more modern and greener infrastructure. DFO received the following funding in 2010 11 as part of the government's EAP.
| EAP Initiative | Summary of Performance | 2010-11 ($ millions) | ||
|---|---|---|---|---|
| Planned Spending |
Actual Spending |
Actual Spending, including contributions to Employee Benefit Plans | ||
| Canadian Coast Guard Shipbuilding and Repair | • Five vessel life extensions completed • 35 vessel refits completed • 60 small craft built and delivered • 16 Environmental Response Barges delivered with 14 to be delivered by fall 2011 • Five 47-foot Search and Rescue Motor Lifeboats completed • Work continues on three In-shore science vessels to be delivered by fall 2011 |
85.0 | 92.81 | 93.0 |
| Small Craft Harbours | • 220 repair and maintenance projects completed • 8 engineering only and 6 early planning stage projects completed1 • 38 projects currently underway to be completed by fall 2011 |
97.72 | 86.31 | 93.6 |
| Pangnirtung Harbour | • Phase 1 to be completed by summer 2011 • Phase 2 contract has been awarded with construction to begin in summer 2011 |
10.0 | 6.93 | |
| Federal Laboratories | • 57 sub-projects in the laboratories were completed • One sub-project is 98% complete (will be completed in July 2011) |
24.5 | 24.1 | 24.1 |
| Federal Contaminated Sites Action Plan | • 1,296 sites assessed for contamination • 79 sites had remediation and risk management projects completed • Provided expert support for the management of federal contaminated sites |
8.24 | 12.45 | 12.9 |
| Total | 225.4 | 222.5 | 223.5 | |
1 2009-10, Small Craft Harbours spent $8 million in unused funding from Canadian Coast Guard and $2.6 million of unused funding from Pangnirtung Harbour. This funding was returned to Canadian Coast Guard and Pangnirtung Harbour in 2010-11.
2 Small Craft Harbour 2010-11 planned spending includes $0.6 million in Employee Benefit Plan contributions and Public Works and Government Services Canada accommodation.
3 Pangnirtung Harbour has carried forward $5.8 million of unused 2010-11 funding for use in 2011-12.
4 An error was discovered after the finalization of the 2010-11 Main Estimates, which resulted in an increase of $4.3 million for the Federal Contaminated Sites Action Plan EAP budget.
5 In 2010-11, the program management funding normally provided by the Federal Contaminated Sites Action Plan was instead funded through the Economic Action Plan, accounting for the increase in Actual Spending.
Additional information on Canada's Economic Action Plan is available at http://www.actionplan.gc.ca/eng/index.asp.
Economic Action Plan Spending
Estimates by Vote
Information on our organizational votes or statutory expenditures is available in the 2010-11 Public Accounts of Canada (Volume II). This publication is available at http://www.tpsgc-pwgsc.gc.ca/recgon/txt/72-eng.html.
Section II: Analysis of Program Activities by Strategic Outcome
An overall performance rating has been assigned to each expected result based on the following:
Performance Rating Legend
| If this percentage of expected performance is achieved… | The performance rating is defined as… | The performance rating is shown graphically as… |
|---|---|---|
| More than 100% | Exceeded | |
| 100% | Met All | |
| 80 to 99% | Mostly Met | |
| 60 to 79% | Somewhat Met | |
| Less than 60% | Not Met | |
Strategic Outcome #1 - Safe and Accessible Waterways
Program Activity 1: Canadian Coast Guard
Description from Main Estimates: The Canadian Coast Guard (CCG) provides civilian marine services (vessels, aircraft, expertise, personnel and infrastructure) to deliver its own programs (Aids to Navigation, Waterways Management, Marine Communications and Traffic Services, Environmental Response, Icebreaking, Search and Rescue), and on behalf of other federal government departments or in support of federal agencies and organizations in the achievement of their own specific Government of Canada maritime priorities. CCG provides support to other parts of Fisheries and Oceans Canada (Science and Conservation and Protection), the Department of National Defence, Environment Canada, the Royal Canadian Mounted Police, Foreign Affairs and International Trade, and Transport Canada among others.
Financial and Human Resources for 2010-11
| Financial Resources ($ millions) | Human Resources (FTEs) | ||||
|---|---|---|---|---|---|
| Planned Spending | Total Authorities | Actual Spending | Planned | Actual | Difference |
| 732.6 | 758.3 | 742.8 | 4,838 | 4,903 | +65 |
Performance Measurement
| Expected Results |
Performance Indicators |
Targets | Performance Status |
Performance Rating |
|---|---|---|---|---|
| Safe, economical, and efficient movement of maritime traffic in Canadian waters | Number of vessel movements facilitated through the provision of CCG maritime safety services (maintain a 3-year average) | 848,734 by March 31, 2011 | 582,194 | |
| Civilian fleet operationally ready to deliver Government of Canada programs and maintain a federal presence | Satisfaction rate (percentage) of CCG meeting GOC requirements for an operationally ready fleet | 80% by March 31, 2011 | Government of Canada had access to an operationally ready civilian fleet that maintained a federal presence on Canadian waters. | |
Performance Highlights
- Continued efforts to procure new vessels and undertake major vessel repairs to improve the Canadian Coast Guard's capacity to deliver its programs and services.
- Created an Arctic Vision for CCG programs that includes objectives for the next 5, 15, and 30 years.
- Finalized the baseline requirements for the replacement of CCGS Louis S. St-Laurent with a new more capable polar icebreaker. Delivery of the new vessel is on track for 2017.
- Continued to play a leadership role in the implementation of e-Navigation in Canadian waters, which is expected to significantly enhance marine safety, have positive economic benefits, and increase environmental protection.
- Delivered equipment packages designed to improve the Canadian Coast Guard's capacity to respond to oil spills in the Arctic.
Performance Summary and Analysis
The Canadian Coast Guard's focus in 2010-11 continued to be to ensure that it has a skilled, qualified, and representative workforce; to deliver on fleet procurement and repair processes already under way; and to play a leadership role in the implementation of e-Navigation and in the development of a strategic DFO/CCG Arctic Vision.
The Coast Guard facilitated over half a million vessel movements through the provision of maritime safety services to provide safe, economical, and efficient movement of maritime traffic in Canadian waters. Although this figure appears to be short of the target, the introduction of a new electronic data collection system and a change in the reporting method used for registered ferry movements (only first and last daily trips are reported) explain the large variance from last year. These data issues will be resolved in the 2012-13 reporting period.
|
Canada's Economic Action Plan … |
Lessons Learned
The December 2010 audit by the Commissioner of the Environment and Sustainable Development on oil spills from ships was critical of the Coast Guard's preparedness to respond to marine pollution incidents in Canada's waters. The report identified significant gaps, particularly related to updated risk assessments, equipment, and the readiness capacity of the Coast Guard. The Canadian Coast Guard agrees with the recommendations from the Commissioner's audit, which confirmed the findings of a similar departmental internal audit of the Environmental Response program, completed in May 2010. The Coast Guard has begun to address the recommendations of both audits, and is developing a regular reporting process to the Commissioner on progress made in addressing his recommendations.
In 2010-11, evaluations were completed for the Aids to Navigation program, the Waterways Management program, and the Icebreaking Services program. These evaluations provided several recommendations, including the development and implementation of a performance measurement strategy. The Aids to Navigation program evaluation also indicated that the program would benefit from national standardization of data collection and entry, and suggested studying the possibility of automating lightstations. The Waterways Management program evaluation recommended the Canadian Coast Guard communicate to users the survey status of its mandated channels and that the Coast Guard and DFO Real Property collaboratively develop and implement a maintenance and/or refurbishment plan for its marine structures. The Icebreaking Services program was encouraged to continue supporting its complementary services, such as the MARINFO website (http://www.marinfo.gc.ca), and its partnership agreements, such as those with Canadian Ice Services and the United States Coast Guard. Management Action Plans to address all recommendations have been developed and are monitored by the Departmental Evaluation Committee to ensure that the recommendations are being implemented.
|
Program Audit … |
|
Program Evaluation … |
Program Sub-activities
Canadian Coast Guard is delivered through ten sub-activities, as indicated in the Program Activity Architecture. Performance information for these sub-activities is available on the DFO website (http://www.dfo-mpo.gc.ca/dpr-rmr/2010-11/toc-tdm-eng.html).
Program Activity 2: Small Craft Harbours
Description from Main Estimates: The Small Craft Harbours Program directly, or indirectly through Harbour Authorities, operates and maintains a network of harbours, critical to the fishing industry, that is open, safe and in good repair. These harbours are necessary for the effective operation of the commercial fisheries that contribute to the Canadian economy, directly support employment and that indirectly create tens of thousands jobs, many in rural and isolated parts of Canada.
Financial and Human Resources for 2010-11
| Financial Resources ($ millions) | Human Resources (FTEs) | ||||
|---|---|---|---|---|---|
| Planned Spending | Total Authorities | Actual Spending | Planned | Actual | Difference |
| 221.7 | 213.1 | 206.4 | 191 | 185 | -6 |
Performance Measurement
| Expected Results |
Performance Indicators |
Targets | Performance Status |
Performance Rating |
|---|---|---|---|---|
| A network of harbours critical for Canada's commercial fishing industry that is open, safe, and in good repair | Percentage of core fishing harbours with performance ratings of fair, good or very good | 70% by March 31, 2011 |
70% | |
| Percentage of facilities at core fishing harbours in fair, good or very good condition | 80% by March 31, 2011 |
73% | |
|
| Percentage of recreational and non-core harbours divested | 5% of remaining divestiture candidates to be divested in 2010-11 |
18% | |
Small Craft Harbours throughout Canada
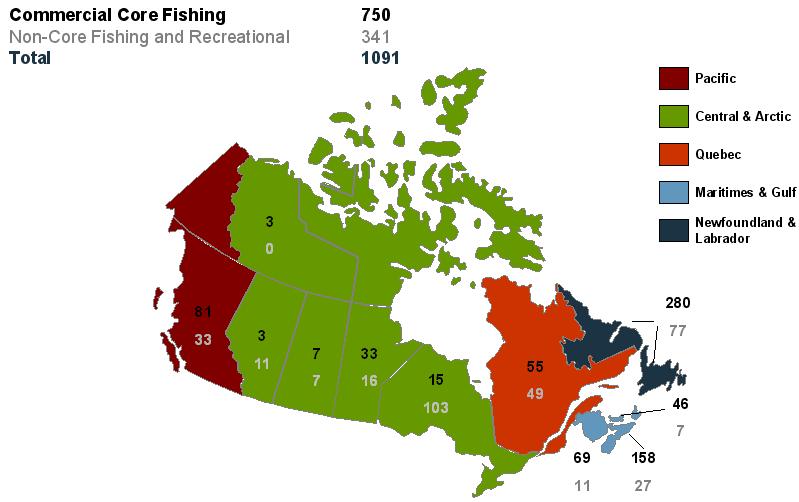
Performance Highlights
- Repaired or undertook maintenance projects at over 200 core fishing harbours. Of the 272 projects, 220 were completed, 38 were nearly completed, and 14 reached the engineering and/or planning stages. Because some costs exceeded original estimates during implementation, the Small Craft Harbours program implemented a mitigation strategy, including scope adjustment and deferral of work to future years. Projects will be completed with funding from the Program's regular budget.
- Completed 80% of Phase 1 construction work for a small craft harbour in Pangnirtung, Nunavut and awarded the contract for Phase 2. Phase 1 is expected to be complete in early 2011-12 while all construction is expected to be complete by the summer of 2013. The project has experienced delays due to adverse weather and limited transportation to the remote area.
- Divested 65 sites in year three of the four-year Divestiture of Non-Core Harbours Program. In total, the program has divested 79 sites, with the goal of divesting 75-95 harbours after four years.
- Implemented portions of the Small Craft Harbours functional review including work associated with the development of National Model Work Descriptions. Some delays were experienced because of the acute need to mobilize program resources to deliver initiatives under Canada's Economic Action Plan.
Performance Summary and Analysis
Small Craft Harbours continued to focus on the delivery of Canada's Economic Action Plan in 2010-11, including the construction of a fishing harbour in Pangnirtung, Nunavut, as well as the repair and maintenance of core commercial fishing harbours. With the help of the economic stimulus funding received as part of Canada's Economic Action Plan, 70% of core fishing harbours received performance ratings of fair, good, or very good, meeting Small Craft Harbours' target for 2010-11. With regard to facilities at core fishing harbours, 73% are in fair, good, or very good condition, just below the 80% target for 2010-11. These targets were met or nearly met despite a series of storms in late 2010 that caused damage to facilities and fishing harbours in over 250 communities. Small Craft Harbours completed the divestiture of 65 sites in 2010-11 — the equivalent of 18% of the remaining recreational and non-core harbours to be divested and exceeding the target of 5%. This substantial improvement in performance is largely the result of completing 42 minor sites in the Pacific Region, which was made possible with temporary resources provided by the Divestiture of Non-core Harbours Program.
|
Canada's Economic Action Plan …
|
Lessons Learned
In 2010-11, a number of Small Craft Harbours repair and maintenance projects were completed significantly above or below the estimated value. As a result, Small Craft Harbours recognizes there is a need to strengthen the planning process to ensure better accuracy of estimates in the future. In regard to the divestiture of recreational and non-core harbours, Small Craft Harbours recognizes that although a large number of sites were divested this year, the remaining sites are more difficult and costly to complete, and many will require environmental remediation. These challenges may affect the number of sites divested in 2011 12.
|
Program Evaluation … The report found that the program was relevant and effective and made no recommendations. |
Program Activity 3: Science for Safe and Accessible Waterways
Description from Main Estimates: This program provides scientific research, monitoring, advice, products and services and data management to ensure departmental and federal policies, programs, decisions, and regulations associated with safe, secure, and accessible waterways are informed by science advice. The science is provided through a network of research facilities, in collaboration with other government departments, private sector, academia and international organizations.
Financial and Human Resources for 2010-11
| Financial Resources ($ millions) | Human Resources (FTEs) | ||||
|---|---|---|---|---|---|
| Planned Spending | Total Authorities | Actual Spending | Planned | Actual | Difference |
| 38.9 | 40.0 | 39.3 | 297 | 288 | -9 |
Performance Measurement
| Expected Results |
Performance Indicators |
Targets | Performance Status |
Performance Rating |
|---|---|---|---|---|
| Stakeholders have the information to safely navigate Canada's waterways | Number of navigational digital and paper products sold | Maintain current unit sales levels or achieve a net increase in products sold | 64% decrease in digital products sold and 5% increase in paper products sold, in comparison with 2009-10 | |
Performance Highlights
- Completed 14 of the 23 new charts required to service the Kitimat and Prince Rupert areas of British Columbia, making it possible for deep-draught vessels to safely navigate in this area of Canada's Pacific coast. Completion of the required work will take several years.
- Continued efforts to synchronize the production, availability, and maintenance of its paper and digital charts.
- Continued to improve the digital product and distribution model, including improvements to the registration service and the web-based digital product update service. Fourteen new Raster Navigational Charts and 65 new Electronic Navigational Charts were made available for public access.
Performance Summary and Analysis
The way Canadian and international mariners use technology continues to shape the navigational products and services provided by the Canadian Hydrographic Service (CHS), including the way in which those products and services are delivered. Between 2007-08 and 2009-10, the overall number of paper hydrographic charts and publications sold declined by approximately 20%, while the number of digital hydrographic charts and products increased by almost 25%. CHS expected that the sale of paper products would continue to decline annually and that the sale of digital products would continue to experience large double-digit growth rates. Contrary to the recent trend, the sale of paper products increased slightly in 2010-11 and the sale of digital products appears to have decreased. The reasons for this apparent reversal in trend is not known at this time; however, the purchase of CHS products and data through licensed global service providers and the reselling of hydrographic data in private-sector value-added products is not currently captured by the above performance indicator. In 2010-11, one international global service provider alone sold over 90,000 paper charts for Canadian waterways. These alternative sources and alternative uses of information in the marketplace should be considered when trying to understand the trend in the use of CHS products and data.
Lessons Learned
CHS will continue to monitor the apparent trend reversal in the sale of digital and paper navigational products and attempt to quantify the extent to which CHS information is used via non-traditional outlets. Should the trend continue, CHS will more closely examine the possible reasons for this unexpected reversal to ensure that official navigational products are meeting the needs of today's mariners.
A lack of hydrographic data in critical areas can create a risk to safe navigation, coastal communities, and Canadians in general. Keeping the existing portfolio of hydrographic products and services up-to-date and creating new products to service areas of emerging importance (e.g., Arctic, Asia-Pacific Gateway), while making these products and services accessible in a technological environment that continues to innovate, requires a risk-based approach to the management of the overall portfolio of hydrographic products and services. Given the proven utility of the risk-based approach to support the management of the portfolio, the Canadian Hydrographic Service will continue to refine and adjust its risk-based framework to improve its usefulness as a tool in decision-making.
Program Sub-activities
Science for Safe and Accessible Waterways is delivered through two sub-activities, as indicated in the Program Activity Architecture. Performance information for these sub-activities is available on the DFO website (http://www.dfo-mpo.gc.ca/dpr-rmr/2010-11/toc-tdm-eng.html).
Strategic Outcome #2 - Sustainable Fisheries and Aquaculture
Program Activity 1: Fisheries and Aquaculture Management
Description from Main Estimates: The overall goal of fisheries and aquaculture management is the conservation of Canada's fisheries resources to ensure sustainable resource utilization through close collaboration with resource users and stakeholders based on shared stewardship. Fisheries and Aquaculture Management contributes to international fisheries conservation negotiations and relations, shared management of interception fisheries in international waters, management of the Aboriginal, commercial, recreational fishing in the coastal waters of Canada's three oceans and creating the conditions for a vibrant and innovative aquaculture industry and for an economically prosperous fishing sector as a whole.
Financial and Human Resources for 2010-11
| Financial Resources ($ millions) | Human Resources (FTEs) | ||||
|---|---|---|---|---|---|
| Planned Spending | Total Authorities | Actual Spending | Planned | Actual | Difference |
| 350.2 | 372.9 | 356.2 | 1,594 | 1,633 | +39 |
Performance Measurement
| Expected Results |
Performance Indicators |
Targets | Performance Status |
Performance Rating |
|---|---|---|---|---|
| Sustainable fisheries and aquaculture | Year-over-year improvement in the management and conservation of stocks to support sustainable fisheries, as evidenced in the growth of the sustainability index | Baseline of 5.4/10 with target of 2% increase for 2010 and additional 2% increase for 2011 | 5.5/10* | |
Performance Highlights
- Developed and implemented Integrated Fisheries Management Plans for 68 of 136 major stocks (50%) on the 2010-11 Fisheries Checklist; this is an increase from the 41.7% coverage achieved in 2009-10.
- Promoted shared stewardship of fisheries through participation in numerous advisory committees and a new Integrated Fisheries Management Plan template that encourages consultations with industry when determining fishery objectives.
- Published five sector strategy plans for the sustainable development of aquaculture that were endorsed by the Canadian Council of Fisheries and Aquaculture Ministers in November 2010.
- Improved and restored approximately 198,000 m2 of fish habitat and supported 49 habitat improvement projects through the Salmonid Enhancement Program.
- Continued to place emphasis on promoting compliance with legislation, regulations, and management measures through education and shared stewardship programs.
- Delivered fishing licences in a timely manner and continued to improve processes. Collected all fisheries data required and began to implement system improvements.
- Undertook major case and special investigations involving both the east and west coasts. Major case management and intelligence software solutions have been identified. Field access by Fishery Officers is being developed, along with a new national inspection database to enhance inspection information accessibility across the country.
- Redeveloped the Aboriginal Contribution Agreement to a common template and produced a Recipient Capacity Assessment Tool that staff and recipient organizations were trained to use.
- Adopted changes to licensing policies to increase the capacity for industry to self-adjust in response to economic viability problems. For example, the Policy on the Issuance of Licences to Companies has been announced to enable greater opportunities for economic prosperity for Canada's inshore Atlantic and Quebec fisheries.
- Promoted and influenced sustainable regional fisheries management and healthy global marine ecosystems by:
- Contributing to negotiations for a new regulated fisheries management area in the high seas of the North Pacific Ocean, thereby advancing Canadian objectives of marine conservation and protection while creating the potential for fisheries resources in the region;
- Launching a comprehensive, basin-wide, bi-national Asian carp risk assessment to combat the threat posed by invasive Asian carp to the Great Lakes; and
- Playing a strong role in helping members of the Northwest Atlantic Fisheries Organization (NAFO) continue with the closures of six vulnerable marine ecosystems in the NAFO Regulatory Area and the adoption of a number of plans and frameworks supporting proper management of shrimp, Greenland halibut, American Plaice, and cod.
- Contributed to the growth of international trade through renewal of DFO's sustainable seafood website, presence at leading global trade shows, engagement of stakeholders in Canada's sustainable seafood management regime, and engagement with ecocertification and ecolabelling organizations.
Performance Summary and Analysis
In 2010-11, Fisheries and Aquaculture Management was focused on advancing the following priorities: the Northern Strategy, International Leadership, and Globally Competitive Fisheries. Also, various elements of the Sustainable Fisheries Framework14 were consulted on and implemented, such as the Precautionary Approach and the Ecosystems Approach.
To protect our fisheries and remain globally competitive, Fisheries and Aquaculture Management is expected to produce sustainable fisheries and aquaculture through improvements in the management and conservation of fish stocks. Progress in this area is measured by increases in the sustainability index compared to the baseline level of 5.4/10 (measured in 2008-09). For 2010-11, the sustainability index was 5.5. This is an increase from the score of 5.4 that was achieved in 2008-09 and 2009-10. It should be noted that in 2010-11, checklists were completed for an additional 16 stocks compared to 2009-10.
Lessons Learned
Fisheries and Aquaculture Management has noted that changes in the sustainability index do not always accurately reflect changes in the management and conservation of stocks. The list of stocks and checklist questions for a given year must be defined and remain unchanged to accurately measure changes in the index. Starting in 2011, the fisheries stock list and checklist questions will be defined and set for four years to allow for year-over-year comparison.
Since aquaculture management is a shared jurisdiction between federal and provincial/territorial governments, partnerships between the governments are key to promoting sustainable and competitive aquaculture. However, building federal-provincial partnerships is complex and requires time. This reality has caused delays in delivering some aquaculture program activities, notably the release of the sustainability report and the development of the fish health regulations.
In 2010-11, evaluations were completed for the International Fisheries Conservation program and the Conservation and Protection program, and several recommendations were made. The evaluation of the International Fisheries Conservation program recommended that the program develop a performance measurement strategy, continue to explore new partnerships with key countries, continue to sustain its bilateral and multilateral partnerships, and engage Regional Fisheries Management Organizations on capacity and compliance issues. The Conservation and Protection program evaluation recommendations included the need for national direction in the area of education and shared stewardship. The evaluation also recommended the development and implementation of a plan to guide the program's direction in major cases and special investigations and the exploration of options to increase efficiency and address workload concerns. Management Action Plans to address all recommendations have been developed and are monitored by the Departmental Evaluation Committee to ensure that the recommendations are being implemented.
|
Program Evaluation … |
Program Sub-activities
Fisheries and Aquaculture Management is delivered through six sub-activities, as indicated in the Program Activity Architecture. Performance information for these sub-activities is available on the DFO website (http://www.dfo-mpo.gc.ca/dpr-rmr/2010-11/toc-tdm-eng.html).
Program Activity 2: Science for Sustainable Fisheries and Aquaculture
Description from Main Estimates: Provision of advice and recommendations based on scientific research and monitoring, as well as the provision of products and services and the management of data on Canada's oceans and resources. This ensures departmental and federal policies, programs, decisions, and regulations associated with sustainable fisheries and aquaculture are informed by scientific knowledge. The science is provided through a network of research facilities, in collaboration with other government departments, private sector, academia and international organizations.
Financial and Human Resources for 2010-11
| Financial Resources ($ millions) | Human Resources (FTEs) | ||||
|---|---|---|---|---|---|
| Planned Spending | Total Authorities | Actual Spending | Planned | Actual | Difference |
| 140.0 | 146.7 | 133.7 | 927 | 952 | +25 |
Performance Measurement
| Expected Results |
Performance Indicators |
Targets | Performance Status |
Performance Rating |
|---|---|---|---|---|
| Comprehensive understanding of aquatic resources for decision-makers to help ensure sustainable fisheries and aquaculture | Number of Canadian publications on sustainable fisheries and aquaculture that are authored/co-authored by DFO Science | Maintain 5-year average (2006-11) | 196 published papers were produced on sustainable fisheries and aquaculture in 2009; this is below the 5-year average of 217 papers* | |
| Number of DFO Science publications on sustainable fisheries and aquaculture that are cited | Maintain 5-year average (2006-11) | Average number of citations to papers published on sustainable fisheries and aquaculture between 2005 and 2009 was 477 per year. Between 2004 and 2008, DFO Science papers were cited more often than the world average.* | |
|
| Number of Canadian Science Advisory Secretariat (CSAS) publications on sustainable fisheries and aquaculture that are posted on the CSAS website | Maintain 5-year average (2006-11) | Produced 130 CSAS publications that are posted on the DFO website; approximately 19% below the 5 year average of 160 | |
Performance Highlights
- Improved the guidance on Techniques for the Provision of Advice in Information-Poor Situations under the Technical Expertise in Stock Assessments (TESA) initiative. The objectives were to review the state-of-the-art in assessment and management approaches for information-poor fisheries; review case studies of information-poor fisheries to determine what assessment approaches are useful for providing management advice; produce a decision tree that includes guidelines and assessment/management tools for various data-poor situations; and describe the types of advice that can be produced, and what the uncertainties will be, in various data-poor situations.
- Contributed to the Natural Sciences and Engineering Research Council-funded Canadian Integrated Multitrophic Aquaculture Network as a member of the Steering Committee. In this capacity, provided advice and direction from a national regulatory perspective on the development of the program, communication, and budgeting. In addition, 64 Aquaculture Collaborative Research and Development projects were undertaken in 2010-11. These projects increased the level of collaborative research and development activity between the aquaculture industry and the Department.
- Assisted with the implementation of the New Substances Notification Regulations (Organisms) by providing guidance in response to stakeholder inquiries on regulatory requirements and process. In addition, participated in an Environment Canada-led regulatory consultation on the review of these regulations to provide science-based advice on appropriate regulatory approaches for fish biotechnology.
- Responded to aquaculture-related requests for priority regulatory research and communicated the results to the responsible federal regulatory authority. Undertook eleven regulatory research projects were undertaken in 2010-11.
- Initiated a bi-national (Canada and the United States) risk assessment of Asian carp to provide scientific advice on key areas within the Great Lakes basin that are most vulnerable to invasion and identify routes where they could enter the Canadian side of the lake system.
Performance Summary and Analysis
In 2009 (the most recent year for which data is available), DFO Science produced 196 papers on sustainable fisheries and aquaculture (source: Science-Metrix Inc). This represents a decrease of approximately 10% when compared with the Department's five-year average. Approximately 67% of these papers were written in collaboration with other key players in Canada's research community (e.g., universities and the private sector). On average, DFO papers accounted for approximately 19% of Canadian papers on sustainable fisheries and aquaculture between 2005 and 2009. DFO Science papers on sustainable fisheries and aquaculture consistently received an above-average number of citations relative to the average number of citations received by world papers between 2004 and 2008, which demonstrates the utility of the publications.
The Canadian Science Advisory Secretariat (CSAS) coordinates the peer review of scientific issues for the Department. In 2010-11, CSAS produced 130 publications (science advisory reports, research documents, proceedings, and science responses) in response to advisory needs associated with the Sustainable Fisheries and Aquaculture strategic outcome. Although this appears to represent a significant decrease in advice, it reflects a reallocation of science advice to support the increased advisory needs in support of the Healthy and Productive Aquatic Ecosystems strategic outcome. Overall, the total number of CSAS publications (278) in support of both strategic outcomes is well above the five-year average of 233 publications, demonstrating a strong contribution to the body of scientific knowledge. These publications are available on the Canadian Science Advisory Secretariat website.15
Lessons Learned
In 2010-11, an evaluation of the Fisheries Resource Science Program was completed. Recommendations included that the program identify options to address the challenge of moving toward a complex ecosystem-based approach, as well as options to address gaps in skills and achieve further efficiencies. Management Action Plans to address all recommendations have been developed and are monitored by the Departmental Evaluation Committee to ensure the recommendations are being implemented.
In recent years, the breadth of science advice provided by the Department's science program has gone far beyond the longstanding requirement to assess the status of the fisheries resource in support of sustainable fisheries and aquaculture. The requirement for advice to support the Department's other two outcomes, Healthy and Productive Aquatic Ecosystems and Safe and Accessible Waterways, has grown considerably. Ten years ago, requests to the Department's CSAS for formal science advice on aquatic species at risk was minimal. Today, 30% of the advisory publications produced by CSAS are in direct support of requirements associated with the management of species at risk. This overall growth has required that program efficiencies be found (e.g., multi-species versus single-species stock surveys) and that risk-informed choices be made with regard to which requests for science advice are serviced within a given fiscal year.
|
Program Evaluation … |
Program Sub-activities
Science for Sustainable Fisheries and Aquaculture is delivered through six sub-activities, as indicated in the Program Activity Architecture. Performance information for these sub-activities is available on the DFO website (http://www.dfo-mpo.gc.ca/dpr-rmr/2010-11/toc-tdm-eng.html).
Strategic Outcome #3 - Healthy and Productive Aquatic Ecosystems
Program Activity 1: Oceans Management
Description from Main Estimates: Oceans Management involves the conservation and sustainable use of Canada's oceans in collaboration with other levels of government, Aboriginal organizations and other non-government stakeholders through the development and implementation of objectives-based integrated oceans management plans and the application of marine conservation tools. Modern oceans management arrangements deal with a number of challenges including oceans health, marine habitat loss, declining biodiversity, growing demands for access to ocean resources and regulatory and jurisdictional complexities.
Financial and Human Resources for 2010-11
| Financial Resources ($ millions) | Human Resources (FTEs) | ||||
|---|---|---|---|---|---|
| Planned Spending | Total Authorities | Actual Spending | Planned | Actual | Difference |
| 15.9 | 15.8 | 14.6 | 131 | 113 | -18 |
Performance Measurement
| Expected Results |
Performance Indicators |
Targets | Performance Status |
Performance Rating |
|---|---|---|---|---|
| Oceans activities are managed in a manner consistent with sustainable development | Percentage of priority ocean ecosystems where ecosystem integrity is maintained or improved | 100% by March 31, 2017 | Data for these indicators is unavailable; as a proxy, sub-activity results have been used to assess performance. | |
| Contribution of marine-based industries to GDP | Contribution of marine-based industries to Gross Domestic Product remains stable or increases by March 31, 2017 |
Performance Highlights
- Facilitated information access and exchange, informed decision-making, and enhanced oceans planning and management by:
- Providing secretariat support to an interdepartmental committee on oceans to coordinate and align federal government planning and action on oceans issues;
- Convening two meetings of the Directors' General Interdepartmental Committee on Oceans;
- Managing an online interdepartmental forum to facilitate exchange of information among federal oceans planners; and
- Working with provincial and territorial counterparts through a national level Oceans Task Group as well as five regional committees on oceans management.
- Completed integrated management plans for two of the five Large Ocean Management Areas.
- Designated Tarium Niryutait as a Marine Protected Area16 in August 2010. Four Areas of Interest (Hecate Strait Sponge Reefs, Race Rocks, Paulatuk, and Laurentian Channel) are being considered for future designation as Marine Protected Areas (designation is anticipated by 2013).
- Developed knowledge of the conservation, social, economic, and governance aspects of defined marine areas and increased awareness of the effects oceans activities can have on such areas by:
- Completing Socio-Economic and Cultural Overview and Assessment (SECOA) reports for two Large Ocean Management Areas (Gulf of St. Laurence and Pacific North Coast);
- Completing an assessment of the availability and quality of SECOA-related data sources and a series of background reports on the State of the Gulf of Maine; and
- Continuing efforts to collect and refine ecological and socio-economic information into Geographic Information Systems in support of improved decision-making.
Performance Summary and Analysis
Significant progress has been achieved in advancing integrated management, as demonstrated through continued collaboration with other federal, provincial, and territorial governments, Aboriginal groups, and other stakeholders, and the completion and announcement of the Beaufort Sea Integrated Management Plan in August 2010.
The designation of the Tarium Niryutait Marine Protected Area in August 2010 continues Oceans Management's work toward achieving a target of six new Marine Protected Areas. Looking forward, seven Areas of Interest may also be designated as Marine Protected Areas as part of the commitments made under the Health of the Oceans Initiative. In addition, drafting and public consultations have been completed on the National Framework for Canada's Network of Marine Protected Areas in collaboration with federal-provincial-territorial government partner agencies.
Lessons Learned
The Oceans Management program depends on the capacity of partners to support and implement integrated management plans, corresponding objectives and monitoring strategies to achieve its expected results. Delays or inability on the part of partners can hinder the achievement of some results.
Program Sub-activities
Oceans Management is delivered through two sub-activities, as indicated in the Program Activity Architecture. Performance information for these sub-activities is available on the DFO website (http://www.dfo-mpo.gc.ca/dpr-rmr/2010-11/toc-tdm-eng.html).
Program Activity 2: Habitat Management
Description from Main Estimates: In collaboration with others, Habitat Management involves conserving and protecting fish and fish habitat from the impacts of activities occurring in and around fresh and marine fish-bearing waters, and improving (restoring and developing) fish habitat through the administration of the habitat protection provisions of the Fisheries Act, providing advice on related provisions of the Act, and the application of non-regulatory activities. It also involves conducting environmental assessments prior to regulatory decisions listed in the Law List Regulations of the Canadian Environmental Assessment Act and participating in other environmental assessment regimes. These activities are performed in a manner consistent with the Species at Risk Act; the Policy for the Management of Fish Habitat and other operational policies; consultation with Aboriginal groups; the goals and principles of sustainable development; and the policies and priorities of the federal government.
Financial and Human Resources for 2010-11
| Financial Resources ($ millions) | Human Resources (FTEs) | ||||
|---|---|---|---|---|---|
| Planned Spending | Total Authorities | Actual Spending | Planned | Actual | Difference |
| 59.7 | 60.4 | 53.0 | 516 | 434 | -82* |
Performance Measurement
| Expected Results |
Performance Indicators |
Targets | Performance Status |
Performance Rating |
|---|---|---|---|---|
| Healthy and productive fish habitat available to sustain the production of fish species and populations that Canadians value | Percentage of inspected projects that conform with the terms and conditions of operational statements, formal advice in writing, and Fisheries Act authorizations | 70% by March 31, 2011 | 94% | |
Performance Highlights
- Provided formal advice to proponents of over 4,000 development projects to ensure that adequate measures are in place to protect fish and to ensure that appropriate monitoring studies are undertaken.
- Observed a 94% conformity rate for all completed and monitored undertakings occurring in and around water.
- Implemented the Guide to Writing Fisheries Act Authorizations to help improve timeliness and consistency and developed a Quality Management Framework to support continuous improvement to operational policies and practices.
- Maintained formal relationships with the Canadian Electricity Association, as well as conservation and environmental non-government organizations. Continued to support open dialogue with other key stakeholders who have interests in natural resource management.
Performance Summary and Analysis
In 2010-11, Habitat Management continued to focus on regulatory improvements and the delivery of environmental assessments under Canada's Economic Action Plan. Habitat Management also remained vigilant in its goal of maintaining healthy and productive fish habitats capable of sustaining the production of fish species and populations that Canadians value. To ensure the availability of healthy and productive habitat, Habitat Management examined projects to verify those involved were conforming to the terms and conditions of operational statements, formal advice in writing, and Fisheries Act authorizations. In total, 94% of inspected projects conformed to the requirements listed above, surpassing the 2010-11 target of 70%.
Lessons Learned
Although Habitat Management was able to greatly surpass its performance target for 2010-11, the expected level of compliance was under-estimated. This under-estimate is attributed tonot having enough data when the target was set. Once the data set is near completion, the goal will be adjusted accordingly.
Program Sub-activities
Habitat Management is delivered through four sub-activities, as indicated in the Program Activity Architecture. Performance information for these sub-activities is available on the DFO website (http://www.dfo-mpo.gc.ca/dpr-rmr/2010-11/toc-tdm-eng.html).
Program Activity 3: Species at Risk Management
Description from Main Estimates: Aquatic species at risk are managed to provide for the recovery of extirpated, endangered and threatened species; and the management of special concerned species to prevent them becoming at risk. This program activity involves developing recovery strategies, action plans and management plans for all aquatic species; promoting recovery implementation and monitoring of marine and anadromous (moving between fresh and salt water) species over which the federal government has exclusive jurisdiction; and promoting freshwater species for which certain provinces have specific delegated responsibilities related to fisheries management through regulations under the Fisheries Act.
Financial and Human Resources for 2010-11
| Financial Resources ($ millions) | Human Resources (FTEs) | ||||
|---|---|---|---|---|---|
| Planned Spending | Total Authorities | Actual Spending | Planned | Actual | Difference |
| 23.0 | 23.8 | 22.1 | 104 | 144 | +40* |
Performance Measurement
| Expected Results |
Performance Indicators |
Targets | Performance Status |
Performance Rating |
|---|---|---|---|---|
| Endangered or threatened aquatic species in Canada are managed to prevent them from becoming extinct | Percentage of listed species for which conservation and protection measures and objectives are identified (as stipulated in the Species at Risk Act) | 80% in 2010-11 100% in 2011-12 | 100% | |
Performance Highlights
- Developed various guidance documents for delivery of the program. Began development of data management systems to enable results-based reporting.
- Supported the Standing Committee on Environmental and Sustainable Development's parliamentary review of the Species at Risk Act (SARA) by:
- Providing information and analysis regarding SARA implementation;
- Advising DFO officials appearing before the Committee;
- Analyzing evidence submitted by various parties to the Committee; and
- Ensuring issues related to aquatic species were reflected in all of the above.
Performance Summary and Analysis
Species at Risk Management's focus in 2010-11 continued to be managing and delivering species at risk programs to enhance healthy and productive aquatic ecosystems, habitats, and species. Part of this focus includes ensuring that endangered or threatened aquatic species in Canada are managed to prevent them from becoming extinct. Species at Risk Management has determined that conservation and protection measures and objectives have been identified for 100% of aquatic species listed under the Species at Risk Act (SARA). This greatly surpassed the target of 80% for 2010-11.
Although the program remains focused on managing and delivering the Species at Risk program, resource shortages have meant that despite some improvement and best efforts, the program is still not able to address 100% of its legal obligations under SARA; one third of mandatory recovery documents are still not being developed within legislated timelines.
Lessons Learned
The results achieved indicate that this program continues to make improvements in meeting both its program objectives and legal obligations. Ongoing review and revision of existing processes will ensure that the program is successful in meeting all of its objectives.
Program Sub-activities
Species at Risk Management is delivered through three sub-activities, as indicated in the Program Activity Architecture. Performance information for these sub-activities is available on the DFO website (http://www.dfo-mpo.gc.ca/dpr-rmr/2010-11/toc-tdm-eng.html).
Program Activity 4: Science for Healthy and Productive Aquatic Ecosystems
Description from Main Estimates: This program provides research, monitoring, advice, products and services and data management to ensure departmental and federal policies, programs, decisions, and regulations associated with the integrated management of Canada's oceans and fish habitat resources are informed by science advice. The science is undertaken through a network of research facilities, in collaboration with other government departments, private sector, academia and international organizations.
Financial and Human Resources for 2010-11
| Financial Resources ($ millions) | Human Resources (FTEs) | ||||
|---|---|---|---|---|---|
| Planned Spending | Total Authorities | Actual Spending | Planned | Actual | Difference |
| 56.0 | 57.1 | 53.4 | 489 | 440 | -49* |
Performance Measurement
| Expected Results |
Performance Indicators |
Targets | Performance Status |
Performance Rating |
|---|---|---|---|---|
| Comprehensive understanding of living aquatic ecosystem function for decision-makers to help ensure healthy and productive aquatic ecosystems | Number of Canadian publications on aquatic ecosystem function that are authored/co-authored by DFO Science | Maintain 5-year average (2006-11) | 183 published papers were produced in 2009, slightly below the 5-year average of 191* | |
| Number of DFO Science publications on aquatic ecosystem function that are cited | Maintain 5-year average (2006-11) | Average number of citations of papers published on aquatic ecosystems between 2005 and 2009 was 497 per year (between 2004 and 2008, DFO Science papers were cited more often than the world average 4 years out of the 5)* | |
|
| Number of Canadian Science Advisory Secretariat (CSAS) publications on aquatic ecosystem function that are posted on the DFO Science website | Maintain 5-year average (2006-11) | Produced 148 CSAS publications that are posted on the DFO Science website, approximately 50% above the 5 year average of 74 | |
Performance Highlights
- Provided advice in support of decision-making requirements related to the impacts of development on fish habitat and mitigation measures by:
- Developing a comprehensive bibliography and drafting pathways of effects diagrams describing the potential impacts of renewable energy extraction, including wind, wave and tidal power, on the marine environment. These diagrams will be examined in a CSAS peer-review meeting this fiscal year.
- Completing a research document summarizing the impacts of ship-generated noise on aquatic environments, including fish, invertebrates, and marine mammals. This document will be reviewed through a CSAS peer-review this year.
- Holding two joint workshops involving scientists and Habitat managers to identify knowledge gaps and research needs, leading to a workplan to develop monitoring protocols for mitigation and compensation measures.
- Improved ocean forecasting capabilities with the development of a global ice-ocean forecasting system based on the Nucleus for European Modelling of the Ocean17 modelling framework and advanced work on a second model that integrates sea surface temperature, ice analysis, and Canadian Meteorological Centre data.
- Improved our knowledge of hypoxia and ocean acidification by completing Phase 1 of the Climate Change Science Initiative. This knowledge is being applied to the management of the fishery (e.g., snow crab/hypoxia) and policy issues (e.g., Arctic Council Ocean Acidification Assessment). Similarly, the Department continues to provide scientific advice to Environment Canada in its lead role as representatives to the London Convention/London Protocol. Internationally, the London Convention and London Protocol are regarded as the global instruments with the appropriate authority to manage ocean fertilization.
Performance Summary and Analysis
In 2009 (the most recent year for which data is available), DFO Science produced 183 papers on aquatic ecoystems; this represents a slight decrease of approximately 4% when compared with the Department's five-year average. Approximately 58% of these papers were written in collaboration with other key players in Canada's research community (e.g., universities and the private sector). An indication of the value of the Department's contribution to the state of knowledge on aquatic ecosystems is the number of citations to its papers relative to the average number of citations received by world papers on the subject. Between 2004 and 2008, DFO Science papers on aquatic ecosystems were cited more often than the world average 4 years out of the 5.18
Canadian Science Advisory Secretariat (CSAS) coordinates the peer review of scientific issues for DFO. In 2010-11, CSAS produced and posted on the Internet 148 publications (science advisory reports, research documents, proceedings, and science responses) in response to advisory needs identified by internal clients. These publications are available on the CSAS website. As evidenced by the graph, science support to decision-making requirements associated with the Department's Healthy and Productive Aquatic Ecosystems strategic outcome continues19 to increase. This represents a 70% increase since 2006-07 and is approximately 50% above the five-year average of 74 publications. This increase reflects, among other things, the diversification of advisory requirements associated with the Oceans Act and the Species at Risk Act, as well as the Science program's ongoing transition to a multi-discplinary ecosystem-science-based approach.
Lessons Learned
Balancing the requirements for science advice in support of the Department's longstanding mandate (e.g., the Fisheries Act) and more recent legislation (e.g., Oceans Act, Species at Risk Act) is a challenge. This emphasizes the need for a systematic, risk-based approach to priority-setting in determining which advisory requests are serviced in a given fiscal year.
Program Sub-activities
Science for Healthy and Productive Aquatic Ecosystems is delivered through four sub-activities, as indicated in the Program Activity Architecture. Performance information for these sub-activities is available on the DFO website (http://www.dfo-mpo.gc.ca/dpr-rmr/2010-11/toc-tdm-eng.html).
Internal Services
Description from Main Estimates: Internal Services are groups of related activities and resources that are administered to support the needs of programs and other corporate obligations of an organization. These groups are: Management and Oversight Services; Communications Services; Legal Services; Human Resources Management Services; Financial Management Services; Information Management Services; Information Technology Services; Real Property Services (including Safety and Security Services and Office of Environmental Coordination); Materiel Services; Acquisition Services; and Travel and Other Administrative Services. Internal Services include only those activities and resources that apply across an organization and not to those provided specifically to a program.
Financial and Human Resources for 2010-11
| Financial Resources ($ millions) | Human Resources (FTEs) | ||||
|---|---|---|---|---|---|
| Planned Spending | Total Authorities | Actual Spending | Planned | Actual | Difference |
| 354.0 | 384.9 | 371.2 | 1,937 | 1,908 | -29 |
Performance Highlights
- Improved overall ratings for Round VIII of the Management Accountability Framework 20(three Areas of Management were rated Strong, 11 were rated Acceptable, and one was rated Opportunity for Improvement).
- Continued implementation of the 2009 Policy on Evaluation, which is on its way to full implementation by March 31, 2013, as per the Policy's requirements.
- Received Treasury Board approval for DFO's Policy on Investment Planning in February 2011, and implemented essential management practices to support effective investment planning and management of projects. DFO's efforts in the investment planning area were recognized by Treasury Board Secretariat when DFO received the highest rating given for an Organizational Project Management Capacity Assessment.
- Implemented the One-Pass Planning process, which integrates business planning and a number of other planning processes (including human resources, risk management, and investment planning) into a single synchronized process. This has resulted in a more streamlined and simplified process with better alignment of current and future business needs.
- Provided human resource support to the Canadian Coast Guard in its move toward standardizing organizations across the country, and to DFO sectors in implementing national structures.
- Consolidated Internet gateways, resulting in improvements in the security and infrastructure of information technology.
- Continued to use Government of Canada shared services including signing a new wireless services contract that will potentially create savings of more than $700,000 annually for the Department.
- Conducted a successful pilot of desktop video-conferencing that will allow the Department to put in place an implementation schedule for this efficiency-enhancing and environmentally-beneficial technology.
|
Canada's Economic Action Plan …
|
Performance Summary and Analysis
Each year, Treasury Board Secretariat (TBS) assesses the management performance of government departments through the Management Accountability Framework (http://www.tbs-sct.gc.ca/maf-crg/index-eng.asp). In Round VIII of the Management Accountability Framework (MAF) assessment, DFO achieved a rating of Strong for three of the 15 areas of management assessed: Values-based Leadership, Internal Audit, and Information Technology. One area of management was rated as opportunity for Improvement: Asset Management. The remaining 11 areas of management received ratings of Acceptable.
DFO's performance has improved in four areas since Round VII: Values-Based Leadership and Organizational Culture, Effectiveness of Internal Audit Function, Quality and Use of Evaluation and Citizen-focused Service.
TBS identified two areas for particular focus over the next year: Effectiveness of Asset Management and Quality and Use of Performance Information.
Lessons Learned
In response to its MAF assessment, DFO has developed work plans to address all recommendations and opportunities identified by TBS. In accordance with TBS's request, DFO will be focusing on Effectiveness of Asset Management and Quality and Use of Performance Information.
Section III: Supplementary Information
Financial Highlights
The financial information presented is intended to serve as a general overview of Fisheries and Oceans' financial position and operations.
| % Change | 2010-11 | 2009-10 | |
|---|---|---|---|
| Total Assets | 5.6% | 2,919,249 | 2,764,569 |
| Total Liabilities | 5.8% | 674,663 | 637,565* |
| Equity of Canada | 5.5% | 2,244,586 | 2,127,004* |
| Total | 5.6% | 2,919,249 | 2,764,569 |
| % Change | 2010-11 | 2009-10 | |
|---|---|---|---|
| Total Expenses | 2.4% | 2,034,161 | 1,985,815 |
| Total Revenues | -5.4% | 93,322 | 98,690* |
| Net Cost of Operations | 2.8% | 1,940,839 | 1,887,125 |
Under Canada's Economic Action Plan (EAP), Fisheries and Oceans Canada has invested over two years in projects and programs such as Small Crafts Harbours, Canadian Coast Guard, and laboratories and science facilities. The EAP caused a significant but temporary increase in activity for the Department in 2009-10 and 2010-11. Much of the investment under this initiative is reflected in DFO's financial statements. The increase in assets, liabilities, and expenses is mainly associated with Canada's Economic Action Plan.
Total assets were $2,919 million at the end of 2010-11, an increase of $155 million or 5.6% over the previous year's total assets of $2,765 million. Tangible Capital Assets comprised 88% of total assets.
Total liabilities were approximately $675 million at the end of 2010-11, an increase of 5.8% when compared to the previous year.
Total expenses were $2,034 million at the end of 2010-11, an increase of 2.4% when compared to the previous year.
Financial Statements
For more information, see DFO's financial statements at http://www.dfo-mpo.gc.ca/dpr-rmr/2010-11/fin-eng.html.
List of Supplementary Information Tables
All electronic supplementary information tables found in the 2010-11 Departmental Performance Report can be found on the Treasury Board of Canada Secretariat's website at: http://www.tbs-sct.gc.ca/dpr-rmr/2010-2011/index-eng.asp.
- Details on Transfer Payment Programs
- Green Procurement
- Horizontal Initiatives
- Internal Audits and Evaluations
- Sources of Respendable and Non-Respendable Revenue
- Status Report on Major Crown Projects
- Summary of Capital Spending by Program Activity
- Up-front Multi-year Funding
- User Fees
Section IV: Other Items of Interest
Website References
Contact for further information
Fisheries and Oceans Canada
Communications Branch
200 Kent Street
13th Floor, Station 13E228
Ottawa, Ontario
K1A 0E6
Telephone: 613-993-0999
Facsimile: 613-990-1866
Email: info@dfo-mpo.gc.ca
1 http://www.tbs-sct.gc.ca/pol/doc-eng.aspx?id=18218§ion=text
2 http://www.tbs-sct.gc.ca/rpp/2010-2011/inst/dfo/dfo00-eng.asp
3 Priority Type is defined as: New – introduced during this planning period; Previously committed to – introduced either one or two years before this planning period; Ongoing – introduced at least three years prior to this planning period; or Revised – similar to a priority in the previous planning period.
4 As of May 2011, the department's name has changed to Aboriginal Affairs and Northern Development Canada.
5 http://www.dfo-mpo.gc.ca/fm-gp/sustainable-durable/fisheries-peches/framework-eng.htm
6 The Fisheries Checklist is an internal qualitative monitoring tool to measure the Department's progress in increasing the overall sustainability capacity of major fish stocks. The Checklist gathers information on biodiversity, conservation and protection, governance, habitat and ecosystems, harvest tools, stock information, stock assessment, and status of the overall fish stock.
7 http://www.dfo-mpo.gc.ca/fm-gp/peches-fisheries/fish-ren-peche/lobster-homard/alsm-mdih-eng.htm
8 http://www.dfo-mpo.gc.ca/fm-gp/peches-fisheries/ifmp-gmp/index-eng.htm
9 http://www.dfo-mpo.gc.ca/decisions/index-eng.htm
10 http://www.dfo-mpo.gc.ca/fm-gp/peches-fisheries/comm/sharing-partage/index-eng.htm
11 http://www.dfo-mpo.gc.ca/oceans/marineareas-zonesmarines/mpa-zpm/index-eng.htm
12 Flag state is the state under whose laws the vessel is registered or licensed. The flag state has the authority and responsibility to enforce regulations over vessels registered under its flag. This global instrument is intended to develop criteria for assessing the performance of flag states, as well as to examine possible actions against vessels flying the flags of states not meeting such criteria.
13 http://www.dfo-mpo.gc.ca/rpp/2011-12/index-eng.htm
14 http://www.dfo-mpo.gc.ca/fm-gp/sustainable-durable/fisheries-peches/framework-eng.htm
15 http://www.dfo-mpo.gc.ca/csas-sccs/index-eng.htm
16 http://www.dfo-mpo.gc.ca/oceans/marineareas-zonesmarines/mpa-zpm/index-eng.htm
18 Source: Science-Metrix Inc.