ARCHIVED - Human Resources and Skills Development - Report
 This page has been archived.
Archived Content
Information identified as archived on the Web is for reference, research or recordkeeping purposes. It has not been altered or updated after the date of archiving. Web pages that are archived on the Web are not subject to the Government of Canada Web Standards. As per the Communications Policy of the Government of Canada, you can request alternate formats on the "Contact Us" page.
2010-11
Departmental Performance Report
Human Resources and Skills Development Canada
The original version was signed by
The Honourable Diane Finley, P.C., M.P.
Minister of Human Resources and Skills Development
The Honourable Lisa Raitt, P.C., M.P.
Minister of Labour
Table of Contents
Ministers' Messages
- Message from the Minister of Human Resources and Skills Development
- Message from the Minister of Labour
Section I - Organizational Overview
- 1.1 Raison d'�tre
- 1.2 Responsibilities
- 1.3 Strategic Outcomes and Program Activity Architecture
- 1.4 Organizational Priorities
- 1.5 Risk Analysis
- 1.6 Summary of Performance
- 1.7 Expenditure Profile
- 1.8 Estimates by Vote
Section II - Analysis of Program Activities by Strategic Outcome
- 2.1 Strategic Outcome 1: A skilled, adaptable and inclusive labour force and an efficient labour market
- 2.2 Strategic Outcome 2: Safe, fair and productive workplaces and cooperative workplace relations
- 2.3 Strategic Outcome 3: Income security, access to opportunities and well-being for individuals, families and communities
- 2.4 Strategic Outcome 4: Service Excellence for Canadians
- 2.5 Internal Services
- 2.6 Summary of HRSDC’s Contributions to Canada’s Economic Action Plan
Section III - Supplementary Information
Section IV Other Items of Interest
Minister's Message
Message from the Minister of Human Resources and Skills Development

I am pleased to present Human Resources and Skills Development Canada's Departmental Performance Report which identifies progress made on the priorities outlined in the 2010-2011 Report on Plans and Priorities.
In 2010–2011, our government continued to deliver key elements of the second phase of Canada’s Economic Action Plan, helping hundreds of thousands of Canadians, investing in the key drivers of economic growth – innovation, investment, education and training. Through the creation of jobs and support to families and communities, we are fostering an environment in which all Canadians can contribute to, and benefit from, our country’s continued economic recovery.
Human Resources and Skills Development Canada provided targeted help for those most adversely affected by these challenging economic times. Extended Employment Insurance benefits, including the Work-Sharing Program, and improvements to the Wage Earner Protection Program helped many Canadians during difficult times. Our partnerships with employers, the provinces and territories helped Canadian workers access information, skills and training to meet the changing demands for the jobs of tomorrow. For example, the Working in Canada tool provided more than two million people with regional and national labour market information to help them make decisions about their future.
At the same time investments provided opportunities for Canadians to upgrade their skills. In continuing to provide additional incentives for Canadians to participate in and complete apprenticeships, our government issued over 77,000 Apprenticeship Grants to apprentices completing their certification in the Red Seal trades. Education plays an important role in preparing for job opportunities, both now and in the future. In support of post-secondary education, we completed implementation of the Canada Student Grants Program and the Repayment Assistance Plan, broadening the financial assistance available to students.
Service excellence remained at the forefront for Service Canada with more than $87 billion in Employment Insurance, Canada Pension Plan and Old Age Security benefits delivered to Canadians. Despite the higher demand for services, processing improvements and other measures continued to allow Service Canada to meet the needs of Canadians in a timely and responsive manner. In addition, Canadians were encouraged to use direct deposit as a more reliable, secure, confidential, and sustainable way to receive benefits.
As Minister of Human Resources and Skills Development, I am proud of how we have helped give Canadians the tools they need to take advantage of the jobs of tomorrow, how we have supported Canadian families and communities, and how we have invested in innovation, education and training. Human Resources and Skills Development Canada will continue to support Canadians as the economy recovers.
__________________________________________________
The Honourable Diane Finley, P.C., M.P.
Minister of Human Resources and Skills Development
Message from the Minister of Labour

I am pleased to sign the 2010-2011 Departmental Performance Report, which presents the achievements of the Labour Program.
The Labour Program is a key player in supporting a strong Canadian economy. It works to protect Canadian workers and employers by strengthening labour-management relations, and by developing Canadian national occupational health and safety standards that reflect industry best practices in Canada and around the world. It also plays a leadership role in international labour affairs.
In 2010–2011, the Labour Program offered more preventive mediation services aimed at resolving workplace differences and improving labour relations. And we are pleased to note that 94% of collective bargaining disputes were settled without a work stoppage last year. Minimizing labour disruptions is crucial in bringing stability to these difficult economic times.
The Labour Program also played an important role in Canada's Economic Action Plan through the Wage Earner Protection Program, as significant and permanent changes were made to the Wage Earner Protection Program Act to include protection for employee severance and termination pay.
Additionally, we implemented the results of the Strategic Review, conducted in 2009, which confirmed very clearly the relevance of our mandate, while highlighting the need for us to be more effective and efficient in service delivery and resource management. Consequently, we developed and implemented an agenda aimed at modernizing our service delivery, ensuring efficiency and attaining service excellence through continuous improvement.
Moving forward, the Labour Program will continue to ensure that workplaces of the future are safe, fair and productive. In support of this aim, we will continue to conduct round-table discussions across the country. These round tables afford us an opportunity to hear from leaders representing all sides of an issue in an effort to assist in the formation of government policy and possible legislative/regulatory changes.
We will follow through on our international mandate. This means implementing labour cooperation agreements, representing Canada in multilateral forums and negotiating international labour standards that advance Canadian interests and values of respect for workers’ rights around the globe.
This year’s Departmental Performance Report demonstrates yet again the Labour Program’s commitment to help Canadians prosper and contribute to a productive work environment.
__________________________________________________
The Honourable Lisa Raitt, P.C., M.P.
Minister of Labour
Section I - Organizational Overview
1.1 Raison d'�tre
The mission of Human Resources and Skills Development Canada (HRSDC) is to build a stronger and more competitive Canada, to support Canadians in making choices that help them live productive and rewarding lives, and to improve Canadians' quality of life.
1.2 Responsibilities
To fulfill its mission, HRSDC is responsible for:
- supporting a flexible, national labour market;
- increasing participation in the labour force;
- removing barriers to post-secondary education attainment and skills development;
- overseeing federal labour responsibilities;
- providing income support to seniors, families with children and Employment Insurance beneficiaries; and
- delivering other Government of Canada programs and services.
Included in these core roles are responsibilities for the design and delivery of some of the Government of Canada's most well-known statutory programs and services, including:
- Old Age Security;
- the Canada Pension Plan;
- Employment Insurance;
- Canada Student Loans and Grants;
- Canada Education Savings Program;
- the National Child Benefit; and
- the Universal Child Care Benefit.
These direct benefits to Canadians are part of Canada's social safety net and represent almost 95% of the Department's expenditures.
Through Service Canada, HRSDC is the face of the Government of Canada for many Canadians, helping them access HRSDC programs and other Government of Canada programs and services at more than 600 points of service across the country. In addition to in-person services, the organization serves the needs of Canadians online at www.servicecanada.gc.ca, and by telephone through 1 800 O Canada and its integrated network of call centres.
The Department, through the Labour Program, also oversees federal labour responsibilities. This includes labour laws, occupational health and safety, labour relations and mediation services in federally regulated workplaces, representation of Canada in international labour organizations, and negotiation of labour cooperation agreements as part of free trade negotiations.
Finally, through grants and contributions, HRSDC provides funding to other levels of government, the voluntary and private sectors, employers, unions, educators, and community organizations to support projects that meet the labour market and social development needs of Canadians.
1.3 Strategic Outcomes and Program Activity Architecture
Human Resources and Skills Development Canada Program Activity Architecture
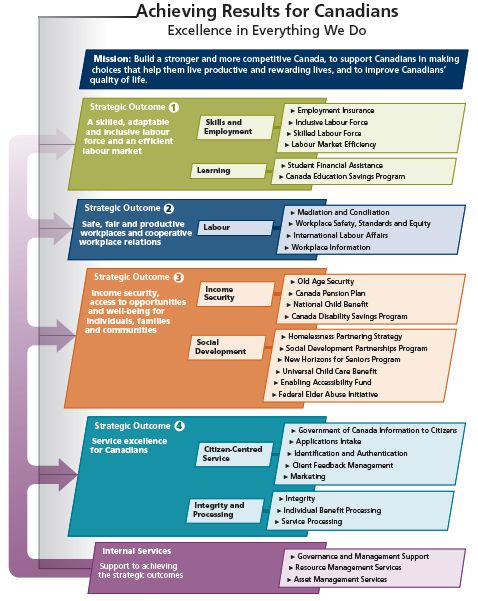
The HRSDC Program Activity Architecture (PAA) is a representation of the programs offered by HRSDC and the results (strategic outcomes) that the programs are designed to achieve for Canadians. The PAA also includes a program activity for services that are internal to the Department and are important in supporting the achievement of HRSDC's four strategic outcomes
Text description of Achieving Results for Canadians
The full HRSDC Program Activity Architecture is available at: http://www.hrsdc.gc.ca/eng/publications_resources/dpr/paa/paa.shtml
1.4 Organizational Priorities
HRSDC successfully met the objectives of all of its priorities outlined in the 2010-2011 Report on Plans and Priorities.
| Priority | Strategic Outcome(s) and/or Program Activity(ies) |
|---|---|
| Supporting the changing needs of Canadian workers and employers | Link to Strategic Outcomes Strategic Outcome 1: A skilled, adaptable and inclusive labour force and an efficient labour market |
| Status | |
| HRSDC assisted unemployed workers through enhancements to the Employment Insurance Act and the introduction of new active employment measures as part of the second year of Canada's Economic Action Plan (EAP). These measures assisted Canadians by providing targeted help to those adversely
affected by the recession, including Aboriginal people, youth and older workers. For full reporting on the EAP, visit www.actionplan.gc.ca. Strengthening of particular Employment Insurance (EI) measures helped Canadians during a period of high unemployment. As an example, Bill C-10 (Budget Implementation Act, 2009) extended the duration of EI regular benefits by five weeks for all claimants and Bill C-50 (An Act to amend the Employment Insurance Act and to increase benefits) provided up to 20 more weeks of regular benefits to long-tenured workers. In addition, vulnerable workers (including persons with disabilities, youth, Aboriginal people and recent immigrants) and workers in transition were supported in their efforts to find jobs and increase their participation in the labour market. A number of other key legislative and regulatory initiatives for the EI program were also implemented including Bill C-56 (Fairness for the Self-Employed Act) and Bill C-13 (Fairness for Military Families (Employment Insurance) Act). Additionally, extensions were also implemented to the Best 14 Weeks and the Working While on Claim EI pilot projects. The Department's partnerships with employers, the provinces and territories played a key role in improving the preparedness of Canadian workers to meet the evolving demand for skills in the labour market. For instance, in working with the provinces and territories, the Department was successful in implementing a framework for Foreign Credential Recognition (FCR), which took into consideration the gaps in practices and processes identified in target occupations. Revamping and consolidating Labour Market Information (LMI) tools, services and resources, including streamlining the delivery of e-products such as specialized information for FCR and the introduction of new audience-specific content, has improved access to LMI. As well, apprenticeship grants–part of a suite of federal supports to apprentices and the skilled trades–increased access to the skilled trades, encouraged progression within an apprenticeship program, and promoted completion and certification in the 52 Red Seal trades. The Department also successfully completed various activities to improve supports for individuals pursuing post-secondary education, including completing implementation of the Canada Student Grants Program, the Repayment Assistance Plan and the Repayment Assistance Plan for Borrowers with Permanent Disabilities. Work continued to implement the Service Delivery Vision for the Canada Student Loans Program, enabling the Department to put in place the first Master Student Financial Assistance Agreement in the province of British Columbia. Discussions with other interested provincial and territorial partners to pursue additional Service Delivery Vision initiatives are ongoing. |
|
| Priority | Strategic Outcome(s) and/or Program Activity(ies) |
|---|---|
| Helping Canadian workers and employers maintain workplace safety, fairness, and productivity, and cooperative workplace relations | Link to Strategic Outcomes Strategic Outcome 2: Safe, fair and productive workplaces and cooperative workplace relations |
| Status | |
| Supporting national economic growth and ensuring Canada succeeds in an increasingly competitive global economy is an important government priority. Meeting the needs of parties involved in resolving workplace disputes and mitigating the risk of work stoppages in key industries takes on increased importance in the current economic context. The Preventive Mediation Program is used by unions and management to assist them in building better relationships that translate into better relations at negotiation tables, helping to prevent costly work stoppages. The Labour Program endeavoured to deliver more preventive mediation sessions, thereby improving results and fostering better labour management relations. These efforts are expected to translate into fewer work stoppages and decreased productivity loss, bringing stability to a period of slow economic growth. As part of the EAP, changes were made to the Wage Earner Protection Program Act to include protection for employee severance and termination pay. On the international stage, the Labour Program led the negotiation and implementation of labour cooperation agreements, which are part of each free trade agreement and protect Canadian companies and workers from foreign competitors who may be tempted to gain unfair advantages by ignoring fundamental labour standards. The Labour Program also represented Canada in multilateral forums where labour matters were discussed, such as the International Labour Organization and the inter-American Conference of Ministers of Labour, and negotiated international labour standards that advanced Canadian interests and values abroad. |
|
| Priority | Strategic Outcome(s) and/or Program Activity(ies) |
|---|---|
| Providing income security, access to opportunities and support for the well-being of Canadians, their families and communities | Linked to Strategic Outcomes Strategic Outcome 3: Income security, access to opportunities and well-being for individuals, families and communities |
| Status | |
| In 2010-2011, the Department provided timely statutory benefits for millions of Canadians through the administration of Canada's national pension programs. Both the Canada Pension Plan (CPP) and Old Age Security (OAS) helped individuals and families by contributing to a
stable income for eligible recipients. The Department implemented Bill C-31 (Eliminating Entitlements for Prisoners Act) in December 2010. The new provisions of this bill placed limits on the payment of OAS benefits to beneficiaries by suspending their OAS benefits (pension, Guaranteed Income Supplement, Allowance and Allowance for the Survivor) while they are incarcerated in a federal penitentiary, generally serving a sentence of two years or more. Agreements are being pursued with the provinces and territories which would suspend payments to individuals who are incarcerated serving a term exceeding 90 days in a prison in that jurisdiction. HRSDC began implementing changes to the CPP in January 2011 as a result of Bill C-51 (Economic Recovery Act (stimulus)). The proposed changes to the CPP better reflect the way Canadians now live, work and retire, recognizing that retirement is often a process that occurs in stages, rather than a one-time event. The enhancements provide greater flexibility for older workers to combine pension and work income if they wish, modestly expand pension coverage, and improve fairness in the Plan's flexible retirement provisions. These changes ensure that the CPP will remain fair and sustainable as it responds to the evolving needs of Canada's aging population, the changing economy and the labour market. The Department continued to support programs for the homeless or those at risk of becoming homeless, as well as programs for children, families, seniors, communities, and people with disabilities. HRSDC provided these groups with the knowledge, information, and opportunities to move forward with their own solutions to social and economic challenges. |
|
| Priority | Strategic Outcome(s) and/or Program Activity(ies) |
|---|---|
| Sustaining the delivery of responsive, quality government information, programs and services | Link to Strategic Outcomes Strategic Outcome 1: A skilled, adaptable and inclusive labour force and an efficient labour market Strategic Outcome 2: Safe, fair and productive workplaces and cooperative workplace relations Strategic Outcome 3: Income security, access to opportunities and well-being for individuals, families and communities Strategic Outcome 4: Service excellence for Canadians |
| Status | |
| In 2010-2011 HRSDC managed close to 123.8 million citizen service contacts with clients, compared to approximately 118.5 million in 2009-2010. This included 13.8 million service requests made by clients at Service Canada in-person locations, 1.9 million calls answered by 1 800 O-Canada agents, 9.8 million calls answered by an EI, OAS, or CPP agent,
31.3 million calls resolved in the interactive voice response system of the call centre network, and 67 million visits to the Service Canada website. The delivery of temporary measures under the EAP remained a priority in 2010-2011, and more than $87 billion in EI, OAS and CPP benefits were delivered to Canadians. By year's end, a total of 2.9 million EI claims had been filed, 12.3% more than the number of claims recorded prior to the economic downturn. The Department achieved its EI speed of payment target for 19 consecutive months with a fiscal year average of 83.9% nationally. In 2010-2011, CPP and OAS issued over 112 million payments to beneficiaries. CPP delivered $31.6B in benefits to approximately 4.7 million beneficiaries while $35.7B in OAS benefits were delivered to more than 4.8 million beneficiaries. During the 2010-2011 fiscal year, more than 3.02 million CPP and OAS applications were processed. Service Canada mailed over 10 million forms and letters including CPP and OAS taxation slips, statements of contributions, notices of entitlement letters and applications for benefits. The speed of payment measures for both the CPP Retirement and OAS Basic pensions has been met or exceeded consistently every month since the 2004-2005 fiscal year. In addition, HRSDC was able to yield substantial savings for the federal government in 2010-2011 by identifying and subsequently discontinuing benefits that were issued as a result of suspected fraud or abuse of EI, CPP, and OAS programs. The Department's integrated approach to service delivery leverages the strengths of each individual service channel (Internet, telephone, in-person, and mail/fax). Focusing on a coordinated approach to service delivery enabled the Department to meet citizens' demands for responsive, quality government information, programs and services. This was particularly evident in the Department's delivery of its commitments under the EAP, its maintenance of a high level of performance over the short and medium term and the promotion of easy-to-access tools such as the Benefits Finder, Record of Employment Web, My Service Canada Account, Finding a Job, and the Canada Retirement Income Calculator. The Department remains attuned and responsive to the needs of citizens through regular research and analysis of citizen feedback. A service improvement initiative addressed the needs and demands of citizens by responding directly to feedback collected through various tools, such as comment cards, Web comment forms, and the Office for Client Satisfaction. Service Canada continues to look to ways to decrease the environmental impact within the processing operation. Active promotion of direct deposit as a more reliable, secure, confidential and environmentally sustainable way to receive payments is ongoing. Recent updates to the Tax Information Slips Online service will mean that CPP clients and agents on the phone will now be able to access amendment and duplicate tax slips online decreasing the demand for hard copy versions. In addition, the demand for Personal Access Codes required to access online systems, increased by 19.5% in 2010-2011 over the previous year. Internally, the Department invested in the design and delivery of training programs that strengthened the knowledge and skills of employees involved in the delivery of the Department's programs and service offerings. Front-line staff were also given the tools required to effectively meet the needs of Canadians during their first interaction with the Department. For example, these officers can now complete direct deposit requests from CPP/OAS clients and provide information on the status of their pension application. |
|
| Priority | Strategic Outcome(s) and/or Program Activity(ies) |
|---|---|
| Continuing to enhance departmental management excellence and accountability | Link to Strategic Outcomes Strategic Outcome 1: A skilled, adaptable and inclusive labour force and an efficient labour market Strategic Outcome 2: Safe, fair and productive workplaces and cooperative workplace relations Strategic Outcome 3: Income security, access to opportunities and well-being for individuals, families and communities Strategic Outcome 4: Service excellence for Canadians |
| Status | |
| Public Service Renewal is a key priority for the Department and was supported through the 2010-2011 Renewal Action Plan and three priorities: Creating a Healthy Workplace; Strengthening and Enabling Leadership; and Investing in Career Development. The Department completed a review of key corporate services in the areas of finance, human resources and informatics which will lead to the renewal of departmental systems and an integrated enterprise approach to internal service delivery. The various projects underway will achieve the goals of enhancing service delivery excellence, facilitating effective stewardship, and obtaining greater value for money in internal systems. Progress was achieved advancing departmental governance to oversee the effective management of assets and project investments. In addition, a departmental Information Technology (IT) Asset Plan was completed, establishing a profile of the Department's current IT assets in terms of operating costs, support for business needs, and operating risks. Information management was supported through the development of an action plan to address related departmental infrastructure, and the creation of an Information Management (IM) Strategy to promote a shared understanding of the importance and future direction for IM as well as providing employees with the necessary tools and resources. |
|
1.5 Risk Analysis
The Department identified and addressed three risk areas: employee demographics and skills, information technology infrastructure and service delivery.
Employee Demographics and Skills
The Department's workforce continued to be affected by the same demographic trends as the rest of the Canadian population. An aging workforce, combined with high levels of turnover, resulted in increased pressure to manage organizational renewal and change in a systematic manner. One of the ways the Department is addressing this risk is through its continued support for Public Service Renewal. The following initiatives have been put in place in order to support Public Service Renewal and build a healthy, enabled workplace and workforce with strong executive and managerial leadership:
Leadership
The first portfolio-wide executive leadership conference was held in May 2010, followed by discussion of future leadership requirements in an environment of greater fiscal restraint. To foster strong leadership in the Department, an executive integrated talent and performance management/succession planning process was developed. Human resource planning at the executive level is focused on the competencies required for an evolving work environment.
Effective people management is the cornerstone of building a healthy and enabled workforce. The development of people management dashboards and the development of a human resources policy framework lays the foundation for evidence-based decisions based on clear accountabilities, roles and responsibilities. Combined with the development of an integrated human resource staffing process, managers have the tools they need to develop integrated business and human resources plans, supporting improved performance in both people management and leadership.
Workplace
HRSDC has developed a Healthy and Enabling Workplace Strategy to provide a safe work environment that encourages performance and productivity through leadership that is grounded in core public service values. The Department has also developed a mentoring framework in order to build the organization's capacity to transfer knowledge and create a sense of community.
In conjunction with these efforts, the Department has established learning paths for employees and ensured curricula are aligned with new programs, services and work conditions to help sustain a multi-skilled and flexible workforce able to address current and future business priorities.
Workforce
As part of its efforts to ensure the Department has the right people in the right jobs, at the right time, a three-year post-secondary recruitment strategy was implemented, resulting in 178 post-secondary hires. In addition, a Student Bridging Inventory was launched and a multi-year diversity and employment equity plan was developed and approved. A Workforce Management Strategy has also been developed to support effective people management through the Department's coming transformation while demonstrating transparency and fairness to employees.
Information Technology Infrastructure
HRSDC's aging IT infrastructure limited the Department's capacity to implement new and innovative approaches to business processes. To address this, the Department has established a long-term funding strategy that will provide a sustainable, annual source of funds for the needed replacement of assets.
To address the reliance of the Department's key systems and applications on older technologies, monitoring of mission-critical systems has been improved in order to ensure business continuity and, in certain cases, upgrades have been made to hardware to enhance performance. Where possible, backups of critical applications have been made to speed disaster recovery, and plans have been developed to ensure that commercially available components (e.g. operating systems, hardware, and developer tools) are available on short notice from suppliers. Lastly, the Department began to consolidate and streamline the application portfolio so that similar business requirements can be addressed by common solutions while at-risk systems are being replaced with "off the shelf" solutions wherever possible.
Service Delivery
Although the economic recovery is progressing, the Department continued to experience high levels of demand for core services. Employment Insurance claim volumes were still significantly higher than volumes experienced prior to the economic downturn. Higher volumes of applications for Old Age Security and Canada Pension Plan were also evident in 2010-2011, highlighting the long-term demographic trend of an aging Canadian population.
The Department implemented a broad-based strategy to mitigate the risks created by these continuing demands on services. Through funding as part of EAP, the Department optimized its processing and service delivery operations across the country, extended hours of service for call centres, increased the number of staff, and improved Internet services to better enable citizen self-service.
EAP funding for meeting the increased demand in Employment Insurance claims wound down, as planned, on March 31, 2011. In the months leading up to this date, a strategy was developed to monitor potential risks and other key issues related to the winding down of investments. It was reviewed by departmental officials monthly, which allowed for early detection of issues and development of mitigation strategies.
1.6 Summary of Performance
2010-2011 Financial Resources ($ millions)
| Planned Spending | Total Authorities | Actual Spending |
|---|---|---|
| 102,134.6 | 101,686.6 | 101,467.2 |
2010-2011 Human Resources (FTEs)
| Planned | Actual | Difference |
|---|---|---|
| 27,457 | 24,388 | 3,069 |
| Performance Indicator | Target | 2010-2011 Performance |
|---|---|---|
| Employment ratio (Employed population as a percentage of the working-age population) Source: Labour Force Survey |
72.9% | Results: 2010-2011: 71.7% Historical results 2009-2010: 71.3% 2008-2009: 73.1% 2007-2008: 73.6% 2006-2007: 73.0% 2005-2006: 72.4% |
| Percentage of unemployed individuals eligible to receive benefits, among those who had a recent job separation that met EI program criteria Source: Employment Insurance Coverage Survey |
82.2% | Results: 2010: 83.9% Historical results: 2009: 86.2% 2008: 82.2% 2007: 82.3% 2006: 82.7% 2005: 83.4% |
| Percentage of the Canadian labour force (aged 25-64) that has attained a post-secondary education credential Source: Labour Force Survey |
65.5% | Results: 2010: 66.0% Historical results: 2009: 65.0% 2008: 64.3% 2007: 63.7% 2006: 62.8% 2005: 62.0% |
| Canada's OECD ranking for the percentage of its population with post-secondary education credentials Source: Organisation for Economic Co-operation and Development (OECD) |
1st place among OECD countries | Results: 2008 1st Historical results: 2007: 1st 2006: 1st 2005: 1st 2004: 1st 2003: 1st |
| Program Activity | 2009-2010 Actual Spending ($ millions) |
2010-2011 ($ millions) | Alignment to Government of Canada Outcomes | |||
|---|---|---|---|---|---|---|
| Main Estimates |
Planned Spending |
Total Authorities |
Actual Spending |
|||
| Skills and Employment | 23,765.6 | 2,317.3 | 24,794.4 | 25,225.0 | 25,034.7 | Income security and employment for Canadians |
| Learning | 2,466.7 | 2,486.3 | 2,493.5 | 2,928.5 | 2,921.1 | An innovative and knowledge-based economy |
| Total | 26,232.3 | 4,803.6 | 27,287.9 | 28,153.5 | 27,955.8 | |
| Performance Indicators | Target | 2010-2011 Performance |
|---|---|---|
| Percentage of collective bargaining disputes settled under Part I (Industrial Relations) of the Canada Labour Code without a work stoppage Source: Administrative Data |
90% | Result: 2010-2011: 94% Historical results: 2009-2010: 94% 2008-2009: 94% 2007-2008: 93% 2006-2007: 97% 2005-2006: 97% |
| Percentage of unjust dismissal complaints settled by inspectors under Part III (Labour Standards) of the Canada Labour Code Source: Administrative Data |
75% | Results: 2010-2011: 71% Historical results: 2009-2010: 71% 2008-2009: 73% 2007-2008: 76% 2006-2007: 74% 2005-2006: 74% |
| Percentage of money collected in relation to the amount found to be owed for complaints under Part III (Labour Standards) of the Canada Labour Code (excluding unjust dismissal complaints) Source: Administrative Data |
75% | Results: 2010-2011: 71.8% Historical results: 2009-2010: 72.1% 2008-2009: 78.6% 2007-2008: 66.4% 2006-2007: 75.1% 2005-2006: 77.7% |
| Percentage change, year over year, in the rate of lost time injuries and fatalities within the targeted higher risk federal jurisdiction industries Source: Administrative Data |
Decrease of 15% over a five year period (2009-2013) | Results: Not available until 2014 Historical results: 2005-2009: Decrease of 5.2% 2001-2005: Decrease of 20.5% Note: Disability Injury Incident Rate is measured over a fixed five-year period as it can fluctuate from year to year. |
| Program Activity | 2009-2010 Actual Spending ($ millions) |
2010-2011 ($ millions) | Alignment to Government of Canada Outcomes | |||
|---|---|---|---|---|---|---|
| Main Estimates |
Planned Spending |
Total Authorities |
Actual Spending |
|||
| Labour | 268.5 | 300.3 | 300.5 | 264.8 | 262.8 | A fair and secure marketplace |
| Total | 268.5 | 300.3 | 300.5 | 264.8 | 262.8 | |
| Performance Indicators | Targets | 2010-2011 Performance |
|---|---|---|
| Percentage of population able to purchase goods and services, which corresponds to a modest standard of living in Canada according to the Market Basket Measure (MBM)a Source: Survey of Labour and Income Dynamics, 2008 |
89.9% | Results: 2008: 90.5% Historical results: 2007: 89.9% 2006: 88.1% 2005: 87.6% 2004: 86.9% 2003: 86.8% Note: There is a three-year lag in the availability of data |
| a The MBM is a measure of low income based on the cost of a specified basket of goods and services. It measures the incidence, depth and persistence of low income nationally for all main age groups, and genders, as well as for the five groups at high risk of persistent low income (lone parents; unattached individuals aged 45-64; persons with work limiting disabilities; recent immigrants; and Aboriginal people in Canada living off reserve). | ||
| Program Activity | 2009-2010 Actual Spending ($ millions) |
2010-2011 ($ millions) | Alignment to Government of Canada Outcomes | |||
|---|---|---|---|---|---|---|
| Main Estimates |
Planned Spending |
Total Authorities |
Actual Spending |
|||
| Income Security | 65,199.8 | 36,917.5 | 68,843.1 | 67,434.1 | 67,430.8 | Income security and employment for Canadians |
| Social Development | 2,796.8 | 2,862.6 | 2,862.6 | 2,954.6 | 2,917.3 | A diverse society that promotes linguistic duality and social inclusion |
| Total | 67,996.6 | 39,780.1 | 71,705.7 | 70,388.7 | 70,348.1 | |
| Performance Indicators | Targets | 2010-2011 Performance |
|---|---|---|
| Percentage of clients whose service expectations were met Source: Administrative Data |
Baseline Year | Results: 2010-2011: 84% |
| Percentage of partner organizations whose service expectations were met Source: Administrative Data |
Baseline Year | Results: 2010-2011: Survey postponed Note: The survey for this indicator was postponed pending the re-alignment of the Department's service delivery model and its expected influence on our partnership agreements. |
| Program Activity | 2009-2010 Actual Spending ($ millions) |
2010-2011 ($ millions) | Alignment to Government of Canada Outcomes | |||
|---|---|---|---|---|---|---|
| Main Estimates |
Planned Spending |
Total Authorities |
Actual Spending |
|||
| Citizen-Centred Service | 531.1 | 495.2 | 556.0 | 536.1 | 520.9 | A transparent, accountable and responsive federal government |
| Integrity and Processing | 804.7 | 588.1 | 738.3 | 763.4 | 748.6 | A transparent, accountable and responsive federal government |
| Total | 1,335.8 | 1,083.3 | 1,294.3 | 1,299.5 | 1,269.5 | |
| (Financial Resources, [Gross], $ Millions) | 2009-2010 | ||||
|---|---|---|---|---|---|
| Actual Spending ($ millions) |
Main Estimates |
Planned Spending |
Total Authorities |
Actual Spending |
|
| Internal Services | 937.4 | 823.2 | 898.7 | 944.6 | 925.3 |
| Total | 937.4 | 823.2 | 898.7 | 944.6 | 925.3 |
1.7 Expenditure Profile
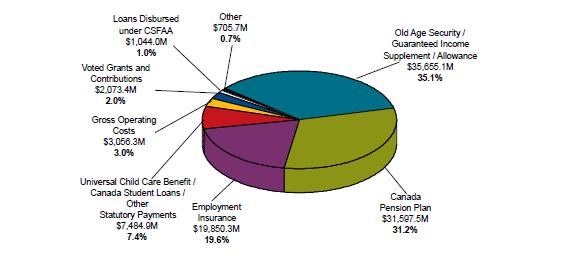
HRSDC expenditures on programs and services total more than $101 billion, of which almost $96 billion, or almost 95%, directly benefits Canadians through EI, the CPP, OAS, the Universal Child Care Benefit, loans disbursed under the Canada Student Financial Assistance Act and other statutory transfer payment programs. Departmental expenditures were $2.1 billion in voted grants and contributions and $2.6 billion for EI Part II.
Consolidated Total: $101,467.2 Million
| Human Resources and Skills Development Canada - Gross Expenditures (millions of dollars) | Statutory Transfer Payments (millions of dollars) | ||||
|---|---|---|---|---|---|
| Budgetary | Grants and Contributions | ||||
| Net Operating Costs | 1,135.7 | Old Age Security | 27,213.5 | ||
| Add Recoveries in relation to: | Guaranteed Income Supplement | 7,901.1 | |||
| Canada Pension Plan | 296.6 | Allowances | 540.5 | ||
| Employment Insurance Operating Account | 1,490.9 | Other Statutory Payments: | |||
| Worker's Compensation | 121.4 | EI Benefit Enhancement Meassures | 2,900.0 | ||
| Other | 11.7 | 1,920.6 | Universal Child Care Benefit | 2,651.2 | |
| Gross Operating Costs | 3,056.3 | Canada Student Loans | 991.3 | ||
| Voted Grants and Contributions | 2,073.4 | Canada Education Savings Grant | 670.6 | ||
| Total Gross Expenditures | 5,129.7 | Canada Diability Savings Program | 128.3 | ||
| Canada Learning Bond | 66.8 | ||||
| Wage Earner Protection Program | 31.9 | ||||
| Other - Workers' Compensation and EI/CPP Charges and Recoveries |
705.7 | Pathways to Education | 2.0 | 7,442.1 | |
| Non-Budgetary | Sub-Total | 43,097.2 | |||
| Loans disbursed under Canada Student Financial Assistance Act (CSFAA) | 1,044.0 | Canada Pension Plan Benefits | 31,597.5 | ||
| Employment Insurance Benefits | |||||
| Part I | 17,244.9 | ||||
| Part II | 2,605.4 | 19,850.3 | |||
| Other Specified Purpose Accounts | 42.8a | ||||
| Total Statutory Transfer Payments | 94,587.8 | ||||
| a This amount includes payments related to the Government Annuities Account, the Civil Service Insurance Fund and the Canada Millennium Scholarship Foundation Excellence Awards Fund. | |||||
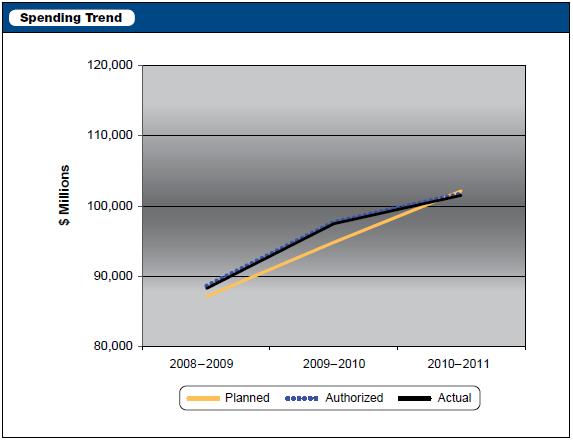
Departmental Spending Trend
The figure below illustrates HRSDC's spending trend from 2008-2009 to 2010-2011. In the 2010-2011 fiscal year, the Department spent $101.5 billion to contribute to achieving its expected results.
The 2008-2009 to 2010-2011 total authorized spending includes all parliamentary appropriation and revenue sources, Main Estimates and Supplementary Estimates. Planned spending corresponds to the forecasted planned spending presented in the Report on Plans and Priorities from each respective year.
In 2009-2010, actual expenditures were $9.1 billion (10.4%) higher than in 2008-2009. This increase can be mainly explained by a $3.6 billion increase in EI benefits and administrative costs due to the economic downturn, a $2.3 billion increase for initiatives announced in Canada's Economic Action Plan, a $1.4 billion increase in CPP benefits, and a $1.3 billion increase in OAS payments due to changes in the number of beneficiaries and the average monthly rate.
| EAPa | |||||
|---|---|---|---|---|---|
| 2008-2009 | 2009-2010a | 2010-2011a | 2009-2010 | 2010-2011 | |
| Planned | 87,125.7 | 94,719.8 | 102,134.6 | 2,037.5 | 2,525.7 |
| Authorized | 88,520.2 | 97,622.1 | 101,686.6 | 2,307.3 | 2,655.1 |
| Actual | 88,264.2 | 97,402.7 | 101,467.2 | 2,272.3 | 2,619.5 |
| a Canada's Economic Action Plan (EAP) initiaves are included with 2009-2010 and 2010-2011 figures. | |||||
In 2010-2011, actual expenditures were $4.1 billion, or 4.2% higher than in 2009-2010. This increase can be mainly explained by a payment of $2.9 billion for temporary EI benefit enhancement measures in accordance with the Budget Implementation Act 2009, a $1.2 billion increase in CPP benefits and a $1.0 billion increase in OAS payments due to the aging population and the increase in the monthly benefit amount. These increases are offset by a decrease of $1.7 billion to EI benefits mainly due to a decrease in the average unemployment rate from 8.4% in 2009-2010 to 7.9% in 2010-2011, resulting from the economic recovery.
1.8 Estimates by Vote
For information on our organizational votes and/or statutory expenditures, please see the 2010-2011 Public Accounts of Canada (Volume II). An electronic version of the Public Accounts is available at www.tpsgc-pwgsc.gc.ca/recgen/txt/72-eng.html
Section II - Analysis of Program Activities by Strategic Outcome
Note: The following methodology was used to assign a performance status to the performance indicators found in this section
| Result as a Percentage of Target | Performance Status |
|---|---|
| Greater than 105% | Exceeded |
| 95-104% | Met |
| 80-94% | Mostly met |
| 60-79% | Somewhat met |
| Less than 60% | Not met |
This methodology was established to account for the margin of error associated with measurements and to help ensure balanced reporting.
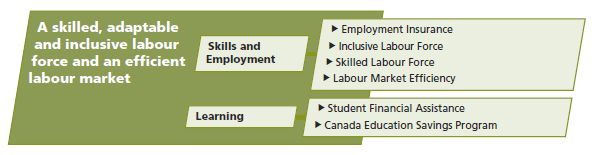
2.1 Strategic Outcome #1 - A skilled, adaptable and inclusive labour force and an efficient labour market
A key determining factor of long-term economic growth is the presence of a skilled and highly-educated workforce that is flexible, adaptable, and able to take advantage of opportunities at home and around the world. Building a stronger and more competitive Canada, within the context of integrated, knowledge-based global markets and an aging population, will depend on the ability of Canadians to participate successfully in the labour market and realize their full potential.
Achieving this outcome involves providing support for Canadians to invest in the development of their skills, either through participation in post-secondary education, apprenticeship, or other employment initiatives. It also involves providing support for individuals to help them make successful transitions within the dynamic Canadian economy and ensuring that it is possible to take advantage of opportunities wherever they may arise. This includes assisting those in vulnerable groups, including newcomers to Canada, who face multiple barriers to finding and maintaining full-time employment. Underlying these activities is the provision of high-quality labour market information so that Canadians are better able to make important training and employment-related decisions.
2.1.1 Program Activity: Skills and Employment
The Skills and Employment program activity is intended to ensure that Canadian labour market participants are able to access the supports they need to enter or reposition themselves in the labour market, allowing them to contribute to economic growth through full labour market participation. Initiatives within this program activity contribute to skills development, labour market participation and ensuring labour market efficiency.
These results are achieved through an array of programming delivered through a variety of mechanisms ranging from direct federal program delivery as well as joint federal-provincial/territorial program delivery, grants and contributions with third party organizations, and transfers to provinces and territories to develop and deliver their own labour market programming.
2010-2011 Financial Resources ($ millions)a
| Planned Spending | Total Authorities | Actual Spending |
|---|---|---|
| 24,794.4 | 25,225.0 | 25,034.7 |
| aFinancial and human resources amounts for this program activity include resources related to initiatives under Canada's Economic Action Plan. | ||
2010-2011 Human Resources (FTEs)a
| Planned | Actual | Difference |
|---|---|---|
| 2,017 | 2,133 | (116) |
| aFinancial and human resources amounts for this program activity include resources related to initiatives under Canada's Economic Action Plan. | ||
2.1.1.1 Performance Summary and Analysis of Program Activity
| Expected Results |
Performance Indicator |
Target | Performance Status |
Historical Results |
|---|---|---|---|---|
| Employers and other stakeholders support workplace skills development that responds to challenges in workplaces | Percentage of adult workforce who participate in job-related formal training Source: Access and Support to Education and Training Survey |
Employer-Supported: 19.6% Job-Related: 23.4% |
2008 Resultsa Job-Related: 36% |
Not available |
| aResults represent job-related training only as the data-source no longer collects information on employer-supported training. | ||||
HRSDC programming encourages employers and other stakeholders to support skills development that responds to challenges in workplaces, such as changing occupational standards and new technologies that require new skills. Employer-supported training ensures that employees acquire relevant and up-to-date skills for the job as opposed to the less efficient (and less safe) "learn by doing" approach, or other less-targeted training potentially based on outdated occupational requirements. The Department contributes to employer-supported training by consulting stakeholders (i.e. employers, labour representatives, trainers and educators) to identify and address key human resource issues. This includes the development of up-to-date training curricula for employers and other training institutions, trade certification standards, apprenticeship grants, and promotion of foundational numeracy and literacy. An indicator of success for this expected result is an increase in the percentage of adult workforce that participates in job-related training.
| Expected Results |
Performance Indicator |
Target | Performance Status |
Historical Results |
|---|---|---|---|---|
| Workers have the flexibility and support to pursue employment opportunities or labour market transitions | Proportion of regular claimants who exhaust all their weeks of Employment Insurance benefits Source: Employment Insurance Administrative Data |
28.4% | 2008–2009 Results 27.0% Met |
2007–2008: 28.4% 2006–2007: 27.9% 2005–2006: 28.0% 2004–2005: 27.8% 2003–2004: 30.4% |
Employment Insurance (EI) helps ensure that workers have the flexibility and support they need to adjust to labour market transitions and pursue employment opportunities by providing income benefits as well as special benefits for maternity, parental, sickness and compassionate care. A criterion for program success is the ability of non-seasonal EI claimants to rely on the program only on a periodic basis and to be able to transition back into the labour market, particularly before exhausting all the weeks of benefits to which they are entitled.
The proportion of regular claimants who exhaust all their weeks of EI benefits has declined compared to the previous year, despite the initial effects of the recession. This finding may be attributable in part to the built-in flexibility feature of the program, as EI is specifically designed to respond automatically to changes in local labour markets by modifying variable entrance requirements. Adjusted on a monthly basis, these variable entrance requirements determine how many hours must be worked before qualifying for income benefits. As the unemployment rate in a region rises, the ease of access to, and duration of, benefits increases, supporting people in regions and communities experiencing the greatest need. The decline may also be attributable in part to the implementation of the temporary EI measures under the Economic Action Plan (EAP) which affected claims still active from 2008-2009. It is estimated that the exhaustion rate would have been between 28% and 30% without the additional benefits.
| Expected Results |
Performance Indicator |
Target | Performance Status |
Historical Results |
|---|---|---|---|---|
| Canadians, including the under-represented groups and vulnerable workers, have the opportunity to acquire skills to find and maintain productive employment | Number of clients employed and/or who returned to school following an employment program intervention as a proportion of the total number of clients who complete their employment program intervention(s) Source: Administrative Data Note: The following programs are included in this indicator-Aboriginal Skills and Employment Training Strategy, the Skills and Partnership Fund, Aboriginal Skills and Employment Partnerships, the Youth Employment Strategy, and the Opportunities Fund for Persons with Disabilities. |
55%-62% | 2010-2011 Results 31,770; Proportion: 56.8% Met |
2009-2010: 32,941; Proportion: 56.8% 2008-2009: 34,811; Proportion: 61.3% 2007-2008: 32,396; Proportion: 59.9% |
HRSDC funds employment programs to help Canadians, including under-represented groups and vulnerable workers, develop their skills and employability as well as find and maintain employment. Assessing clients' employment outcomes and their returns to school following an intervention provides an indication of the success of the Department's federally delivered targeted labour market programs. Given that underrepresented groups are by definition experiencing less favourable labour market outcomes than others, it is expected that the number who find employment or return to training after an intervention will also be lower.
| Expected Results |
Performance Indicator |
Target | Performance Status |
Historical Results |
|---|---|---|---|---|
| Canadian and foreign workers have the necessary mobility to access employment opportunities | Number of regulated professions that require additional criteria be met to recognize equivalent occupational standards in support of labour mobility Source: Administrative Data |
Baseline Year | 2010-2011 Results: The Interprovincial Labour Mobility Initiative is working with 7 occupations to encourage the removal of additional criteria |
Not available |
The Department works to improve the integration of domestic and international workers into the Canadian labour market, as well as their mobility within Canada, to address Canada's existing and future labour market challenges. This performance indicator is based on the number of occupations that have identified conditional exceptions, which are granted when there are clear and significant disparities in qualification requirements for an occupation between jurisdictions. In these instances, additional requirements (e.g. exams and training), may be imposed on individuals that are trying to work in another jurisdiction. These conditional exceptions can be removed when regulators adopt occupational standards based on common interprovincial standards. The Interprovincial Labour Mobility Initiative is working with seven regulated occupations (social workers, midwives, massage therapists, paramedics, chiropractors, medical radiation technologists, and licensed practical nurses) on these issues.
In addition to the results presented, HRSDC met its commitments against the following priorities:
Strengthen Employment Insurance measures to assist workers in an environment of continued high unemployment
The Government has responded to the needs of Canada's self-employed workers by providing them with the opportunity to access, on a voluntary basis, EI special benefits that include maternity, parental, sickness and compassionate care benefits. Self-employed individuals have been able to opt into the EI program since January 31, 2010, and to apply for benefits since January 1, 2011. As of March 31, 2011, there were 7,114 self-employed persons who opted into the EI program. More detailed information on the EI special benefits for the self-employed can be found at www.servicecanada.gc.ca/eng/sc/ei/sew
An analysis of results from previous EI pilot projects indicated that they provided positive improvements in assistance for the unemployed. Consequently, the Government re-introduced the Extended EI Benefits pilot project and announced an eight-month extension of the Best 14 Weeks and Working While on Claim pilot projects. The extension of both pilots allows for the collection of additional data, including data on the effectiveness of the pilot projects during a period of economic recovery.
Budget 2010 confirmed that the Canada Employment Insurance Financing Board (CEIFB) would assume responsibility for setting EI premium rates for 2011 and beyond. The provisions of the Employment Insurance Act authorizing the CEIFB to set rates were brought into force on September 23, 2010. In fall 2010, the CEIFB published its first annual Employment Insurance Premium Rate report, which can be found at www.ceifb-ofaec.ca/reportse.html
Enhance the labour market participation of vulnerable workers who experience persistent levels of unemployment
In an effort to further enhance the participation of Aboriginal people in the labour market, HRSDC launched the new Aboriginal Skills and Employment Training Strategy (ASETS) on April 1, 2010, as the successor strategy to the former Aboriginal Human Resources Development Strategy. In 2010-2011, 81 contribution agreements were in place with Aboriginal service delivery organizations to help Aboriginal people receive the training and skills they need to participate in the labour market. In addition to ASETS, the Skills and Partnership Fund (SPF) was launched in July 2010 as a separate but complementary program to ASETS. SPF supports projects that encourage innovation and partnerships, test new approaches to address systemic gaps in service delivery and increase Aboriginal skills development and secure employment.
HRSDC consulted with partners to develop further strategies to help other vulnerable workers such as people with disabilities, youth, and recent immigrants to participate in the labour market. Working in collaboration with partners, HRSDC served 5,370 people under the Opportunities Fund for Persons with Disabilities, of which 1,621 found employment and 306 were able to return to school. In support of youth, HRSDC along with 10 other departments and agencies provided support with additional funding under the EAP for Career Focus, Skills Link and Canada Summer Jobs programs. Nearly, 1,600 postsecondary graduates were placed in workplace internships under Career Focus; 17,000 disadvantaged youth developed employability skills, obtained jobs, or returned to school with the help of Skills Link; and approximately 37,000 student jobs were created with the assistance of Canada Summer Jobs in more than 22,200 organizations across the country (of which approximately 3,500 jobs are attributed to incremental funding under EAP).1
Strengthen partnerships with employers, provinces and territories to enhance the preparedness of Canadians to meet the labour market's need for skilled workers
The Department continued to actively engage provinces and territories on their labour market needs through the Labour Market Agreements (LMA) and Labour Market Development Agreements (LMDA). The analysis on labour market priorities and detailed annual planning provided to HRSDC by provinces and territories under these agreements have helped ensure that Canadians have access to training and skills development, allowing them to participate fully in the labour market. Further details on agreements can be found at www.hrsdc.gc.ca/eng/employment/partnerships/index.shtml
Partnerships with provinces and territories were strengthened during the implementation of the Strategic Training and Transition Fund (STTF), which complemented and was delivered through existing Labour Market Agreements. Through the STTF, the Government of Canada invested an additional $500 million between 2009 and 2011 in provincial and territorial programming to assist individuals affected by the economic downturn, regardless of their eligibility for EI. Provinces and territories reported results through their labour market agreement annual reports, including the number of clients that have been served under the STTF. In addition, through the existing LMDAs, the Government of Canada invested a further $1 billion over the same time period in provincial and territorial programming targeted primarily to unemployed Canadians who were eligible for EI.
Skills and training solutions responding to labour market trends and conditions in various industrial sectors were developed through collaboration with sector councils and by building on provincial and territorial investments. In partnership with the Canadian Council of Directors of Apprenticeship (CCDA), HRSDC continues to explore and evaluate new and innovative standards, assessment tools and equivalency processes to strengthen the Red Seal program. The CCDA explored the utility of an Occupational Performance Standards framework for application in the Red Seal program to better support skills formation (training) and skills recognition (assessment), and facilitate the portability of skills between industry sectors and occupations. Through its Multiple Assessment Pathways project (piloted in four provinces), the CCDA also explored the feasibility and effectiveness of various assessment methods to complement the current written examination for certifying trades persons and apprentices using the Interprovincial Red Seal standard.
The Apprenticeship Grants form part of a suite of federal supports to apprentices and the skilled trades, with the objectives of increasing access to the skilled trades, encouraging progression within an apprenticeship program and promoting completion and certification in the Red Seal trades. In 2010-2011, there were 51,476 Apprenticeship Incentive Grants and 25,678 Apprenticeship Completion Grants issued by the Department.
Work with partners to implement the framework on Foreign Credential Recognition and enhance the dissemination of labour market information
The Department provided financial support to provinces, territories and other stakeholders to develop tools and systems that would improve the Foreign Credential Recognition (FCR) processes that are critical to facilitate the successful integration of internationally trained workers. In 2010-2011, HRSDC negotiated 64 contribution agreements including investments with organizations representing all FCR priority occupations (architects, engineers, accountants, medical laboratory technologists, occupational therapists, pharmacists, physiotherapists and registered nurses) for 2010 and seven provinces and territories. Through nationwide consultations, the 2010 target occupations have met the one-year commitment to timely service. This means that internationally trained workers who submit an application to be licensed or registered to work in these fields will be advised within one year how their credentials compare to Canadian standards.
HRSDC also provided funding to eligible regulated occupations for activities that facilitated interprovincial labour mobility. In 2010-2011, contribution agreements were negotiated with seven occupations including social workers, massage therapists and paramedics to improve nationwide communication and strengthen coordination among stakeholders, including occupational regulators, educators, employers and governments on interprovincial mobility issues.
In partnership with provinces, territories and others, HRSDC improved the collection and dissemination of regional and national Labour Market Information (LMI). Specifically, the Working in Canada (WiC) tool enabled the department to consolidate LMI into one source, including new content specific to youth, newcomers and other job seekers. In 2010-2011 more than 2 million people used the Working in Canada tool to obtain LMI information to help them make decisions about working in Canada.
Strengthen administration of grants and contributions
HRSDC continued its efforts to strengthen the administration of grants and contributions by implementing the new Risk Assessment Management and Mitigation approach and by developing a national training strategy to build skills and competencies. In addition, improvements were made to the HRSDC website to facilitate recipients' access to program and funding information. These improvements resulted in an increase in the number of page views, from 3,000 per month with the old website (prior to October 2010) to an average of 15,000 per month with the new website (post-October 2010).
2.1.1.2 Lessons Learned
The Department relies on a number of activities that can help to identify and provide insights for continuous improvement in programs and related services. Program evaluations are an important source of lessons learned for the Department. For example:
The formative evaluation of the Adult Learning, Literacy and Essential Skills Program confirmed that a key factor for successful program delivery was the development of sustainable partnerships within the literacy and essential skills community, and that there was a need to update the performance measurement and evaluation frameworks for the Office of Literacy and Essential Skills. Building on these findings, the program engaged literacy partners and stakeholders on enhanced approaches to literacy programming, developed and implemented a comprehensive performance measurement framework, and launched a new redesigned website which includes a searchable project database that provides comprehensive, publicly accessible project results.
The Targeted Initiative for Older Workers formative evaluation found that the program would benefit from a clear, detailed definition of eligibility criteria and flexibility rules, that the absence of access to Social Insurance Number (SIN) information will limit the scope of future evaluations, and that there is a need for further study of the longer-term impacts of the program. To address these lessons learned, the program is developing additional policy clarification concerning the community eligibility rules and working with internal partners and provinces/territories to support strong future evaluations that focus on incorporating long-term assessments of labour market impacts.
2.1.2 Program Activity: Learning
This program activity helps Canadians participate in post-secondary education (PSE) to acquire the skills and credentials that enable them to improve their labour market outcomes and adapt to changing labour market conditions. It reduces barriers to education by providing financial assistance to individuals as well as incentives to save for a child's post-secondary education. It also provides information and awareness about opportunities to acquire education and skills. The program contributes to the inclusiveness of the workforce by giving Canadians with the required academic abilities a more equal opportunity to participate in post-secondary education. The program works with the provinces and territories, voluntary sector, financial institutions, service providers and other key stakeholders to help Canadians pursue PSE.
2010-2011 Financial Resources ($ millions)
| Planned Spending | Total Authorities | Actual Spending |
|---|---|---|
| 2,493.5 | 2,928.5 | 2,921.1 |
2010-2011 Human Resources (FTEs)
| Planned | Actual | Difference |
|---|---|---|
| 322 | 436 | (114) |
2.1.2.1 Performance Summary and Analysis of Program Activity
| Expected Results |
Performance Indicator |
Target | Performance Status |
Historical Results |
|---|---|---|---|---|
| Canadians have the skills and credentials to succeed in the labour market | Percentage of the Canadian population (aged 25-64) who have attained a post-secondary certificate, diploma, or degree Source: Labour Force Survey |
62% | 2010 Results 62.5% See "PSE Attainment Rates" chart below Met |
2009: 61.4% 2008: 60.8% 2007: 60.3% 2006: 59.1% 2005: 58.3% |
| Percentage of the Canadian Labour Force with some post-secondary education Source: Labour Force Survey |
72% | 2010 Results 72% Met |
2009: 71.1% 2008: 70.7% 2007: 70.0% 2006: 69.0% 2005: 68.6% |
Participation in post-secondary education lays the foundation for building a skilled, adaptable, and inclusive workforce by helping Canadians obtain the skills and credentials they need to succeed in the labour market. Workers with higher-level skills and credentials tend to be more productive and competitive, earn higher wages and remain in the labour force longer. The increase in the
availability of skilled labour drives innovation and reduces skills shortages that limit economic growth, and also attracts and retains foreign investment.
Canada has one of the most educated populations and workforces in the world thanks in part to the support of HRSDC's programs. The Organisation for Economic Co-operation and Development (OECD) found that Canada placed first overall among OECD countries, based on 2008 data, with 61% of its population having a
post-secondary credential.2 The percentage of Canadians in the labour force (age 25-64) who have obtained a post-secondary credential has also increased steadily over the last five years, reaching 66% in 2010 (62.8% in 2006). Canada is unique in the strength of its national network of community colleges and CEGEPs that offer skilled trades and vocational education. It is this network that is partly responsible for the country's top ranking within the OECD.
At the same time, however, other countries are catching up and surpassing Canada in certain areas. For example, the percentage of Canada's population with a bachelor or graduate degree dropped from fourth place in 2002 (at 21%) to being tied for seventh place with two other countries in 2008 (at 25%). In 2008, Norway (33%), the United States (30%), Netherlands (29%), Iceland (27%), Australia
(26%), and Korea (26%) all had a greater percentage of their population with a bachelor or graduate degree.
| Canada's Ranking Among OECD Countries 25-64 Year Olds |
Canadian Population 25-64 Year Olds |
Canadian Labour Force 25-64 Year Olds |
||
|---|---|---|---|---|
| 2008 | 2009 | 2010 | 2010 | |
| Trades, Certificate or Diploma | 1st | 12% | 11.9% | 12.3% |
| College or University (below bachelor) | 1st | 24% | 24.2% | 25.5% |
| Bachelor's degree | 7st (Tied with 2 other countries) |
25% | 18.1% | 19.3% |
| Graduate degree | 8.3% | 8.9% | ||
| Total | 1st overall | 61% | 62.5% | 66.0% |
| Expected Results |
Performance Indicators |
Targets | Performance Status |
Historical Results |
|---|---|---|---|---|
| Canadians including those from under-represented groups, participate equitably in post-secondary education | Percentage of Canadians (aged 15-64) who were attending university or college Source: Labour Force Survey |
8.3% | 2010 Results 8.9% See "Proportion of Canadians Attending University or College" chart below. Exceeded |
2009: 8.5% 2008: 8.3% 2007: 8.4% 2006: 8.5% 2005: 8.6% |
| University participation rate by family income among 18-24 year olds.a Source: Survey of Labour and Income Dynamics |
Not Available (New Indicator) | 2008 Results Less than $25,000: 18.5% $25,000-$50,000: 24.2% $50,000-$75,000: 30.6% $75,000-$100,000: 41.8% Over $100,000: 52.5% |
Not available | |
| The PSE participation rate of persons with disabilities (aged 17-29) compared to the PSE participation rate of persons without disabilities Source: Survey of Labour and Income Dynamics |
Not Available (New Indicator) | 2008 Results 28.3% for persons with disabilities compared to 38.7% for persons without disabilities |
Not available | |
| a To streamline reporting the two indicators "Percentage of Canadians from low-income families participating in post-secondary education" and "Percentage of Canadians from middle-income families participating in post-secondary education" reported in the 2010-2011 Report on Plans and Priorities have been replaced by the indicator "University participation rate by family income among 18-24 year olds". | ||||
In order to continue to have the best educated, most skilled and most flexible workforce in the world, it is important that all Canadians with the necessary academic abilities have an opportunity to participate in post-secondary education. Canada has a highly educated population, in part, because HRSDC's student financial assistance and PSE savings incentives help to reduce financial barriers for lower- and middle-income families, students with dependants, students with permanent disabilities and part-time students. This helps to ensure that the potential talent of all groups is more fully utilized. Furthermore, inclusion in PSE also improves inclusion in the workplace.
The proportion of all Canadians aged 17-29, the core age group for participation in PSE, attending university or college increased from 18.2% in 1990 to 27.3% in 2010. PSE participation in 2010 increased by 6% (overall for 15-64 year olds), compared with 2009.
| Age Group | Female | Male | Total |
|---|---|---|---|
| 17-21 | 46.8% | 34.2% | 40.4% |
| 22-24 | 33.8% | 29.2% | 31.4% |
| 25-29 | 13.2% | 11.1% | 12.2% |
| Overall 17-29 | 30.7% | 24.1% | 27.3% |
| Overall 15-64 | 10.0% | 7.9% | 8.9% |
| Overall 25-64 | 4.3% | 3.4% | 3.8% |
However, some groups are still under-represented in terms of their participation in PSE, or face significant barriers to access. These include, for example, students from low-income families and students with disabilities. For example:
- research has shown that about one-quarter of youth (aged 18-24) from families earning less than $75,000 pursue university studies compared to 42% of youth from families earning between $75,000 to $100,000 and one-half of those from families earning over $100,000. Participation in community college studies, by comparison, is more evenly distributed; and
- in 2007, 41.6% of persons with a disability (aged 16 and over) had a post-secondary credential, compared to 52.2% of Canadians without a disability.
HRSDC has been working closely with provincial and territorial partners to examine the financial and non-financial barriers these under-represented groups face. In 2010-2011 a series of diagnostics were developed in order to provide a more solid understanding of the characteristics of these learner populations and their unique challenges.
In addition, the Government of Canada, through HRSDC, recently provided funding to Pathways to Education Canada, a charitable organization that helps youth in low-income communities graduate from high school and successfully transition into post-secondary education or training. The core program of Pathways to Education provides a comprehensive set of academic, social and financial supports to youth.3
To increase awareness of PSE savings incentives and encourage Canadians to save for children's PSE the Department implemented an outreach strategy that targeted low and middle-income families (for further information see Lessons Learned). Having savings for PSE increases the likelihood of attending post-secondary education as it makes PSE more affordable and increases parental expectations of their children attending PSE. See also the explanation of awareness results under the next expected result.
| Expected Results |
Performance Indicators |
Targetsa | Performance Status |
Historical Results |
|---|---|---|---|---|
| Canadians are able to finance their post-secondary education | Percentage of full-time post-secondary students (aged 18-34) (in participating provinces/territories) who used either a Canada Student loan, or a Canada Student grant to help finance their participation in post-secondary education: Source: Administrative Data and Office of the Chief Actuary |
Loan: 36.6% Grant: 23.7% |
2010-2011 Results Loan: 31.4%a Mostly Met Grant: 23.0%a Met |
2009-2010 Loan: 32% Grant: 27% 2008-2009 Loan: 36% Grant: 8% 2007-2008 Loan: 35% Grant: 8% 2006-2007 Loan: 36% Grant:9% 2005-2006 Loan: 40% Grant: 9% |
| Percentage of full-time post-secondary students (aged 18-34) (in participating provinces/territories) who used a Canada Student Loan Program (CSLP) in-study interest subsidy to help finance their participation in post-secondary education Source: Administrative Data and Office of the Chief Actuary |
46.6%a | 2010-2011 Results 39.2%a Mostly Met |
Results based on loan year: 2009-2010: 47% 2008-2009: 47% 2007-2008: 46% 2006-2007: 48% 2005-2006: 53% |
|
| Percentage of post-secondary students in Canada who used Registered Education Savings Program (RESP) funding to help finance their participation in post-secondary education Source: Administrative Data and Labour Force Survey |
12.4% | 2010 Results 13.9% Exceeded |
Results based on loan year: 2009: 12.9% 2008: 12.3% 2007: 11.6% 2006: 10.1% 2005: 8.6% |
|
| Total amount withdrawn from RESPs to pay for post-secondary education in the 2010 calendar year Source: Administrative Data |
$1.4 billion | 2010-2011 Results $1.92 billion Exceeded |
Results based on loan year: 2009: $1.6 billion 2008: $1.5 billion 2007: $1.32 billion 2006: $1.09 billion 2005: $840 million |
|
| Percentage of children under 18 (in 2010) who have ever received a Canada Education Savings Grant Source: Administrative Data |
42% | 2010-2011 Results 42.8% Met |
Results based on loan year: 2009: 40.6% 2008: 39.7% 2007: 37.8% 2006: 34.9% 2005: 32.4% |
|
| a Percentage of full-time students obtaining a Canada Student Loan decreased in 2009-2010 and 2010-2011 due to the introduction of the new Canada Student Grant Program and an increase in the forecast of post-secondary enrollment for both years by the Office of the Chief Actuary. | ||||
By helping Canadians finance their post-secondary education, HRSDC increases the number of Canadians who can apply to post-secondary programs, and makes it easier for them to attend the school and program of their choice. This contributes to more affordable education, which allows more students to participate in PSE. The additional help with financing also enables students to devote more time to their studies instead of work, which evidence suggests makes them more likely to graduate. All together, this has helped Canada build one of the best educated, most skilled and most flexible workforces in the world.
Canadians continued to rely on HRSDC's programs and services to help them finance their participation in PSE. During 2010-2011, the Department helped 39.2%4 of full-time PSE students (aged 18-34, in participating provinces and territories) use loans, grants or in-study interest subsidies to help finance their participation in PSE. Furthermore, 13.9%5 (10.1% in 2006) of full- and part-time PSE students withdrew funds from their RESPs to help them finance their PSE6. This result exceeded the target for this indicator, due to a higher than expected increase in the number of students who withdrew funds from RESPs (a 23% increase over the last two years [2009 and 2010]).
Overall, in 2010-2011, 533,887 post-secondary full-time students in participating provinces and territories benefited from the CSLP and the Canada Student Grants Program (CSGP) (including those who benefited from interest subsidies). Under these programs HRSDC invested: $2.2 billion in student loans to over 424,442 PSE students; $587 million in grants to over 310,445 borrowers; 7,8, and $174.5 million in in-study interest subsidies to cover interest for borrowers who are still in school.
The 2010 Canada Student Loan Client Satisfaction Survey demonstrated the need for student financial assistance in 2009-2010. Just as over half (53%) of student borrowers surveyed (those currently attending PSE and those in-repayment) said that the economic downturn had affected them financially and that they would have had to change their study plans had they not received a Canada Student Loan. Of borrowers currently attending PSE number, 17% said that they would have abandoned their studies and 39% would have delayed their studies if they had not been approved for a student loan.
RESPs also provide a significant source of funding for post-secondary education. In 2010, more than 287,000 students withdrew $1.92 billion from their RESPs to help pay for their participation in PSE. This represents a 20% increase in withdrawals from RESPs relative to 2009. An increase in RESP asset values, which have rebounded after the economic downturn, may have also contributed to this result.
More Canadians families are using the PSE savings incentives offered by the Canada Education Savings Program (CESP). As of December 2010, 42.8% of eligible children under 18 years of age had RESP savings compared with 34.9% in 2006. Moreover, in 2010, Canadian families contributed $3.39 billion to RESPs compared with $3.17 billion in 2009.
In 2010, the Canada Learning Bond (CLB) helped 292,940 low-income families save for children's post-secondary education using RESPs. This is more than double the number of children who received the CLB in 2008 (140,185). In addition, 95% of these families are contributing their own savings to their RESPs. Since the inception of the CLB in 2005, these families have contributed a total of $839 million to their RESPs, up from $533 million at the end of 2009.
General awareness of available government student financial assistance is improving, particularly for student grants. Results from the most recent 2009 Youth Survey show that, when asked about student financial assistance, 58% of youth identified student loans and 45% identified grants as forms of assistance available from federal and provincial governments–an increase from 51% and 23% in 2008. When youth were asked about specific types of student financial assistance that governments provide, awareness levels rose to 70% for study grants, from 59% in 2008, while awareness of student loans remained stable at 97%.
Additional reporting regarding the two main programs in this program activity can be found at: www.hrsdc.gc.ca/eng/learning/canada_student_loan/publications/index.shtml; and www.hrsdc.gc.ca/eng/learning/education_savings/publications_resources/
promoter/tools/asr2010/index.shtml.
In addition to the results presented, HRSDC has made progress on the following priorities:
Implement program initiatives to improve post-secondary education-related services and programs
In collaboration with provinces and territories, HRSDC successfully completed the implementation of two new initiatives introduced in August 2009: the CSGP and the Repayment Assistance Plan (RAP). The RAP provides more comprehensive, graduated support for student borrowers experiencing difficulty in repaying their student loans. In addition, the Repayment Assistance Plan for Borrowers with Permanent Disabilities was implemented, providing targeted support for disabled borrowers experiencing difficulties in repaying their student loans. Implementation of the RAP contributed to maintaining the default rate at a lower than expected level (15% versus a forecast of 17%), making it easier for borrowers to avoid default by restructuring their student loan repayments to fit their financial circumstances. During 2010-2011, there were 155,239 recipients of the RAP.
Review and enhance client service delivery in support of post-secondary education
HRSDC continued to implement the first three Service Delivery Vision (SDV) initiatives identified by provinces and territories as priority projects: Electronic Confirmation of Enrolment (ECE); Master Student Financial Assistance Agreement (MSFAA); and Single Online Application for Repayment Assistance Measures (SOARAM). The necessary regulatory changes to allow for multi-year loan agreements and ECE were completed, enabling the Department to develop and implement the first MSFAA in British Columbia in early 2011-2012. The other two initiatives (ECE and SOARAM) will be implemented in 2012-2013. Based on this success, HRSDC is actively engaging other interested provincial and territorial partners, along with its third party service provider, in an effort to begin bilateral work for the implementation of SDV initiatives in their jurisdictions.
The Department continued to monitor service delivery performance, with key results including:
- 77% of clients satisfied with the overall quality of service provided by the CSLP;
- 90% of funds disbursed to students and educational institutions within 2 days (federal portion) and 4 days (provincial portion) of receiving complete student loan documentation;
- 90% of disbursements error-free;
- 80% of inbound telephone calls to CSLP's service provider answered within 20 seconds;
- Over 90% of Canada Education Savings Program CESP payments made within 65 days of a complete application or a RESP contribution; and
- 97% of calls to CESP's telephone enquiry service responded to within three minutes.
In order to improve services provided to Canadians, HRSDC implemented a new quality assurance process for the CESP. Front-line client service providers were provided with improved information as well as processes for responding to Canadians' requests for information faster and with increased accuracy.
In 2010-2011, HRSDC responded to the Review of Registered Education Savings Plan Industry Practices by engaging financial institutions in an examination of the ways in which information about RESPs and HRSDC's PSE savings incentives are communicated to the public.9 This resulted in the development of new information brochures which have been widely distributed to RESP providers and on the CanLearn website, helping to ensure that Canadians receive more complete and accurate information about RESP plans. RESP promoters have also been consulted on a regular basis in order to improve the administration of RESPs.
Review existing policy instruments and develop and advance new policy options to increase post-secondary education awareness and participation
Implementation of the CSGP was completed in 2010-2011. These new grants are disbursed evenly, at the beginning of the fall and winter semesters, and are available to eligible students for their entire undergraduate post-secondary education. HRSDC is continuing to monitor the uptake of loans and grants and is continuing to analyze the effect of the CSGP.
During 2010-2011, HRSDC began to explore how the financial literacy of Canadians relates to saving for post-secondary education, using the Canadian Financial Capability Survey. The results of this work will be available in 2011-2012. In addition, online Entrance and Exit information modules were developed for students taking out their first Canada Student Loan and for those entering repayment. HRSDC is currently completing a pilot project with British Columbia to test the effect of the information modules on borrowers' repayment behaviour.
Sustain the delivery of other services related to post-secondary education
In addition to issuing loans and grants to students, as well as payments to RESPs as outlined above, HRSDC continued to administer the remaining payments of Excellence Awards that arose from the Canada Millennium Scholarship Foundation, whose mandate came to an end in 2009. From April 2010 until March 2011, HRSDC disbursed 1,240 Excellence Awards payments for a total of $6.7 million.
2.1.2.2 Lessons Learned
The following two examples from evaluations provide a clear indication of the types of lessons learned for this program activity.
The summative evaluation of the CSLP focused on the period 2000-2008. Overall, the evaluation found that there continues to be a clear need for the financial assistance CSLP provides and that CSLP was achieving its objectives by reducing financial barriers and improving access to PSE. The evaluation also identified possible challenges within the student financial assistance (SFA) system related to part-time loans, parental contribution rules, student awareness of SFA, the quality of the needs assessment data files and debt management measures. Since the evaluation period, there have been a number of initiatives introduced to help address these challenges. For example, in Budget 2008, the Government of Canada more than doubled the maximum lifetime loan limit for part-time borrowers and introduced up-front, non-repayable grants to help students pay for post-secondary education. In addition, the Repayment Assistance Plan was introduced in 2009 to assist borrowers who are facing financial difficulty by making it easier to manage their student loan obligations by paying back what they can reasonably afford. As these changes occurred after the timeframe of the summative evaluation, a supplementary evaluation plan is being developed to capture the impact of these new initiatives.
A formative evaluation of the Additional Canada Education Savings Grant and the Canada Learning Bond examined the preliminary impacts of these two savings incentives introduced in 2005. The evaluation, considering the period 2005-2007, concluded that these two savings incentives were successful in encouraging parents to save for PSE of children, have had a positive effect on attitudes and expectations towards PSE, and resulted in increased savings in RESPs. The evaluation also identified challenges in effectively reaching and assisting low-and middle-income families. To address this, HRSDC implemented an outreach strategy that targeted low-and middle-income families in order to increase awareness of PSE savings incentives and to encourage Canadians to save for children's PSE. This included funding for 10 new community outreach projects that are expected to reach 90,000 Canadians over the next three years. In addition, during 2010-2011 targeted letters were sent to over 1.1 million eligible families to inform them of their eligibility for RESP savings incentives.
2.2 Strategic Outcome #2 - Safe, fair and productive workplaces and cooperative workplace relations

Well regulated workplaces and stable employer-worker relations are essential building blocks for collective prosperity and individual well-being. Fostering productive workplaces in which health and safety are a priority, workers are treated decently, disputes are resolved constructively, motivation is high and innovation is encouraged is a common objective pursued by all governments in developed countries. The Labour Program has a long history of contributing to public policy and the public good. Its activities have evolved over time in response to the changing world of work and the needs of employers, workers, and society.
2.2.1 Program Activity: Labour
This program activity seeks to promote and sustain stable industrial relations and safe, fair, healthy, equitable, and productive workplaces within the federal jurisdiction (e.g. transportation, post office and courier companies, communications, banking, grain and nuclear facilities, federal Crown corporations, and Aboriginal governments, their employees, Aboriginal communities and certain Aboriginal undertakings). It develops labour legislation and regulations to achieve an effective balance between workers' and employers' rights and responsibilities. The program ensures that workplaces under the federal jurisdiction respect the rights and obligations established under labour legislation. The program also manages Canada's international and intergovernmental labour affairs, as well as Aboriginal labour affairs responsibilities.
For further information on activities undertaken under the Labour Program, please visit www.labour-travail.gc.ca
2010-2011 Financial Resources ($ millions)a
| Planned Spending | Total Authorities | Actual Spending |
|---|---|---|
| 300.5 | 264.8 | 262.8 |
| a Financial and human resources amounts for this program activity include resources related to initiatives under Canada's Economic Action Plan. | ||
2010-2011 Human Resources (FTEs)a
| Planned | Actual | Difference |
|---|---|---|
| 726 | 733 | (7) |
| a Financial and human resources amounts for this program activity include resources related to initiatives under Canada's Economic Action Plan. | ||
2.2.1.1 Performance Summary and Analysis of Program Activity
| Expected Results |
Performance Indicators |
Targets | Performance Status |
Historical Results |
|---|---|---|---|---|
| Workplace parties engage in constructive dialogue and cooperation to address workplace issues | Percentage of collective bargaining disputes settled under Part I (Industrial Relations) of the Canada Labour Code without a work stoppage Source: Administrative Data |
90% | 2010-2011 Results 94% Met |
2009-2010: 94% 2008-2009: 94% 2007-2008: 93% 2006-2007: 97% 2005-2006: 97% |
One of the expected results of the Labour program activity is to promote harmonious union management relations and thereby minimize the number of work stoppages that disrupt the Canadian economy. To measure the effectiveness of its services, the Labour Program tracks the percentage of collective bargaining disputes settled without a work stoppage.
To support the achievement of this expected result, the Labour Program offered 80 workshops designed to help employers and unions build and maintain constructive working relationships as part of the Preventive Mediation Program.
| Expected Results |
Performance Indicators |
Targets | Performance Status |
Historical Results |
|---|---|---|---|---|
| Workplace parties comply with relevant workplace standards, follow guidelines, and adopt best practices | Percentage of unjust dismissal complaints settled by inspectors (Part III (Labour Standards) of the Canada Labour Code) Source: Administrative Data |
75% | 2010-2011 Results 71% Mostly Met |
2009-2010: 71% 2008-2009: 73% 2007-2008: 76% 2006-2007: 74% 2005-2006: 74% |
| Percentage of money collected in relation to the amount found to be owed for complaints under Part III (Labour Standards) of the Canada Labour Code (excluding unjust dismissal complaints) Source: Administrative Data |
75% | 2010-2011 Results 71.8% Mostly Met |
2009-2010: 72.1% 2008-2009: 78.6% 2007-2008: 66.4% 2006-2007: 75.1% 2005-2006: 77.7% |
The labour standards legislation administered by the Labour Program has several purposes, the two most important being to establish a minimum floor of employment conditions for all workers, which represents an appropriate standard of dignity, decency, and economic well being, including protection from exploitation; and to prevent unfair competition by providing a level playing field of minimum labour standards in the market place, thereby protecting employers from unfair competition stemming from the potentially detrimental employment practices of competitors.
The Department assists employees, who feel their employment has been terminated unfairly, to challenge unjust dismissals and recover unpaid wages. Arbitrators are appointed to resolve unjust dismissal complaints and wage recovery referees are appointed to hear appeals of decisions on unpaid wage claims. The Labour Program aims to provide a faster and more cost-effective mechanism for resolving employee complaints than is available through the courts. While Labour Program inspectors endeavour to assist all parties in the settlement of unjust dismissal complaints, participating in dispute resolution with respect to unjust dismissals is not mandatory, and successful resolution is dependent upon a variety of factors, not all of which are within the control of Labour Program inspectors.
In 2010-2011, Labour Program inspectors used all measures at their disposal in order to assist complainants in recovering amounts found owing. When money still remained owing despite their efforts, the outstanding claims were filed in Federal Court when appropriate. The economic conditions potentially had an impact on the success rate of the inspectors. In addition, the results above do not include amounts assessed and collected where the employer filed for bankruptcy. Bankruptcy cases often involve large numbers of employees and considerable sums of money, take a significant amount of time to resolve, and can result in employees receiving little or no wages from the bankrupt employer's estate due to the operation of the Bankruptcy and Insolvency Act. The Labour Program must wait until the bankruptcy process has been completed before initiating further action, such as payment orders against corporate directors. Consequently, wage claims against solvent employers are resolved under different circumstances than are those against bankrupt employers and the performance standard cannot be applied to cases involving bankrupt employers as they fall, temporarily, outside the scope of the Labour Program's authority to act.
| Expected Results |
Performance Indicators |
Targets | Performance Status |
Historical Results |
|---|---|---|---|---|
| Risks to life, health, and property are eliminated or mitigated | Percentage change, year over year, in the rate of lost time injuries and fatalities (Disability Injury Incidence Rate) within the targeted higher risk federal jurisdiction industries Source: Administrative Data |
Decrease of 15% over a five year period (2009-2013) | 2005-2009 Resultsa Decrease of 5.2% |
2001-2005: Decrease of 20.5% |
| aThe 2010-2011 Report on Plans and Priorities indicated a target referencing the period 2009-2013. As data from the OHS administrative records from this period will not be available until late 2014, the result for 2005-2009 is reported here. | ||||
The Disability Injury Incidence Rate is measured over a fixed five year period as it can fluctuate from year to year. The last complete five year period for which data is available is 2005 to 2009. Between 2005 and 2007 there was a 4.6% increase in the rate of lost time injuries and fatalities in Occupational Health and Safety (OHS) high-risk or priority industries. Between 2007 and 2009, there was a 9.4% decrease, which may be related to the onset of the recession and layoffs for younger and more inexperienced workers. As more experienced workers tend to have lower rates of injuries, a higher relative proportion of these workers in the workplace could account for the decrease in injuries from 2007-2009.
This program activity had particular importance in light of the economic situation in 2010-2011 and changes in the nature of work. Canadians increasingly looked for assistance to recover wages, resolve workplace disagreements, and obtain benefits owed to them. Addressing the effects of the economic situation with appropriate initiatives continues to be a key focus of this program activity, and in addition to the results presented above, progress was also made on the following priorities:
Continue delivery of Wage Earner Protection Program
Before the Wage Earner Protection Program (WEPP) was established, between 10,000 and 20,000 Canadian workers had unpaid wage claims every year resulting from employer insolvencies. Under WEPP, Canadian workers are now entitled to timely reimbursement of eligible wages owing to them if they have lost their job because their employer has gone bankrupt or become subject to receivership. Eligible wages under the original WEPP included salaries, commissions, and vacation pay. As part of Canada's Economic Action Plan, WEPP was extended in 2009 to cover severance and termination pay. This has meant further assistance to Canadian workers facing financial pressure due to job losses from bankruptcy. The Government committed an additional $25 million to cover expanded WEPP coverage.
In 2010-2011, 14,974 applications were received and 14,305 applicants were paid, for a total of $31.9 million with an average payment of $2,343. Since the inception of the Program in 2008, there have been 39,301 claims of which 33,550 claims were paid. Payments made to claimants from the inception of the Program total $70.6 million.
Efficiently and effectively deliver mandated programs and services, with particular attention to the effects of continued economic uncertainty on employers and workers
As a leader in occupational health and safety regulatory reform, the Labour Program contributed technical expertise in developing Canadian national occupational health and safety standards that reflect industry best practices in Canada and globally, thereby ensuring international competitiveness of Canadian enterprises while maintaining safe and healthy workplaces.
A communications strategy was launched, geared towards federal contractors to encourage continuing and voluntary compliance related to employment equity. In addition, workplace information and data was provided to internal (e.g., policy analysts) and external (e.g., negotiators, researchers) clients, supporting a well informed labour standards and workplace relations community.
The Department also released innovative tools to assist employers in meeting their obligations under the Employment Equity Act. Such tools included a systematic guide to implementing an employment equity plan, a modern Web based information management system for employment equity data, as well as a collection of short films to encourage discussion and dialogue on the issue of racism in the workplace.
In addition, the Racism free Workplace Strategy, in partnership with the Aboriginal Human Resource Council, provided training sessions and webinars to over 300 employers on Mastering Aboriginal Inclusion. The Strategy, in partnership with the National Film Board, also produced five educational films and facilitation guides to aid employers in addressing the negative impacts of cultural biases and perceptions on the hiring process.
Design and implement strategies that respond to domestic and international labour related developments
A strategic goal of the Labour Program is to advance Canadian interests and fundamental values abroad and protect Canadian companies and workers from foreign competitors who may be tempted to gain unfair advantages by ignoring fundamental labour standards. The Labour Program pursued a targeted strategy for engaging key partner countries and emerging economies. In this capacity, it supported the Government's free trade agenda through active participation in ongoing negotiations with the European Union, Ukraine, and Honduras. The Memoranda of Understanding on Labour Cooperation with Brazil and Argentina were renewed in September and December 2010 respectively. Cooperative activities under the Canada China Framework in the Field of Industrial Relations and Labour Standards focussed on tripartite consultation and labour management relations.
The International Trade and Labour Program (ITLP) is a mechanism for the Government of Canada to meet its commitment to address the labour dimensions of international trade and economic integration; selected stakeholders and key partner countries benefited from labour related technical assistance. Projects developed by the Labour Program and recipient organizations promote respect for internationally recognized core labour standards through social dialogue and capacity building initiatives that address labour issues, including those related to Labour Cooperation Agreements.
In its role of providing national leadership and coordination within the network of labour jurisdictions in Canada, the Labour Program supported the Minister of Labour's work with provincial and territorial colleagues to approve and implement a renewed federal provincial territorial strategy on Canada and the International Labour Organization (ILO) and a three year action plan in January 2011. The Strategy seeks to advance Canada's interests at the ILO and engage provinces and territories on ILO related issues, including raising awareness and reviewing selected ILO Conventions for possible ratification. In addition, as part of its mandate to represent Canada in international labour organizations, the Labour Program helped advance International Labour Organization (ILO) reform. Following two years of negotiations, agreement was reached in March 2010 on measures to reform the ILO Governing Body.
Implement decisions flowing from the Labour Program's Strategic Review
The Strategic Review found some scope for improvement in how the Labour Program delivers its mandate. Savings in three areas were identified.
Eliminate red tape and streamline service delivery:
- A service delivery model is being implemented in the Occupation Health and Safety Tribunal Canada that will benefit all parties by ensuring a more expeditious appeals process and protecting the independence of decision makers. Contracting out adjudication to the private sector is underway including activities to establish an appeals officer roster.
- A streamlined reporting process using the Workplace Equity Information Management system has been implemented, which had a 90% uptake by employers as they prepared their 2010 Employment Equity annual reports. Significant reduction of the reporting burden, calls to the program and requirements for data entry and validation have been noted. The Employment Equity Annual Report has been migrated to Web-based publishing.
- Work on the Racism-Free Workplace Strategy data collection system has been completed. The new system will support the ability of the Labour Program to focus its efforts and activities on prevention, education based initiatives, and the development of practical tools to help employers build fair and inclusive workplaces.
- Research and analysis to establish an alternative methodology for required fair wage schedules has commenced. The objective of fair wages schedules is to ensure that workers on federal construction sites will continue to be paid a fair wage and be treated fairly.
Better align funding with actual needs:
- The overall budget of the Labour Management Partnerships Program has been reduced to bring it in line with historical spending patterns, and to focus efforts on preventive mediation for organizations facing particularly challenging collective agreement negotiations for which organizations could benefit from third party support.
- The domestic stream of funding for the International Trade and Labour Program has been reduced; however, the Labour Program continues to act on its commitment to help Labour Cooperation Agreement partners achieve core labour standards by focusing on technical assistance and institutional grants.
Focus programs on core mandate and high priority areas:
- Physical decommissioning of the Occupational Health and Safety Laboratory is underway and a new more cost effective delivery model is being adopted for industrial laboratory services. The Labour Program continues to perform on-site evaluations in emergencies.
- The requirement for the Minister of Labour to approve first aid courses has been eliminated. The review and assessment of all first aid courses will now be the responsibility of each province and territory, which will eliminate duplication and recognize provincial and territorial expertise.
Through the Workforce Management Strategy, the Department has been working to achieve Strategic Review Outcomes with minimal impacts on employees.
2.2.1.2 Lessons Learned
The economic downturn and the fragile recovery highlighted the importance of ensuring cooperative and productive workplaces and effectively resolving workplace disputes. An important element of this is access to timely, relevant information on the economic impact of work stoppages on the Canadian economy. Over the course of 2010-2011, an advanced analytical model was developed improving the ability of the Labour Program to estimate the cost of work stoppages.
As a result of the economic downturn, the Labour Program adapted its guidance to employers so that employment equity considerations are built into policies and practices affecting expenditure restraint and downsizing, thus ensuring they remain free of systemic barriers. In addition, increased use of more tailored tools for employers has been pivotal in assisting them during the economic downturn.
2.3 Strategic Outcome #3 - Income security, access to opportunities and well-being for individuals, families and communities
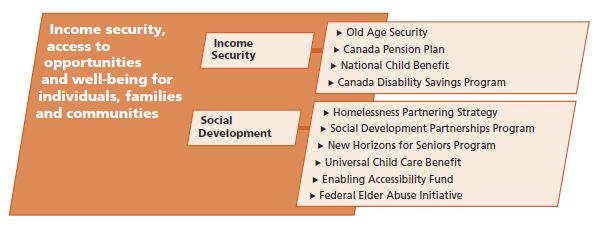
The strength of families, individuals and communities are key to fulfilling Canada's economic potential and maintaining Canadians' quality of life. Strategic investments through programs that help strengthen the capacity and effectiveness of communities and the not-for-profit sector contribute to the well-being of children and families, seniors, and other vulnerable populations and facilitates their participation in society.
Seniors constitute the fastest growing population in Canadian society and in the next 30 years, nearly one in four Canadians will be a senior. This represents a fundamental demographic shift in the population, and despite the fact that many of today's seniors are generally healthier, better educated and economically better off than their predecessors, there are seniors that remain vulnerable and face significant challenges. The CPP, OAS, and Guaranteed Income Supplement (GIS) aim, among other objectives, to ensure that seniors receive all the benefits to which they may be entitled and contribute to a stable income for them in retirement.
Income security is a significant challenge for people with disabilities. Many individuals with disabilities are not always able to earn an adequate income through employment. Recognizing these factors, the Government of Canada administers the Canada Pension Plan Disability (CPP-D) program and the Canada Disability Savings (CDSP)Program to support people with disabilities, their families and their caregivers through a variety of income support measures and tax incentives. HRSDC also contributes to income security for families and children through programs such as the National Child Benefit Supplement (NCBS) and the Universal Child Care Benefit (UCCB).
2.3.1 Program Activity: Income Security
This program activity ensures that Canadians are provided with retirement pensions, survivor pensions, disability benefits and benefits for children, through the OAS program, the CPP, the CPP-D Program and the NCB program.
The Department focuses on national legislative development, policy direction, program design, research and analysis to ensure that the OAS and CPP programs remain responsive to the current and future needs of Canadians. This includes efforts to expand awareness and increase take-up of public retirement income entitlements with a particular focus on vulnerable segments of the population who often experience barriers to receiving information and assistance through traditional government channels. This program activity also includes the administration of the CDS Program that helps parents and others save for the long-term financial security of people with severe or prolonged disabilities. Finally, through the NCB program, the federal government works in partnership with provincial and territorial governments to provide needed income support to families with children.
2010-2011 Financial Resources ($ millions)
| Planned Spending | Total Authorities | Actual Spending |
|---|---|---|
| 68,843.1 | 67,434.1 | 67,430.8 |
2010-2011 Human Resources (FTEs)
| Planned | Actual | Difference |
|---|---|---|
| 336 | 346 | (10) |
2.3.1.1 Performance Summary and Analysis of Program Activity
| Expected Results |
Performance Indicators |
Targets and Performance Status |
Historical Results |
||||||||||||||||||||||||
|---|---|---|---|---|---|---|---|---|---|---|---|---|---|---|---|---|---|---|---|---|---|---|---|---|---|---|---|
| Canada's seniors have an adequate level of income to maintain their standard of living | Low-income incidence, depth and persistencea among seniors using Market Basket Measure Source: Survey of Labour and Income Dynamics, 2008 |
Target [Actual 2007 Results (Revised)]
2008 Results
*The percentage of individuals aged 65 and over living in families with a disposable income below their low income threshold. ** The percentage by which the family income of persons in low income families falls short of the relevant threshold (for example, a family whose Market Basket Measure threshold is $25,000 with a disposable income of $20,000, would have a depth of low income of $5,000 or 20% ($5,000 divided by $25,000)). |
Not available | ||||||||||||||||||||||||
| a Following a review by the Department, "Persistence" will not be reported because it does not accurately reflect whether seniors can maintain their standard of living compared to what they were able to achieve while in the workforce. b When estimating low-income incidence and depth without the support of OAS, GIS and CPP, it is assumed that individuals' behaviour and the amounts received from other government income support programs remain unchanged. These assumptions produce an upper-bound estimation of the actual result. |
|||||||||||||||||||||||||||
The Department continued to contribute to a stable income for millions of older Canadians through the administration of Canada's national pension programs. This indicator measures the incidence of low income among seniors, using the Market Basket Measure. This measure, based on the cost of a specified basket of goods and services, was comprehensively reviewed by the Department in 2010 to ensure that it continued to embody a modest, basic standard of living within the current Canadian context.10
Benefits paid through the OAS, GIS and CPP programs significantly reduce the incidence and depth of low-income among seniors. Keeping all other incomes constant, incidence of low income among seniors could have been 46 percentage points higher in the absence of public pension programs in 2008. The depth of low-income could have been 36 percentage points higher under the same assumptions.
| Expected Results |
Performance Indicators |
Targets | Performance Status |
Historical Results |
|---|---|---|---|---|
| Eligible working-aged Canadians with severe and prolonged disabilities have a measure of income security. | Percentage of CPP contributors who have contributory coverage/eligibility for Canada Pension Plan Disability Source: Administrative Data |
67% | 2008 Results 67% Met In order to produce accurate information, a lag of two years is required before releasing statistics. |
2008: 67% 2007: 66% 2006: 66% |
The CPP-D program remains Canada's largest long-term disability insurance plan and is an important source of income replacement for eligible CPP contributors who cannot work due to severe and prolonged disability. Monthly benefits totalling $3.7 billion were provided to over 320,000 eligible contributors in 2010-2011, compared with 2009-2010, when approximately 315,000 individuals received benefits totalling $3.5 billion. Eligibility for the Canada Pension Plan disability benefit is based on contributions to the CPP and a medical determination of severe and prolonged disability.
While the contributory requirements have changed several times throughout the Plan's history, there has always been emphasis on recent contributions as well as on duration of contributions. Contributors to the CPP are eligible for CPP-D, notwithstanding the medical determination of eligibility, if they have contributed to the Plan in four of the last six years. Effective March 3, 2008, contributors who have 25 years or more of contributory coverage are eligible for CPP-D if they have contributed in three of the last six years. This important enhancement provides greater coverage for contributors with a long work history who may otherwise have been disqualified due to lack of recent workforce attachment over the past six years.
Between 2006 and 2008, contributory eligibility for women continued to lag behind that of men by 5% due to less consistent labour force participation by women during the six year contributory period. This differential is expected to narrow over time as the ongoing labour force participation of women increases and the reduction in the minimum qualifying period for workers drops (as noted above).
| Expected Results |
Performance Indicators |
Targets and Performance Status |
Historical Results |
||||||||||||||||||||||||||||||||
|---|---|---|---|---|---|---|---|---|---|---|---|---|---|---|---|---|---|---|---|---|---|---|---|---|---|---|---|---|---|---|---|---|---|---|---|
| Canadian members of families with children have an adequate level of income to maintain their standard of living | Low-income incidence, depth and persistence for individuals living in families with childrena using the Market Basket Measure Source: Survey of Labour and Income Dynamics, 2009 |
Target (Actual results from 2007)
2009 Results
* The percentage of individuals living in families with children with a family disposable income below their low income threshold. ** The percentage by which the family income of persons in low income families falls short of the relevant threshold (for example, a family whose Market Basket Measure threshold is $25,000 with a disposable income of $20,000, would have a depth of low income of $5,000 or 20%. *** The percentage by which the family disposable income of individuals cumulated over several consecutive years is below the total of the low-income threshold associated with their family for the same period. For persistence (longitudinal) the scenario "without support" only excludes NCBS and UCCB, because the WITB became available after the start of the measurement period. |
Not available | ||||||||||||||||||||||||||||||||
| a Children are defined as individuals less than 14 years of age at the start of the five-year period. bWorking Income Tax Benefit (WITB). |
|||||||||||||||||||||||||||||||||||
The Department continued to contribute to a significant income support to Canadian members of families with children through the administration of Canada’s national programs that helps families with the cost of raising children. The Market Basket Measure, based on the cost of a specified basket of goods and services, was comprehensively reviewed by the Department in 2010 to ensure that it continued to embody a modest, basic standard of living within the current Canadian context.11
Benefits paid through the NCBS, UCCB, or WITB programs reduce the incidence, depth and persistence of low-income among individuals living in families with children. Keeping all other incomes constant, the incidence of low income among these individuals could have been 3.8 percentage points higher in the absence of child benefits in 2009. The depth of low-income could have been 5.7 percentage points higher and persistence of low-income could have been 2.5 percentage points higher under the same assumptions.
| Expected Results |
Performance Indicators |
Targets and Performance Status |
Historical Results |
||||||||||||||||||||||||||||||||
|---|---|---|---|---|---|---|---|---|---|---|---|---|---|---|---|---|---|---|---|---|---|---|---|---|---|---|---|---|---|---|---|---|---|---|---|
| Canada's families with children have an adequate level of income to maintain their standard of living | Low-income incidence, depth and persistence for families with childrena using the Market Basket Measure Source: Survey of Labour and Income Dynamics, 2009 |
Target [Actual results from 2007]
2009 Results
* The percentage of families with children with a family disposable income below their low income threshold. ** The percentage by which the family income of families in low income falls short of the relevant threshold (for example, a family whose Market Basket Measure threshold is $25,000 with a disposable income of $20,000, would have a depth of low income of $5,000 or 20%). *** The percentage by which the family disposable income of families cumulated over several consecutive years is below the total of the low-income threshold associated with their family for the same period. For persistence (longitudinal) the scenario "without support" only excludes NCBS and UCCB, because the WITB became available after the start of the measurement period. |
Not available | ||||||||||||||||||||||||||||||||
| aChildren are less than 18 years old. For the persistence measure, they are less than 14 years of age at the start of the five-year period. b NCBS, UCCB and WITB. For persistence (longitudinal) the scenario "without support" only excludes NCBS and UCCB, because the WITB became available after the start of the measurement period. |
|||||||||||||||||||||||||||||||||||
The Department continued to contribute to a significant income support to Canadian families with children through the administration of Canada’s national programs that helps families with the cost of raising children. The Market Basket Measure, based on the cost of a specified basket of goods and services, was comprehensively reviewed by the Department in 2010 to ensure that it continued to embody a modest, basic standard of living within the current Canadian context.12
Benefits paid through the NCBS, UCCB, or WITB programs reduce the incidence, depth and persistence of low-income among families with children. Keeping all other incomes constant, the incidence of low income among families could have been 3.8 percentage points higher in the absence of child benefits in 2009. The depth of low-income could have been 5.2 percentage points higher and persistence of low-income could have been 3.0 percentage points higher under the same assumptions.
In addition to the results presented, HRSDC made progress on the following priorities:
Develop program policy and negotiate inter-governmental and international agreements for statutory income security programs
In recognition of the fact that many Canadians have lived and worked in other countries, the Department continued to actively pursue the negotiation of social security agreements with other countries. These agreements coordinate the operation of the CPP and the OAS program with the comparable programs of other countries and ensure that an individual's pension rights are protected. Moreover, they ensure that Canadians who work temporarily in another country do not have to contribute to both countries' pension programs for the same work. Canada has signed social security agreements with 53 countries and continues to negotiate with a number of other nations. Through these agreements, approximately $648 million in foreign pensions are paid into Canada annually while approximately $131 million in CPP and OAS benefits are paid to persons living outside of Canada.
Review and modernize the design of CPP and OAS to respond to the changing needs of Canadians and their families
There are a number of factors that present both challenges and opportunities to ensure the CPP and OAS programs remain responsive to the needs of Canadians now and in the future. These include a diverse and aging population of Canadians who are living longer and healthier lives, and who are also realizing greater opportunities for employment later in life within the evolving labour market. HRSDC recognizes the lingering effects of the recent economic downturn on income security and how the current climate of fiscal restraint affects our clients. With this in mind, the Department is working with Finance Canada to support the Federal-Provincial/Territorial CPP Triennial Review Process to ensure the long-term sustainability of the CPP while ensuring it can adapt to societal and demographic changes. Amendments to the CPP as part of Bill C-51 (The Economic Recovery Act), were a direct result of findings from the Triennial Review and will help ensure that the CPP remains fair and sustainable.
Work continues on simplifying the delivery of OAS and CPP to respond to the aging population and anticipated growth in numbers of individuals seeking benefits. The Department continues to consult with experts and partners to map out a transformation strategy to address long standing CPP-D service and program issues and to develop options for new, more efficient business models.
2.3.1.2 Lessons Learned
Overall, the CPP-D summative evaluation found that the benefit remains as relevant today as it was at its inception. Disability that affects work capacity continues to be a key risk faced by working-age Canadians and public disability insurance remains an equitable and economically efficient way of addressing this risk. In terms of areas for improvement, the evaluation identified the following:
- disability determination is a challenging task for CPP-D, and one that warrants ongoing consideration to ensure consistency of decision-making across regions and over time;
- the CPP-D application process is complex, and CPP-D granted and denied applicants reported it to be long, complex, and stressful;
- there is a need to improve collaboration with partners, as similarities exist in application processes of complementary programs; and
- in order to support return-to-work efforts, options can be explored to maximize access to employment resources and services for both approved and denied clients.
In the Management Response to the evaluation, HRSDC identified activities that will address areas for improvement. For example, the Department is developing a quality assurance framework that expands CPP-D's current performance measurement system to include a range of indicators such as quality of decision-making. As well, in terms of simplifying the application process, CPP-D is exploring ways to expedite disability determination, and is also considering possibilities for information sharing with complementary programs. The program has also committed to an examination of return-to-work supports, focusing on improvements to CPP-D's trial work, automatic reinstatement, and vocational rehabilitation programs.
2.3.2 Program Activity: Social Development
This program activity supports programs for children, families and seniors, with an added focus on the homeless or those at risk of being homeless as well as people with disabilities. In collaboration with communities, HRSDC provides these groups with knowledge, information, and opportunities to move forward with their own solutions to social and economic challenges through the following programs:
- Through the New Horizons for Seniors Program (NHSP), the Department helps seniors benefit from and contribute to the quality of life in their communities. Community-based projects address social challenges "on the ground" while national or regional projects address elder abuse, including financial abuse, by raising awareness, developing and sharing information, and networking.
- The Social Development Partnerships Program (SDPP) is designed to advance the social development and inclusion of children, families, people with disabilities and other vulnerable populations through targeted investments in not-for-profit sector organizations who assist these groups.
- The Enabling Accessibility Fund (EAF) provides funding to community based projects across Canada that improve accessibility and enable Canadians with disabilities to participate in and contribute to their community.
- The Homelessness Partnering Strategy (HPS) works to prevent and reduce homelessness across Canada through strategic investments in communities, using a planning process that relies on communities to determine their own needs and develop appropriate projects to find local solutions for homeless people and those at risk.
This program activity also includes the Universal Child Care Benefit, the cornerstone of Canada's Universal Child Care Plan.
2010-2011 Financial Resources ($ millions)
| Planned Spending | Total Authorities | Actual Spending |
|---|---|---|
| 2,862.6 | 2,954.6 | 2,917.3 |
2010-2011 Human Resources (FTEs)
| Planned | Actual | Difference |
|---|---|---|
| 719 | 506 | 213 |
2.3.2.1 Performance Summary and Analysis of Program Activity
| Expected Results |
Performance Indicators |
Targets | Performance Status |
Historical Results |
|---|---|---|---|---|
| Working with partners to: - reduce social and economic barriers for individuals, families, and communities; and - promote access to opportunities for individuals, families, and communities. |
Percentage of households living in core housing need Source: Census, Statistics Canada |
12.7% | 2006 Resultsa 12.7% |
Not available |
| Number of Canadians participating and/or benefiting from Social Development grant and contribution programs. Source: Administrative Data Note: Social Development grant and contribution program include: New Horizons for Seniors program, Social Development Partnerships Program, Enabling Accessibility Fund, Understanding the Early Years Program, and the Homelessness Partnering Strategy. |
Baseline Year | 2010-2011 Results 2,215,889 |
Not available | |
| aData to determine core housing need is derived from the Census. The last year available for Census results was 2006 and as the Census occurs on a five-year cycle, updated information will not be available until 2012. The Horizontal Initiative Table http://www.tbs-sct.gc.ca/dpr-rmr/2010-2011/inst/csd/st-ts00-eng.asp for the Homelessness Partnering Strategy provides additional details on results achieved. |
||||
Social development programs provide valuable support to individuals, families and communities. Through partnerships with the not-for-profit sector, the Department continued to provide access to opportunities, knowledge and information to help individuals and communities move forward with their own solutions to social and economic challenges.
| Expected Results |
Performance Indicators |
Targets | Performance Status |
Historical Results |
|---|---|---|---|---|
| Working with partners to: - reduce social and economic barriers for individuals, families, and communities; and - promote access to opportunities for individuals, families, and communities. |
Percentage of eligible children under age 6 for whom parents are receiving the Universal Child Care Benefit (UCCB)a. Source: Canada Revenue Agency and Statistics Canada Post Censal Data |
100% | 2010-2011 Results 94.5% Mostly Met |
2009-2010: 94% 2008-2009: 93% 2007-2008: 92.5% 2006-2007: 87.2% |
| a This indicator replaces "Distribution of children 0-6 by type of primary-care arrangement" as it is a better indicator of the expected result. Effective in 2010-2011, take-up rates are estimated based on number of children, not on number of families as reported in previous years. This new approach provides a more accurate take-up rate between census periods as it is calculated based on annual postcensal estimates of the under 6 child population. | ||||
The UCCB provides financial assistance to all Canadian families with young children to support the choice of child care that best meets their needs. Since its inception in 2006, UCCB take-up has increased year over year and currently stands at 94.5%.
To simplify the application process and increase take-up of child benefits, including the UCCB, the Canada Revenue Agency (CRA) has implemented the Automated Benefits Application initiative. This joint partnership between the CRA and provincial/territorial Vital Statistics Agencies offers the parents of newborns the option of checking a single box on the birth registration form, which triggers automated applications for federal child benefits, related provincial/territorial programs, and the GST/HST credit.
In addition to the results presented, HRSDC made progress on the following priority:
Develop and manage program policy, design and delivery, as well as negotiate and maintain intergovernmental agreements for social development measures
HRSDC continued to support communities and not-for-profit organizations in their efforts to tackle local challenges. This included, for example, partnering with innovative charities and forward-thinking private sector companies on new approaches to addressing complex social issues.
The Department, through its strategic partnerships with provinces and territories, communities and other stakeholders, continued to assist those who are homeless or at risk of becoming homeless to move towards self-sufficiency, including seniors, people with disabilities, recent immigrants and Aboriginal people in need of support. The government renewed the HPS until 2014 at the current funding level of $134.8 million per year with a number of key enhancements. Additionally, in 2010-2011, the Department launched six new horizontal pilot projects with other federal departments and agencies to address factors that may lead to homelessness, such as incarceration, employment status, mental health challenges, family violence and immigration. In this same period, seven properties were transferred, resulting in 189 housing units being created through the Surplus Federal Real Property for Homelessness Initiative, which provides surplus federal properties to community organizations, the not-for-profit sector and other levels of government for projects that aim to prevent and reduce homelessness.
Through Budget 2010, the Department invested an additional $5 million per year in the NHSP, bringing the program's total budget to $40 million. In addition, in 2010-2011, HRSDC developed modest enhancements to the program to allow a broader array of organizations to develop a greater variety of projects to meet the changing needs of communities. The enhanced program will be fully implemented in 2011-2012, and combined with the additional funding, will allow the NHSP to support projects that encourage seniors to volunteer and mentor other generations, as well as initiatives that aim to increase awareness of elder abuse, including fraud and financial abuse.
By investing in not-for-profit organizations who support the well-being of Canadians, the SDPP continued to help improve the lives of children and families, people with disabilities and other vulnerable Canadians. The program helps organizations develop a better understanding of the issues Canadians face and provide greater access to information, programs and services. The EAF also continues to support community-based projects across Canada that improve accessibility, remove barriers, and enable Canadians with disabilities to participate in and contribute to their communities.
2.3.2.2 Lessons Learned
A summative evaluation of the Community Participation and Leadership (CPL) component of the New Horizons for Seniors Program, covering the period of 2004 to 2008 was recently completed. The report indicated that seniors were involved in leading almost all CPL projects to some extent and that seniors were utilizing their experience, skills and wisdom both as project leaders and participants, thus demonstrating the program is meeting its objectives. The evaluation also recommended that the program design be examined to facilitate greater involvement of seniors who have not previously led or participated in funded projects and to increase volunteerism among seniors. To address some of the findings, a review of the program's design was undertaken to identify potential improvements including how to facilitate greater involvement of seniors. In addition, regional staff worked with communities and engaged in activities and workshops to encourage organizations to involve senior and other volunteers in their projects. The Department's website and the Program's application materials were updated to reiterate the importance of volunteerism.
2.4 Strategic Outcome #4 - Service excellence for Canadians
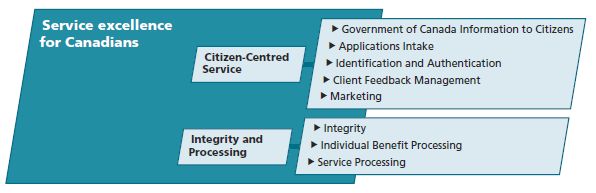
Text description of Strategic Outcome #4 - Service excellence for Canadians
Service excellence for Canadians is about providing personalized access to Government of Canada information, programs and services in a convenient manner, in both official languages, utilizing various channels-including online, telephone, in-person, mail or fax-so that Canadians have access to the support they need, when they need it. Service excellence also means continuing to improve the quality and cost-effectiveness of service delivery, responding quickly and effectively to changing levels of demand for services and client feedback.
Finally, providing service excellence for Canadians means that when Canadians apply for Government of Canada benefits or services, they receive an accurate benefit payment or a notification of non-payment in a timely manner, and that all personal information is protected from inappropriate use and access, and managed in accordance with relevant legislation and policies.
2.4.1 Program Activity: Citizen-Centred Service
This program activity aims to improve and integrate government service delivery by providing Canadians with one-stop, easy-to-access, personalized service in the language of their choice. It is supported by overarching client segment strategies and partnerships with other departments, levels of government and community-based partners. This program activity also includes client feedback mechanisms and the responsibility for increasing public awareness of Service Canada.
2010-2011 Financial Resources ($ millions)a
| Planned Spending | Total Authorities | Actual Spending |
|---|---|---|
| 556.0 | 536.1 | 520.9 |
| aFinancial and human resources amounts for this program activity include resources related to initiatives under Canada's Economic Action Plan. | ||
2010-2011 Human Resources (FTEs)
| Planned | Actual | Difference |
|---|---|---|
| 6,790 | 5,484 | 1,306 |
| aFinancial and human resources amounts for this program activity include resources related to initiatives under Canada's Economic Action Plan. | ||
2.4.1.1 Performance Summary and Analysis of Program Activity
| Expected Results |
Performance Indicators |
Targets | Performance Status |
Historical Results |
|---|---|---|---|---|
| Canadians have one-stop, personalized access to Government of Canada programs and services | Percentage of in person clients who were proactively offered information in addition to the original request (bundling of services for specific client groups) Source: Administrative Data |
Baseline Year | 2010-2011 Results 30% |
Not available |
Bundling refers to the practice of offering clients information on all of the programs and benefits to which they are entitled in addition to the information related to their original request. This practice helps to ensure that Canadians have one-stop, personalized access to Government programs and provides the information they need when making choices. Bundling increases the likelihood of clients only needing to contact Service Canada once, thereby improving their service experience and reducing workload pressures.
A number of tools offered by the Department use the bundling principle. For example, both the Service Canada and Canada Benefits websites are organized according to client needs, which includes life events such as seeking a job, raising a family or preparing for retirement. The Department also has specialized call centres for Canadians seeking information on its core programs (EI, CPP and OAS) and offers client information sessions on federal and provincial support available to workers.
The indicator tracks whether clients leaving Service Canada Centres recall being offered information on more than one program and reflects client responses up to six months after their visit to a Service Canada Centre. The methodology is under review as the timing of the survey may have had a negative effect on the result. For example, of those surveyed immediately after their visit, 67% responded positively whereas those who were surveyed well after their visit were less likely to recall being offered information on more than one program.
| Expected Results |
Performance Indicators |
Targets | Performance Status |
Historical Results |
|---|---|---|---|---|
| Canadians have one-stop, personalized access to Government of Canada programs and services | Percentage of clients satisfied with the quality of service received through channels Source: Administrative Data |
85% | 2010-2011 Results 1 800 O-Canada: 89% In-person: 88% Internet: 79% Phone*: 78% Mail/fax: 72% Mostly Met |
2007-2008: 1 800 O-Canada: 90% In-person: 88% Internet: 84% Phone*: 84% Mail/fax: 83% 2005-2006: 1 800 O-Canada: 92% In-person: 86% Internet: 79% Phone*: 78% Mail/fax: 79% |
| * Excludes 1 800 O-Canada clients. | ||||
The Department provides access to Government information in different ways-online, by telephone, in person or by mail and fax-allowing clients to choose when and how they will receive the information they need. This indicator looks at how satisfied clients are with the service they received. Satisfaction is measured through the biennial Client Satisfaction Survey (CSS), which surveys clients who have accessed services in the previous six months.
The 2010 CSS indicates that clients expressed satisfaction with the service they received from Service Canada. In an effort to make service delivery more user-friendly and efficient, Service Canada is working to improve client satisfaction with the Internet channel, and has been encouraging Canadians to self-serve through greater use of this channel.
| Expected Results |
Performance Indicators |
Targets | Performance Status |
Historical Results |
|---|---|---|---|---|
| Canadians have one-stop, personalized access to Government of Canada programs and services | Number of federal partners under agreement with Service Canada for service delivery Source: Administrative Data |
11 | 2010-2011 Results 11 Met |
2009-2010: 13 |
The Department is responsible for providing services to Canadians. Partnerships with other federal government departments enable effective and efficient service delivery and allow Canadians to request many different services in one place, whether on the Internet, by telephone, in person, by mail or fax. This one-window approach helps the Department realize its objective of providing service excellence for Canadians.
The 2010-2011 results reflect the stable ongoing relationships between HRSDC and its federal partners for service delivery. Two partnership arrangements expired during the year: the Chinese Head Tax Redress Initiative and the Short Term Transitional Measures for Quebec and Atlantic Canada Lobster Licence Holders.
The Department was instrumental in ensuring that the programs and services it delivered served the needs and interests of Canadians throughout the economic downturn. Canadians were consistently able to access key programs, such as OAS and EI, and were supported by online tools such as Finding a Job. Most clients felt their service expectations were met, and in addition to the results presented above, the Department also made progress on the following priorities:
Respond to continued high demand for service
The Department's delivery of measures under the EAP remained a priority focus in 2010-2011. By year-end, a total of 2.9 million EI claims had been filed, or 276,000 claims more than the pre-downturn level of 2.6 million claims. In addition, the Department experienced increased workload in other areas of its business given increased claim volumes, including revised claims and call centre activity. These workload pressures required careful management of human resources, in particular regular adjustments to the size of its temporary workforce consistent with workload requirements. Additional term workers helped ensure that the Department achieved its Speed of Payment targets and that the EAP-related workload, including backlogs in Integrity and Appeals, were addressed to the fullest extent possible before March 31, 2011. Starting in January 2011, a dedicated national processing unit operated for 12 weeks to reduce the Appeals backlog.
In an effort to respond quickly to labour market adjustments and to fast-track access to employment and training programs, HRSDC provided 17,824 information sessions to employers and more than 5,200 information sessions to clients. At these sessions, bundled information relating to the various programs and services was offered.
The Department also continued the Rapid Response initiative, launched in response to the EAP. Through this initiative, staff travelled to communities/work sites to provide service directly to employers (1,570 sessions) and workers facing imminent layoffs (970 sessions). These sessions were provided within 24 hours of the Department learning that a business was affected.
Continue service improvement
When accessing services, 53% of HRSDC clients use more than one service channel. Recognizing that clients have channel preferences, the Department has worked to optimize front-line service delivery. This has been done through the development of a multi-channel service delivery model and roadmap designed to align the channels in delivering efficient and effective service so that more Canadians will only need one channel to get what they need. In addition, the Department developed a three-year partnership strategy that focuses on providing information to applicants along as well as application intake services.
In 2010-2011, the Department continued to improve the quality of its service offerings. Building on the success of the EI cross-channel support service to resolve transactions at first point of contact, the Department identified a variety of common activities that could be resolved in real-time, thereby improving the client experience and reducing workload for processing staff. In December 2010, the specialized EI call centre network launched a pilot to provide expanded training to a subset of experienced agents to resolve client enquiries that would have otherwise been transferred to processing centres. This pilot is part of the larger client contact centre vision with an objective to increase first contact resolution and provide better and more efficient service to Canadians.
The specialized call centres for EI, CPP and OAS received more than 55.4 million calls for information and services during 2010-2011. During the year, a new interactive voice response (IVR) system was implemented in EI, CPP and OAS in an effort to improve the information available to clients and promote self-service. The IVR system facilitated the resolution of 31.3 million calls while agents responded to 9.8 million enquiries (6.8 million EI enquiries and 3 million CPP and OAS) during 2010-2011.
Improvements to Internet-based services enabled clients to view and update their information with EI, CPP and OAS in a single point of service. In addition to upgrading the infrastructure supporting My Service Canada Account (MSCA), the Department has been developing new strategies to make it easier for Canadians to register and access MSCA, by improving electronic services. Registration for MSCA increased by 8% to 15.0 million logins in 2010-2011, up from 14.7 million in 2009-2010.
To encourage Canadians to access services through self-service mechanisms, information videos were introduced on the Department's website. Twelve related directly to EI programs and services, including two new videos explaining the EI process for self-employed workers. The most popular video was "Applying for EI," which represented 29% of nearly 470,000 downloads. In an online questionnaire, 62% of respondents either agreed or strongly agreed that the video enabled them to complete a transaction successfully. In addition, the new network of electronic monitors in Service Canada Centres is designed to strengthen service delivery and provide self-service guidance to clients, encouraging them to visit the Service Canada website.
The Office for Client Satisfaction received 6,372 pieces of client feedback for 2010-2011. The majority of client feedback related to EI, CPP and OAS services. Key issues related to information requests, access to toll-free lines and speed of payment. To improve the client experience for requests for information, an In-Person Service Experience Model was developed that helps ensure seamless citizen-centred service is delivered. In addition, standardized curricula for employees were developed to ensure consistent delivery of a high standard of service excellence. The curricula are monitored and evaluated continually in support of the achievement of service standards.
As part of the Department's continued focus on its official language priorities, HRSDC has worked to implement a three-year official languages action plan. This includes initiatives to: achieve greater consistency in capacity across the country to provide quality bilingual services; institute formal oversight mechanisms aimed at monitoring the quality of bilingual services and measuring performance; expand the existing action plan and policies to cover all parts of bilingual service delivery; and, establish a more coordinated mechanism for consulting with national, provincial and regional representatives of official language minority communities.
2.4.1.2 Lessons Learned
The economic downturn highlighted the importance of providing citizens with convenient and timely access to secure online services and information. Research, client feedback and an analysis of usage trends demonstrated the need for an increased focus on online service, with MSCA being the most popular service used on the Service Canada website.
Social media can be a valuable tool to obtain key insights into client service delivery preferences. An internal project was launched to learn how to better meet the service delivery needs of young Canadians. Through online collaboration with the Department's youth services officer community, valuable information was gathered that will be used to develop a 'Marketing to Youth' strategy but also to identify ways to deliver services to youth–using online tools like websites, web videos and social media to direct youth towards the Department's Internet-based service offerings in the way they would like to be served.
HRSDC worked hard to manage continued high demand for services. Supporting learning activities that enable service excellence, the Department used technology to provide staff with the necessary tools to meet the continued high demand for service. HRSDC offered a variety of courses, allowing employees to provide timely, bundled service offerings for workers who were laid off. By implementing a learning roadmap and curriculum for in-person staff, developing additional courses, and offering the Service Excellence Certification Program, the Department placed an emphasis on having employees that are ready and equipped to meet the changing needs of Canadians.
2.4.2 Program Activity: Integrity and Processing
This program activity enhances and strengthens the integrity of HRSDC services and programs to ensure that the right person receives the right service or benefit at the right time, and for the intended purpose.
As a result of activities undertaken in this area, the Department is in a better position to meet its objectives with respect to the timeliness and accuracy of payments, the security and privacy of personal information, and the overall quality of service offerings. The Department maintains management frameworks, processes and risk-based controls so that programs are delivered in a timely and secure manner. This activity verifies that quality management systems are functioning and supports the stewardship of public funds.
2010-2011 Financial Resources ($ millions)a
| Planned Spending | Total Authorities | Actual Spending |
|---|---|---|
| 738.3 | 763.4 | 748.6 |
| aFinancial and human resources amounts for this program activity include resources related to initiatives under Canada's Economic Action Plan. | ||
2010-2011 Human Resources (FTEs)a
| Planned | Actual | Difference |
|---|---|---|
| 10,022 | 9,064 | 958 |
| aFinancial and human resources amounts for this program activity include resources related to initiatives under Canada's Economic Action Plan. | ||
2.4.2.1 Performance Summary and Analysis of Program Activity
| Expected Results |
Performance Indicators |
Targets | Performance Status |
Historical Results |
|---|---|---|---|---|
| Services and benefits are delivered accurately | Payment Accuracy of Employment Insurance Source: Administrative Data |
95% | 2010-2011 Results 94.0% Met |
2009-2010: 96.1% 2008-2009: 95.7% 2007-2008: 94.6%a 2006-2007: 94.8% |
| Payment Accuracy of Canada Pension Plan Source: Administrative Data |
95% | 2010-2011 Results 99.0% Exceeded |
2009-2010: 99.9% 2008-2009: 99.5%a |
|
| Payment Accuracy of Old Age Security/Guaranteed Income Supplement Source: Administrative Data |
95% | 2010-2011 Results 99.4% Exceeded |
2009-2010: 99.5% 2008-2009: 98.4% 2007-2008: 99.9%a |
|
| aThe historical results have been updated as previous DPR reports used December data rather than year to date March data (94.3%, 99.7% and 97.7% respectively). | ||||
The EI, CPP and OAS National Payment Accuracy Review (PAAR) provides the Department with feedback on the financial controls of expenditures from the EI Account, CPP Account and the Consolidated Revenue Fund by providing detailed information on the causes, sources and amounts of monetary errors undetected at the time of adjudication. These three performance indicators help the Department to eliminate or reduce errors.
| Expected Results |
Performance Indicators |
Targets | Performance Status |
Historical Results |
|---|---|---|---|---|
| Services and benefits are delivered securely | Percentage of clients whose information was put at risk, that were notified within 10 business days that their information was put at risk Source: Administrative Data |
100% | 2010-2011 Results 92.7% Mostly Met |
Not available |
The Department notifies identified clients whose personal information was inadvertently put at risk due to incidents such as lost or misdirected mail, mechanical or human error, as soon as possible. The Department takes every reasonable step within its legislative authorities to contact the client within 10 days. At times the notification is after the 10 day period when the situation is more complex and additional time is required to confirm and verify the incident and information.
| Expected Results |
Performance Indicators |
Targets | Performance Status |
Historical Results |
|---|---|---|---|---|
| Services and benefits are delivered in a timely manner | Percentage of Employment Insurance benefit payments or non-payment notifications issued within 28 days of filing Source: Administrative Data |
80% monthly | 2010-2011 Results 83.9% fiscal year average Met or Exceeded every month |
2009-2010: 84.2% 2008-2009: 79.1% |
Timeliness is the single most important driver across all services for ensuring client satisfaction. This indicator, and those that follow below, are part of the published Service Standards to Canadians and directly contributes to the achievement of the strategic outcome Service excellence for Canadians. The monthly target of 80% was met or exceeded in every month, with results ranging from 80.1% to 91.1%. Meeting the commitment on a monthly basis requires just-in-time recruitment, training, and monitoring of processing staff to address pronounced seasonal intake spikes.
The Department received 2,917,508 EI initial and renewal claims in 2010-2011, 12.3% more than the number of claims recorded prior to the economic downturn. To help with the volume of EI claims, the Department used five temporary national processing centres in Newfoundland and Labrador, New Brunswick, Nova Scotia, Quebec and Ontario. These centres handle complex and more time-consuming claims, allowing first level processing staff to focus on the high volume of straightforward claims. With the introduction of the National Workload System (NWS) in November 2010, the capacity to assign claims to other parts of the country improved, to help manage workflow.
| Expected Results |
Performance Indicators |
Targets | Performance Status |
Historical Results |
|---|---|---|---|---|
| Services and benefits are delivered in a timely manner | Percentage of Canada Pension Plan retirement benefits paid within the first month of entitlement Source: Administrative Data |
85% | 2010-2011 Results 96.9% Exceeded |
2009-2010: 96.2% 2008-2009: 91.3% 2007-2008: 91.9% 2006-2007: 92.8% 2005-2006: 91.0% |
For clients who applied early (i.e. applications received prior to the month of entitlement), payment was issued no later than the first month of entitlement. For clients who apply late (i.e., applications received in or after the first month of entitlement), payment was issued no later than the month following the month of application. Due to difference in processes and timelines, results do not include benefits paid by National Information and Benefits Services and International Operations.
A total of 662,647 CPP applications were processed in 2010-2011, compared to 637,831 in 2009-2010. This total includes applications for Retirement, Death Survivor, Disability, Children's Benefits, Credit Splitting and Pension Sharing.
| Expected Results |
Performance Indicators |
Targets | Performance Status |
Historical Results |
|---|---|---|---|---|
| Services and benefits are delivered in a timely manner | Percentage of Old Age Security basic benefits paid within the first month of entitlement Source: Administrative Data |
90% | 2010-2011 Results 92% Met |
2009-2010: 91.7% 2008-2009: 92.1% 2007-2008: 93.7% 2006-2007: 94.1% 2005-2006: 94.0% |
For clients who applied before their 65th birthday, payment was issued in the month they turn 65. For clients who applied after their 65th birthday, payment was issued no later than the month following the month of application. Due to differences in processes and timelines, results do not include benefits paid by International Operations.
A total of 2,359,654 OAS applications were processed in 2010-2011, a minor increase from last year. This total includes applications for basic OAS Pension, automated renewals through a data feed from the CRA, as well as manual renewals for the GIS, Allowance, and Allowance for the Survivor.
Total also includes the Estimates of Income and Foreign Benefit Applications and Liaisons where Service Canada helps Canadian citizens apply for benefits in another country. For example, Service Canada may provide to another country the time periods of residence in Canada to another country to help the client qualify for a foreign pension.
| Expected Results |
Performance Indicators |
Targets | Performance Status |
Historical Results |
|---|---|---|---|---|
| Services and benefits are delivered in a timely manner | Percentage of Apprenticeship Incentive Grant initial payments and non-payment notifications issued within 28 calendar days Source: Administrative Data |
85% | 2010-2011 Results 99% Exceeded |
2009-2010: 98% 2008-2009: 97% 2007-2008: 90% Note: Service standard was modified to include non-payment notifications. Historical results reflect the new service standard. |
A total of 74,611 Apprenticeship Incentive Grant (AIG) applications were received in 2010-2011, a decrease of 8% compared to 2009-2010. 51,476 grants were paid, for a total of $51.5 million. Since the program's inception, 62,481 (47%) of applicants have received both level 1 and 2 grants.
| Expected Results |
Performance Indicators |
Targets | Performance Status |
Historical Results |
|---|---|---|---|---|
| Services and benefits are delivered in a timely manner | Percentage of Apprenticeship Completion Grant initial payments and non-payment notifications issued within 28 calendar days Source: Administrative Data |
Baseline Year | 2010-2011 Results 95% |
Not available |
A total of 30,949 Apprenticeship Completion Grant applications were received and 25,678 grants were paid in 2010-2011, the program's first complete fiscal year of operation.
| Expected Results |
Performance Indicators |
Targets | Performance Status |
Historical Results |
|---|---|---|---|---|
| Services and benefits are delivered in a timely manner | Percentage of initial Wage Earner Protection Program payments and non-payment notifications issued within 42 calendar days Source: Administrative Data |
80% | 2010-2011 Results 95% Exceeded |
Not available |
A total of 14,974 WEPP applications were received in 2010-2011, a 17% decrease compared to the volume of applications received in 2009-2010. A total of 14,305 payments were made in 2010-2011.
| Expected Results |
Performance Indicators |
Targets | Performance Status |
Historical Results |
|---|---|---|---|---|
| Services and benefits are delivered in a timely manner | Percentage of Social Insurance Numbers (SINs) issued in one visit (based on complete applications with all supporting documents) and cards issued within five business days from date of receipt of request Source: Administrative Data |
SINs in one visit: 90% SIN cards in 5 days: 90% |
2010-2011 Results SINs in one visit: 97.9% SIN cards in 5 days: 94.0% Exceeded |
2009-2010: SINs in one visit: 97.4% SIN cards in 5 days: 93.2% |
In addition to the results presented, HRSDC made progress on the following priorities:
Transforming service
The Department continued to take steps toward the vision of one client, one workload, and one process for processing of EI claims. The NWS was successfully implemented nationally in November 2010. The NWS is a key enabler to balancing levels of service across the National Processing and Payment Network as it allows Service Canada to strategically determine where and by whom the work gets done (e.g. centres of specialization). The reduction of geographical boundaries provides the opportunity for HRSDC to manage workload and workforce at the local, sector, regional or national level to eliminate gaps in Speed of Payment results from region to region and ensure EI claimants are treated equally.
The Department developed plans to support the phased-in implementation of an enterprise-wide solution to reduce the reliance on paper handling and improve the ability to capture data by improving the management of paper processing and storage. This project involves the scanning of paper EI documents to convert them to quality electronic images that are then made available for viewing by users granted access to a secure website developed and provided by Public Works and Government Services Canada. To ensure privacy protocols and safeguards are well established, there is an ongoing collaboration within the Department between the Access to Information and Privacy Directorate and Legal Services on all matters related to the design and implementation of the imaging solution. This includes, among other issues, ensuring legislative compliance, assessing the risks of imaging itself, paper destruction and retention of documents and developing appropriate mitigation strategies as the Department moves forward.
The national implementation of this project has been an essential step towards improving client service. The Department is now assessing the potential to expand the solution to other business lines, with internal and external consultations nearing completion and analysis initiated to ensure the best secure solution is identified for the Department.
The e-ROE is HRSDC's response to a long standing request from employers to facilitate the Record of Employment (ROE) process. ROE Web is a secure Web-based application that enables employers to create, submit, view, retrieve, amend and print ROEs at any time. The ROE Web now has over 240,000 employers registered, enabling them to submit ROEs online, and over 20 million ROEs have been submitted electronically since the program's inception. In 2010-2011, as a direct result of targeted marketing efforts with employers, 5.25 million (or 60%) out of a total of 8.6 million ROEs, were received electronically.
In July 2010, the Department was presented with a Partner Award from the Canadian Payroll Association resulting from its ongoing efforts to streamline ROE processes and improve e-ROE products including the change made to the EI Regulations in 2009. Improvements decreased the administrative burden on employers, while enhancing the Department's ability to provide timely, accurate service to EI claimants.
The client base for OAS, GIS and CPP is projected to increase significantly over the next decade. It is anticipated that by 2020-2021, approximately 6.9 million Canadians will receive OAS/GIS benefits and nearly 5.8 million will receive CPP. The Department has developed a comprehensive strategy that will meet this changing client demand, control increasing costs and enhance the stewardship for these two pension programs. Leveraging lessons learned from the transformation of the delivery of the EI program, the department has identified initiatives that will facilitate easier access to benefits, leverage current investments in new technology, and provide a broader range of electronic services.
Enhance stewardship of benefit programs and personal information
In support of the stewardship of benefit programs and services and management of personal information, the Department made significant progress toward implementing a comprehensive, risk-based approach to reviews and investigations, with a particular focus on strengthening the integrity of EI, CPP and OAS benefit processing and payment. For EI, advanced risk-based techniques were implemented nationally to better identify and prioritize high-risk cases requiring review or investigation. For the CPP and OAS programs, an integrity modernization strategy was developed to better understand key causes of incorrect payments and to test the most effective approaches to address these issues. In addition, comprehensive program integrity risk assessments of the EI, CPP and OAS programs were undertaken to support ongoing enhancements to the integrity of these programs.
HRSDC was able to yield substantial savings of $740 million for the federal government in 2010-2011. These savings stem from identifying and subsequently discontinuing benefits that were issued as a result of suspected fraud or abuse of EI, CPP, and OAS programs. Included in this total are direct savings (overpayments and associated penalties that are identified as a result of integrity activities and are subject to recovery), and indirect savings (reductions in future program payments and avoidance of future costs resulting from the discontinuation of benefits).
2.4.2.2 Lessons Learned
Examples of lessons learned in service delivery include:
Enhancements to the Department's current suite of online electronic services will allow revisions to be made to applications in an electronic format. This will reduce paper usage as well as enable further automation. MSCA is the key enabler and will see a more user-focused registration and authentication model put in place with the installation of new features and functionality. Having an improved front-end and being supported by useful applications will increase the chance of a successful campaign to encourage EI Claimants to use MSCA.
When launching a new aspect of the Wage Earner Protection Program (WEPP), service channels were equipped ahead of time with the necessary information to provide clients with relevant and timely guidance. In addition, a directive was issued to inform employees of new processing guidelines and details concerning the completion of necessary forms. Both of these measures were key to ensuring timely and effective delivery of an enhanced WEPP.
2.5 Internal Services
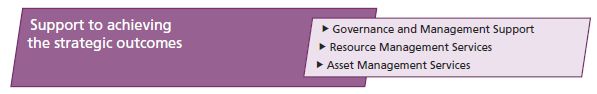
Text description of Internal Services
2.5.1 Program Activity: Internal Services
Internal Services are groups of activities that support the needs of programs and meet the corporate obligations of an organization. They include the following Branches: Chief Financial Officer, Human Resources Services, Legal Services, Strategic Policy and Research, Public Affairs and Stakeholder Relations, Internal Audit Services, Internal Integrity and Security, and Innovation and Information Technology. Internal Services also includes activities related to the Department's governance, which are supported by its Corporate Secretariat, including ministerial services, governance and meeting the Department's obligations under the Access to Information Act and the Privacy Act.
2010-2011 Financial Resources ($ millions)a
| Planned Spending | Total Authorities | Actual Spending |
|---|---|---|
| 898.7 | 944.6 | 925.3 |
| aFinancial and human resources amounts for this program activity include resources related to initiatives under Canada's Economic Action Plan. | ||
2010-2011 Human Resources (FTEs)a
| Planned | Actual | Difference |
|---|---|---|
| 6,525 | 5,686 | 839 |
| a Financial and human resources amounts for this program activity include resources related to initiatives under the Canada's Economic Action Plan. | ||
2.5.1.1 Performance Summary
The following examples demonstrate the importance of internal services to the Department's success in delivering results to Canadians.
Enabling Services Renewal Program
The Department completed a review of enabling services which highlighted an opportunity to transform the delivery of human resources, information management and technology, as well as financial management. The review led to the establishment of the Enabling Services Renewal Program (ESRP). This initiative will improve the internal client experience through the implementation of a three-tiered service model ("Click, Call, Consult"), providing increased opportunities for automated transactions and self-service, and will result in the implementation of new information technology systems for human resources, financial and materiel management, including the replacement of the Departmental Accounts Receivable System. When fully implemented, the ESRP will contribute significantly to the goals of a more focused, modern and efficient organization.
People Management and Public Service Renewal
The Department identified three priorities to reflect the new approach to human resources management in the Public Service: support renewal of the organization by enabling people management strategies; support the Department's management excellence agenda by continuing to equip managers to meeting their HR accountabilities; and transform human resource services to enable better people management outcomes through the ESRP. A Human Resources Policy Framework was developed to provide consistency and efficiency in the governance of people management by making approved human resource policies accessible and transparent to managers, employees, unions and other stakeholders.
The Department continued to maximize the efficiency and effectiveness of routine human resource transactions, freeing capacity to enable the provision of more strategic support to departmental clients. These initiatives supported the Department in building a healthy, enabled workplace and workforce, with strong executive and managerial leadership. In addition, HRSDC was selected by Mediacorp Canada Inc. for five awards placing the Department amongst Canada's Top 100 Employers, Canada's Best Diversity Employers, Canada's Top Family-Friendly Employers, the National Capital Region's Top Employers, and Canada's Best Employers for New Canadians.
Information Technology Strategy
In 2010-2011, a detailed technology inventory was established with the completion of HRSDC's IT Asset Plan. This plan will facilitate informed decision making regarding investment in IT assets over the next five years. In addition, the Innovation, Information and Technology Branch five-year strategic plan was developed to provide the foundation to evolve the organization. The strategy is designed to ensure effective execution and measurable performance while adapting to dynamic internal and external environments.
Stakeholder Engagement
The department developed and implemented a Departmental Stakeholder Relations Plan (DSRP) to strengthen the coherence and relevance of stakeholder relations activities across the portfolio, ensure alignment of activities with priorities, and to track and report on key stakeholder relations activities. The DSRP identified, tracked and reported on close to 60 priority engagement activities in 2010-2011. Examples of engagement by Ministers and the Department include: Pre-Budget, Disability Strategy and National Seniors Council roundtable discussions. At the branch level, examples include: Canada's Aging Workforce, Workplace Skills, Aboriginal Skills and Employment Training Strategy and Immigrant Literacy and Essential Skills roundtable discussions. The Department also developed a performance indicator framework to better evaluate engagement initiatives, which will be implemented in fiscal year 2011-2012.
2.5.1.2 Lessons Learned
HRSDC delivered results thanks to strong internal partnerships and planning during 2010-2011. For example, facing an extensive transformation agenda, the Department has learned that using an integrated business planning process led by senior executive management is an effective means to identify horizontal risks and impacts of business decisions across the department. As part of the process, identifying the cross-cutting risks associated with the Department's extensive transformation agenda led to executives meeting regularly to monitor the alignment of resources across the various competing activities while ensuring the ongoing development and delivery of policies, programs and services.
2.6 Summary of HRSDC's Contribution to Canada's Economic Action Plan
As part of Budget 2009, the Government of Canada introduced Canada's Economic Action Plan, which provided additional financial investments and introduced new programs to help Canadians during the recession and provide them with the training necessary to prosper once the economy recovers. During 2010-2011, HRSDC contributed to the following measures under the EAP:
- Extending the duration of EI benefits by an additional 5 weeks.
- In 2010-2011, EI claimants received $796 million in additional benefits.
- Under Career Transition Assistance (CTA): extending Employment Insurance benefits for up to two years for long-tenured workers participating in longer-term training; allowing earlier access to EI benefits for workers who have received severance packages, if they use some or all of their severance to pay for skills upgrading or training.
- In 2010-2011, EI claimants benefiting from the CTA measures received $83 million.
- Extending the duration of work-sharing (WS) agreements by up to 14 weeks, to a maximum of 1 year and providing greater flexibility in the qualifying criteria and streamlined processes for applications. These agreements are designed to help companies facing a temporary slowdown in business avoid laying off workers by offering EI benefits to employees who
agree to work fewer hours per week while their employer recovers. Budget 2010 continued the EAP temporary WS measures by further extending active or recently terminated WS agreements by up to 26 weeks, to a maximum of 78 weeks. The flexibility in qualifying criteria was also maintained for new agreements. Both these measures were effective until April 2, 2011.
- Since the EAP changes were implemented in February 2009, more than 279,000 Canadians have participated in more than 10,000 work-sharing agreements. In 2010-2011, with improvements in the economy, the level of demand for Work-Sharing and number of participants decreased sharply, resulting in lower expenditures than expected.
- Expanding the Wage Earner Protection Program to cover severance and termination pay owed to eligible workers when their employer does not pay due to bankruptcy.
- The WEPP was expanded to cover severance and termination pay owed to eligible workers when their employer goes bankrupt or is subject to receivership. For 2010-2011, 14,974 applications were received and 14,305 applicants were paid, for a total of $31.9 million with an average payment of $2,343. Since the inception of the Program in 2008, there have been 39,301 claims of which 33,550 claims were paid. The total payments to claimants since the inception of the Program up to and including March 31, 2011, is $70.6 million.
- Since the EAP expansion of the WEPP on January 27, 2009, a total of 31,318 WEPP claimants received $70,683,546 in overall WEPP payments of which $42,246,413 related to severance and termination reimbursements.
- Increasing funding for training delivered by provinces and territories under Labour Market Development Agreements through the EI Program.
- Investing in the STTF, which is delivered through existing LMAs, to support provincial and territorial initiatives that help workers in communities and sectors affected by the recession, retrain to maintain employment or find new jobs, regardless of EI eligibility. In addition to the existing LMA accountability framework, P/Ts are required to provide quarterly reports on the number of clients served to support the Government of Canada's broader EAP forecasting and reporting.
- Provinces and territories will provide their final reports to HRSDC by September 2011 on the number of clients they were able to serve in 2010-2011 using the STTF. In 2009-2010, just over 52,000 Canadians were directly assisted; and it is estimated based on the results of the first two quarters, that 70,000 Canadians will have been served in 2010-2011.
- Providing additional funding through the Youth Employment Strategy (Canada Summer Jobs) over two years to help young Canadians find summer jobs.
- More than 22,000 agreements were signed in 2010-2011 to fund approximately 37,000 jobs, of which approximately 3,500 can be attributed to the funding received from the EAP.
- Implementing the YMCA and YWCA Grant(s) for Youth Internships, placing unemployed youth in internships with not-for-profit and community organizations with a focus on environmental projects.
- 1,008 youth participated in internships, of which 91% had an environmental focus.
- Broadening eligibility and increasing funding for the Targeted Initiative for Older Workers (TIOW), which provides employment assistance services and training or work experience to older workers (aged 55 to 64) living in vulnerable communities.
- Since April 1, 2009, 196 projects have been approved (72 in 2010-2011) and 56 projects have been extended - many several times. These projects target 11,511 unemployed older workers (2,818 in 2010-2011).
- As of October 2010, the TIOW has become national in scope with all provincial and territorial jurisdictions having signed agreements.
- Continuing the implementation of the ACG to provide an extra incentive for Canadians to participate in and complete apprenticeships.
- In 2010-2011, there were 25,678 EAP grants issued to completing apprentices who also obtained journeyperson certification in the Red Seal trades.
- Implementing the pan-Canadian foreign qualification recognition framework in partnership with provinces and territories.
- Working closely with partners and key stakeholders to implement the FCR Framework, the FCR program successfully negotiated contribution agreements with seven provinces/territories to address regional issues relating to FCR. The program also signed agreements with national associations and regulatory bodies that are responsible for all 2010 priority occupations. These agreements enable partners and key stakeholders to streamline their assessment and recognition processes.
- Implementing ASEP Fund projects to help Aboriginal people develop skills and receive training to improve their labour market prospects.
- 20 ASEP projects underway, targeting approximately 6,500 Aboriginal individuals trained and up to 4,000 Aboriginal individuals securing long-term jobs.
- Implementing the ASTSIF projects to assist Aboriginal people to acquire the necessary skills to adapt to the changing labour market environment and secure long-term jobs.
- From the period of April 1, 2010 to March 31, 2011, approximately 9,000 clients were served and increased their employability through ASTSIF regional and national projects combined; of which approximately 2,200 secured employment and over 1,500 returned to school.
- Keeping EI rates at their current level until the end of 2010, instead of increasing them.
- The EI premium rate for 2009 and 2010 was frozen, projecting net relief of $2.4 billion for Canadian workers and employers. The EI premium increase will be limited to 5 cents for 2011, providing an estimated $1.2 billion in relief.
- In addition, HRSDC has implemented the Fairness for the Self-Employed Act, to provide EI maternity, parental/adoption, sickness and compassionate care benefits to self-employed Canadians on a voluntary basis; and the extension of Employment Insurance benefits for long-tenured workers.
- As of March 28, 2011, there were 7,024 self-employed individuals registered to the EI program.
- In 2010-2011, $731.2 million has been received by long-tenured workers through extended EI benefits.
For additional information about the EAP visit: www.actionplan.gc.ca
| Initiative | 2010-2011 Financial Resources (millions of dollars) | ||
|---|---|---|---|
| Planned Spending | Total Authorities | Actual Spending | |
| Direct Payments to Individuals / Benefits | |||
| Increase in EI Regular Benefits Duration (extra 5 weeks) | 575.0 | 796.0 | 796.0 |
| New Measures for Long-Tenured Workers-The Career Transition Assistance Initiative (EI) | 250.0 | 82.9 | 82.9 |
| EI Long-Tenured Workers (Extension of Regular Benefits) | 600.0 | 731.2 | 731.2 |
| Work-Sharing (EI) | 100.0 | 49.0 | 49.0 |
| Wage Earner Protection Program | 25.7 | 21.3 | 21.2 |
| Sub-Total-Direct payments to Individuals / Benefits | 1,550.7 | 1,680.4 | 1,680.3 |
| Contribution Agreements / Other Programs | |||
| EI Training Programs (LMDA Increased Funding) | 500.0 | 500.0 | 500.0 |
| Strategic Training and Transition Fund | 253.5 | 253.4 | 253.4 |
| Canada Summer Jobs Program | 10.1 | 10.1 | 10.1 |
| Targeted Initiative for Older Workers | 28.2 | 28.2 | 20.7 |
| Apprenticeship Completion Grant | 40.0 | 40.0 | 40.0 |
| Foreign Credential Recognition Program | 22.7 | 22.6 | 17.7 |
| Aboriginal Skills and Employment Partnership | 69.0 | 69.0 | 49.2 |
| Aboriginal Skills and Training Strategic Investment Fund | 50.0 | 49.9 | 46.6 |
| Federal Public Service Student Employment Program | 1.5 | 1.5 | 1.5 |
| Sub-Total -Contribution Agreements / Other Programs | 975.0 | 974.7 | 939.2 |
| Total HRSDC | 2,525.7 | 2,655.1 | 2,619.5 |
Section III Supplementary Information
3.1 Financial Highlights
The financial highlights presented within this Departmental Performance Report are intended to serve as a general overview of HRSDC's financial position and operations. The Department's unaudited consolidated financial statements are available online at www.hrsdc.gc.ca/eng/publications_resources/dpr/dpr/
financial_statement/dpr_1011_financial_e.shtml.
HRSDC is financed by the Government of Canada through parliamentary authorities. Financial reporting of authorities provided to HRSDC do not parallel financial reporting according to generally accepted accounting principles since authorities are primarily based on cash flow requirements. Consequently, items recognized in the Consolidated Statement of Operations and the Consolidated Statement of Financial Position are not necessarily the same as those provided through authorities from Parliament. A reconciliation between authorities used and the net cost of operations is set out in Note 3 of the Department's consolidated financial statements.
These consolidated financial statements include the transactions of the Employment Insurance Operating (EIO) Account, a sub-entity under the control of HRSDC. The accounts of this sub-entity have been consolidated with those of HRSDC and all inter-organizational balances and transactions have been eliminated. The balance of the Canada Pension Plan (CPP) assets on deposit in the Consolidated Revenue Fund and the actuarial value of the Government Annuities Account (GAA) are presented as liabilities in the departmental statements.
The purpose of this section is to explain the Department's 2010-2011 financial highlights, based on the Department's consolidated financial statements. The charts below illustrate the ending balances, as of March 31, for each major financial statement grouping, along with the corresponding change from the previous fiscal year. In summary, between 2009-2010 and 2010-2011, the Department's assets increased by 0.5%, its liabilities decreased by 10.4%, its expenses decreased by 0.2%, and its revenues increased by 4.7%. Below the charts are explanations for the variances in each major grouping based on the most significant factors that affected each grouping during the fiscal year.
| % Change | 2011 | 2010 | |
|---|---|---|---|
| Total Assets | 0.5% | 14,405.7 | 14,341.1 |
| Total Liabilities | -10.4% | 2,487.6 | 2,777.4 |
| Total Equity | 3.1% | 11,918.1 | 11,563.7 |
3.2 Financial Highlights Charts/Graphs
Assets by Type
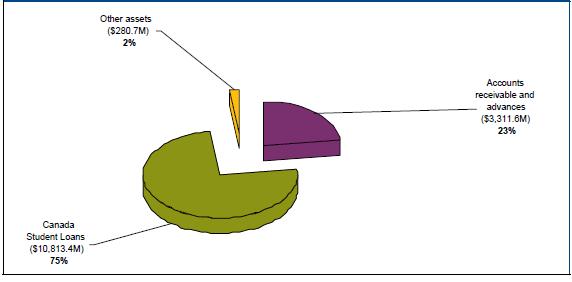
Text description of Assets by Type
Total assets amounted to $14,405.7 million as at March 31, 2011, an increase of $64.6 million (0.5%) over the previous year's total assets of $14,341.1 million. The increase in assets is mainly due to an increase of $695.0 million in Canada Student Loans caused by an excess of new loans disbursed over the total amount of repayments. This increase was partially offset by a decrease of $328.8 million in the amount due from the Consolidated Revenue Fund and a decrease of $273.8 million in the Accounts receivable and advances caused by the recovery, in 2010-2011, of the 2009-2010 Quebec Parental Insurance Plan account receivable.
Liabilities by Type
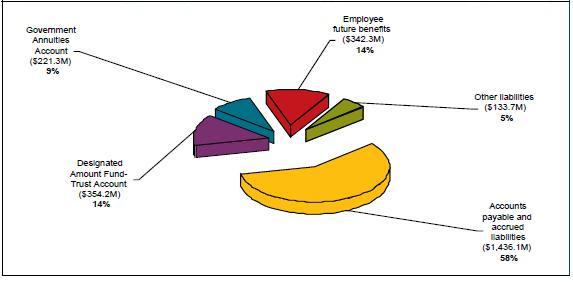
Text description of Liabilities by Type
Total liabilities amounted to $2,487.6 million as at March 31, 2011, a decrease of $289.8 million (10.4%) over the previous year's total liabilities of $2,777.4 million. The decrease in liabilities is mainly due to a decrease in Accounts payable and accrued liabilities caused by a one time account payable in 2009-2010 with respect to interest earned on the EI Account which had been repealed in 2009-2010, and a decrease in the amount due to CPP caused by the timing of the cash on deposit to the Receiver General for Canada.
| % Change | 2011 | 2010 | |
|---|---|---|---|
| Expenses | |||
| Transfer payments | (-0.5%) | 62,124.6 | 62,466.0 |
| Operating expenses | (4.9%) | 3,783.0 | 3,605.1 |
| Total expenses | (-0.2%) | 65,907.6 | 66,071.1 |
| Revenues | |||
| EI revenues | (4.3%) | 17,919.9 | 17,177.0 |
| Other | (13.4%) | 817.6 | 720.9 |
| Total revenues | 4.7% | 18,737.5 | 17,897.9 |
| Net Cost of Operations | (-2.1%) | 47,170.1 | 48,173.2 |
Expenses by Major Program Activity
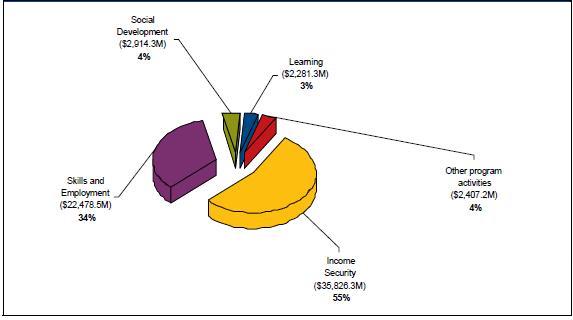
Text description of Expenses by Major Program Activity
Total expenses for the 2010-2011 year amounted to $65,907.6 million, a decrease of $163.5 million (0.2% ) over the previous year's total expenses of $66,071.1 million. The decrease in total expenses is mostly attributable to:
- A decrease of $1,685.2 million in Skills and Employment expenses due to a decrease in the average unemployment rate from 8.4% in 2009-2010 to 7.9% in 2010-2011 which results from the economic recovery;
- An increase of $990.8 million in Income Security expenses due to the increase in the eligible Old Age Security / Guaranteed Income Supplement benefits caused by the aging population and the increase in the monthly benefit amount;
- An increase of $361.7 million in Learning expenses due to the new Canada Student Grants Program, the Canada Education Savings Incentive Program and the increase in the allowance for bad debts on Canada Student Loans caused by a greater number of loans;
- An increase of $120.7 million in Social Development expenses mostly due to the increase in the Universal Child Care Benefit Program caused by the increasing number of children eligible for these benefits.
Revenues by Major Program Activity
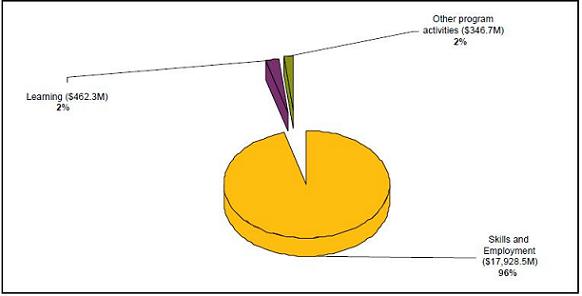
Text description of Revenues by Major Program Activity
Total revenues for the 2010-2011 year amounted to $18,737.5 million, an increase of $839.6 million (4.7%) over the previous year's total revenues of $17,897.9 million. The majority of this increase can be explained by an increase in Employment Insurance Premiums related to the economic recovery and its impact on the employment that went up by an average of 1.89% over 2010-2011 and to the increase in the maximum insurable earnings.
3.3 Financial Statements
List of Supplementary Information Tables
All electronic supplementary information tables found in the 2010-2011 Departmental Performance Report can be found on the Treasury Board of Canada Secretariat's website at www.tbs-sct.gc.ca/dpr-rmr/2010-2011/index-eng.asp
- Sources of Respendable and Non-Respendable Revenue
- User Fees Reporting
- Details of Transfer Payment Programs
- Horizontal Initiatives
- Green Procurement
- Response to Parliamentary Committees and External Audits
- Internal Audits and Evaluations
Section IV - Other Items of Interest
4.1 Specified Purpose Accounts
Introduction
Specified Purpose Accounts consist of special categories of revenues and expenditures. They report transactions of certain accounts where enabling legislation requires that revenues be earmarked and that related payments and expenditures be charged against such revenues. The transactions of these accounts are to be accounted for separately.
HRSDC is responsible for the stewardship of five such accounts:
- the EI Operating Account;
- the CPP;
- the Government Annuities Account;
- the Civil Service Insurance Fund; and
- the Canada Millennium Scholarship Foundation Excellence Awards Fund.
The EI Operating Account is a consolidated Specified Purpose Account and is included in the financial reporting of the Government of Canada. Consolidated Specified Purpose Accounts are used principally where the activities are similar in nature to departmental activities and the transactions do not represent liabilities to third parties but, in essence, constitute government revenues and expenditures.
The CPP is a Specified Purpose Account but is not consolidated as part of the Government of Canada financial statements. It is under joint control of the government and the participating provinces. As administrator, the government's authority to spend is limited to the balance of funds available in the Plan.
The Government Annuities Account is not a consolidated Specified Purpose Account. It was established by the Government Annuities Act, and modified by the Government Annuities Improvement Act, which discontinued sales of annuities in 1975. The account is valued on an actuarial basis each year, with the deficit or surplus charged or credited to the Consolidated Revenue Fund.
The Civil Service Insurance Fund is not a consolidated Specified Purpose Account. It was established by the Civil Service Insurance Act. Pursuant to subsection 16(3) of the Civil Service Insurance Regulations, the amount of actuarial deficits is transferred from the Consolidated Revenue Fund to the Civil Service Insurance Account in order to balance the assets and liabilities of the program.
The Canada Millennium Scholarship Foundation Excellence Awards Fund is not a consolidated Specified Purpose Account. It was established in order for HRSDC to administer the remaining Excellence Awards payments to eligible students upon the dissolution of the Canada Millennium Scholarship Foundation, which was ending after its ten-year mandate. HRSDC will administer the remaining Excellence Awards disbursements from January 1, 2010 until December 31, 2013. After this date, HRSDC will transfer any funds remaining in the account to the Consolidated Revenue Fund.
The following information updates forecasted data on the Employment Insurance Operating Account and the Canada Pension Plan that the Department provided in the 2010-2011 Report on Plans and Priorities. That report presented multi year financial data and general information. Additional information about performance and year-end data is available at the Internet addresses provided in this section.
Employment Insurance Operating Account
The table below summarizes the financial results for the EI Operating Account from 2009-2010 to 2010-2011.
| (millions of dollars) | Actual | |
|---|---|---|
| 2009-2010 | 2010-2011 | |
| Expenditures | ||
| Benefits | 21,586 | 19,850 |
| Administrative Costs | 2,031 | 1,916 |
| Doubtful Accountsb | 50 | 42 |
| Sub-Total | 23,667 | 21,808 |
| EI Premiums and Penalties | ||
| Premiums | 17,121 | 17,862 |
| Penalties | 42 | 46 |
| Interest (Overdue Accounts Receivable) | 13 | 11 |
| Sub-Total | 17,175 | 17,919 |
| Government Funding (Budget 2009) | 1,522 | 1,428 |
| Annual (Deficit) Surplus | (4,970) | (2,462) |
| Cumulative (Deficit) Surplus | (4,936)c | (7,397) |
| Premium Rate (% of Insurable Earnings) |
2010 | 2011 |
| Employee | 1.73% | 1.78% |
| Employer | 2.42% | 2.49% |
| a The EI Operating Account is a consolidated Specified Purpose Account and is included in the financial reporting of the Government of Canada. Consolidated Specified Purpose Accounts are used principally where the activities are similar in nature to departmental activities and the transactions do not represent liabilities to third parties
but, in essence, constitute government revenues and expenditures. b Represents write-offs and estimates of uncollectible account receivables for benefit overpayments and penalties imposed. c The cumulative deficit as of March 31, 2010, includes the EI Operating Account surplus of $34M accumulated from January 1, 2009 to March 31, 2009. Note: Totals may not add due to rounding. |
||
The new EI Operating Account records all EI-related credits and charges since January 1, 2009, the date on which it was established in the accounts of Canada. The Canada Employment Insurance Financing Board (CEIFB) was created to improve the governance and management of Employment Insurance financing. Starting in 2011, the Board has been responsible for setting the EI premium rate based on a new rate-setting mechanism. This mechanism is designed to ensure that Employment Insurance revenues and expenditures break even over time.
Revenues from EI premiums increased in 2010-2011 due to higher insurable earnings resulting from an increase in employment. EI benefit payments decreased compared to 2009-2010 due to a decrease in the number of beneficiaries and in the number of weeks of benefits paid. It is important to note that $1.4 billion in additional funding from the Consolidated Revenue Fund was provided to offset the additional expenditures associated with the temporary EI measures which were introduced in Budget 2009. Expenditures, however, still exceeded total revenues by $2.5 billion.
More detailed information is reported in the 2010-2011 audited EI Operating Account financial statements that are included in the 2011 Public Accounts of Canada, Volume 1, Section 4.13 HRSDC also offers information on Employment Insurance on its website.14 It provides information on the authority, objectives and details of the program as well as links to Actuarial Reports and the Employment Insurance Commission's annual Monitoring and Assessment Reports.
Canada Pension Plan
The following table summarizes the financial results for the Canada Pension Plan (CPP) from 2008-2009 to 2010-2011.
More information relating to 2010-2011 is reported in the Canada Pension Plan financial statements which can be found in the 2011 Public Accounts of Canada, Volume 1, Section 6.
| (millions of dollars) | Actual | Forecast | Actual | |
|---|---|---|---|---|
| 2008-2009 | 2009-2010 | 2010-2011 | ||
| Revenue | ||||
| Contributions | 36,506 | 36,276 | 36,862 | 37,069 |
| Investment Income | ||||
| Canada Pension Plan | 6 | 1 | 1 | 2 |
| CPP Investment Boarda | (23,576) | 16,218 | - | 15,558 |
| Total Investment Income | (23,570) | 16,219 | 1 | 15,560 |
| Total Revenue | 12,936 | 52,495 | 36,863 | 52,629 |
| Expenditures | ||||
| Benefit Payments | 29,005 | 30,363 | 31,625 | 31,598 |
| Administrative Expensesb | 694 | 734 | 806 | 850 |
| Total Expenditures | 29,699 | 31,097 | 32,431 | 32,448 |
| Increase / Decrease | (16,763) | 21,398 | 4,432 | 20,181 |
| Year-end Balance | 110,022 | 131,420 | 135,852 | 151,601 |
| a CPP Investment Board actual amounts are based on their audited financial statements. The CPP Investment Board invests mainly in equities and fixed income securities. The investment income is composed of realized gains and losses from investments, unrealized gains and losses on investments held at the end of the period (change in fair
value) and foreign exchange gains and losses. For 2010 – 2011, there was a net investment gain. b Administrative expenses include CPP administrative expenses as well as CPP Investment Board administrative expenses. Note: All amounts from this table for 2008–2009 and 2009–2010 are the consolidated amounts found in the audited CPP annual financial statements. |
||||
Government Annuities Account
The table below summarizes the financial results for the Government Annuities Account from 2008-2009 to 2010-2011. Source of the figures is the Report of the Chief Actuary on the Government Annuities as at March 31, 2011.
| (millions of dollars) | Actual | ||
|---|---|---|---|
| 2008-2009 | 2009-2010 | 2010-2011 | |
| Actuarial Liabilities – Balance at Beginning of Year |
292.9 | 267.2 | 243.5 |
| Income | 19.4 | 17.5 | 15.8 |
| Payments and Other Charges | 42.0 | 38.7 | 35.8 |
| Excess of Payments and Other Charges Over Income for the Year | 22.6 | 21.2 | 20.0 |
| Actuarial Surplus | 3.1 | 2.5 | 2.2 |
| Actuarial Liabilities – Balance at End of the Year |
267.2 | 243.5 | 221.3 |
The annual report and financial statements for Government Annuities are available in the 2011 Public Accounts of Canada, Volume 1, Section 6.15
Civil Service Insurance Fund
The table below summarizes the financial results for the Civil Service Insurance Fund from 2008-2009 to 2010-2011.
| (millions of dollars) | Actual | ||
|---|---|---|---|
| 2008-2009 | 2009-2010 | 2010-2011 | |
| Opening Balance | 5.9 | 5.6 | 5.5 |
| Receipts and Other Credits | 0.0 | 0.1 | 0.0 |
| Payments and Other Charges | 0.3 | 0.3 | 0.3 |
| Excess of Payments and Other Charges Over Income for the Year | 0.3 | 0.2 | 0.3 |
| Balance at End of the Year | 5.6 | 5.5 | 5.2 |
| Note: Totals may not add due to rounding. | |||
The financial data for the Civil Service Insurance Fund are available in the 2011 Public Accounts of Canada, Volume 1, Section 6.16
Canada Millennium Scholarship Foundation Excellence Awards Fund
In accordance with Budget Implementation Act 2008, the Canada Millennium Scholarship Foundation has ended after its ten-year mandate. This Specified Purpose Account was established by way of an agreement between the Canada Millennium Scholarship Foundation and Human Resources and Skills Development Canada (HRSDC) in order for HRSDC to administer the remaining Excellence Awards payments to eligible students upon the dissolution of the Canada Millennium Scholarship Foundation. The transfer of funds also includes the costs of administering this program on behalf of the Canada Millennium Scholarship Foundation.
HRSDC will administer the remaining Excellence Awards disbursements from January 1, 2010 until December 31, 2013. After this date, HRSDC will transfer any funds remaining in the account to the Consolidated Revenue Fund.
| (millions of dollars) | Actual | ||
|---|---|---|---|
| 2008-2009 | 2009-2010 | 2010-2011 | |
| Opening Balance | - | - | 14.4 |
| Income and other creditsa | - | 14.8 | - |
| Payments and other charges | - | 0.4 | 7.1 |
| Excess of payments and other charges over income for the year | - | 14.4 | 7.1 |
| Closing Balance | - | 14.4 | 7.3 |
| a Receipts and other credits include a one-time payment of $14.8 million in 2009–2010 from the Canada Millennium Scholarship Foundation to the Specified Purpose Account for the purpose of administering remaining Excellence Awards between January 1, 2010 and December 31, 2013. | |||
4.2 Statutory Annual Reports
Old Age Security
The Old Age Security program is one of the cornerstones of Canada's retirement income system. Benefits include the basic Old Age Security pension, the Guaranteed Income Supplement and the Allowance. The Old Age Security program is financed from Government of Canada general tax revenues.
The following tables present information on monthly benefits, beneficiaries and payments by province or territory.
| (millions of dollars) Fiscal Year 2010–2011 |
Basic Pension | Income Supplement | Allowance | |||
|---|---|---|---|---|---|---|
| Single | Married | Regular | Survivor | Increase | ||
| Monthly benefit by fiscal year | ||||||
| 2010-2011 Actuals | ||||||
| January 1, 2011 | 524.23 | 661.69 | 436.95 | 961.18 | 1,065.45 | 0.5% |
| October 1, 2010 | 521.62 | 658.40 | 434.78 | 956.40 | 1,060.15 | 0.6% |
| July 1, 2010 | 518.51 | 654.47 | 432.19 | 950.70 | 1,053.83 | 0.3% |
| April 1, 2010 | 516.96 | 652.51 | 430.90 | 947.86 | 1,050.68 | 0.0% |
| 2010-2011 Estimates | ||||||
| January 1, 2011 | 522.67 | 659.71 | 435.66 | 958.33 | 1,062.27 | 0.5% |
| October 1, 2010 | 520.07 | 656.43 | 433.49 | 953.56 | 1,056.99 | 0.2% |
| July 1, 2010 | 519.03 | 655.12 | 432.62 | 951.65 | 1,054.88 | 0.3% |
| April 1, 2010 | 517.48 | 653.16 | 431.33 | 948.81 | 1,051.73 | 0.1% |
| 2009-2010 Actuals | ||||||
| January 1, 2010 | 516.96 | 652.51 | 430.90 | 947.86 | 1,050.68 | 0.0% |
| October 1, 2009 | 516.96 | 652.51 | 430.90 | 947.86 | 1,050.68 | 0.0% |
| July 1, 2009 | 516.96 | 652.51 | 430.90 | 947.86 | 1,050.68 | 0.0% |
| April 1, 2009 | 516.96 | 652.51 | 430.90 | 947.86 | 1,050.68 | 0.0% |
| Maximum amount paid (annual benefits) |
||||||
| 2010-2011 Actuals | 6,243.96 | 7,881.21 | 5,204.46 | 11,448.42 | 12,690.33 | 0.7% |
| 2010-2011 Estimates | 6,237.75 | 7,873.26 | 5,199.30 | 11,437.05 | 12,677.61 | 0.6% |
| 2009-2010 Actuals | 6,203.52 | 7,830.12 | 5,170.80 | 11,374.32 | 12,608.16 | 3.4% |
| Province or Territory |
March 2010 | March 2011 | ||||||
|---|---|---|---|---|---|---|---|---|
| Old Age Security (OAS) Pension | Guaranteed Income Supplement (GIS) | Allowance | GIS as % of OAS | Old Age Security (OAS) Pension | Guaranteed Income Supplement (GIS) | Allowance | GIS as % of OAS | |
| Newfoundland and Labrador | 77,362 | 46,025 | 4,376 | 59.49 | 80,628 | 46,908 | 4,142 | 58.18 |
| Prince Edward Island | 21,189 | 9,369 | 585 | 44.22 | 21,846 | 9,548 | 591 | 43.71 |
| Nova Scotia | 145,682 | 60,206 | 4,037 | 41.33 | 149,468 | 60,178 | 3,925 | 40.26 |
| New Brunswick | 115,916 | 55,074 | 4,021 | 47.51 | 119,180 | 56,195 | 4,083 | 47.15 |
| Quebec | 1,181,774 | 533,717 | 30,246 | 45.16 | 1,220,406 | 542,329 | 29,931 | 44.44 |
| Ontario | 1,737,000 | 493,407 | 27,070 | 28.41 | 1,782,123 | 510,303 | 27,500 | 28.63 |
| Manitoba | 166,245 | 56,934 | 3,101 | 34.25 | 168,977 | 56,141 | 2,839 | 33.22 |
| Saskatchewan | 148,590 | 53,167 | 2,879 | 35.78 | 149,953 | 52,321 | 2,732 | 34.89 |
| Alberta | 375,679 | 116,782 | 5,633 | 31.09 | 386,155 | 117,700 | 5,564 | 30.48 |
| British Columbia | 622,655 | 200,248 | 11,501 | 32.16 | 641,078 | 207,171 | 12,086 | 32.32 |
| Yukon | 2,828 | 859 | 42 | 30.37 | 2,971 | 878 | 44 | 29.55 |
| Northwest Territoriesa | 3,209 | 1,628 | 120 | 50.73 | 3,323 | 1,618 | 120 | 48.69 |
| Internationalb | 93,755 | 8,371 | 57 | 8.93 | 95,988 | 8,128 | 52 | 8.47 |
| Total | 4,691,884 | 1,635,787 | 93,668 | 34.86 | 4,822,096 | 1,669,418 | 93,609 | 34.62 |
| a Data for Nunavut are included. b Persons receiving Canadian OAS benefits under International Social Security Agreements. |
||||||||
| (dollars) Province or Territory |
Old Age Security (OAS) Pension |
Guaranteed Income Supplement (GIS) |
Allowance | Total |
|---|---|---|---|---|
| Newfoundland and Labrador | 492,780,492 | 197,757,515 | 25,334,750 | 715,872,757 |
| Prince Edward Island | 133,928,462 | 39,952,488 | 2,794,057 | 176,675,007 |
| Nova Scotia | 919,232,618 | 240,912,026 | 20,997,306 | 1,181,141,950 |
| New Brunswick | 733,504,277 | 233,757,005 | 22,981,693 | 990,242,975 |
| Quebec | 7,410,989,197 | 2,376,164,494 | 156,871,701 | 9,944,025,392 |
| Ontario | 10,434,004,245 | 2,626,277,194 | 171,102,289 | 13,231,383,728 |
| Manitoba | 1,034,276,730 | 241,240,780 | 17,017,056 | 1,292,534,566 |
| Saskatchewan | 931,479,891 | 220,894,028 | 16,774,124 | 1,169,148,043 |
| Alberta | 2,300,996,452 | 564,202,349 | 33,224,535 | 2,898,423,336 |
| British Columbia | 3,705,685,475 | 1,065,807,976 | 71,836,846 | 4,843,330,297 |
| Yukon | 18,017,009 | 4,019,691 | 201,168 | 22,237,868 |
| Northwest Territoriesa | 20,338,303 | 8,698,951 | 951,001 | 29,988,255 |
| Internationalb | 139,871,576 | 81,450,263 | 424,354 | 221,746,193 |
| Total | 28,275,104,727 | 7,901,134,760 | 540,510,880 | 36,716,750,367 |
| Recovery tax portion of OAS | (1,061,615,237) | - | - | (1,061,615,237) |
| Total including recovery tax | 27,213,489,490 | 7,901,134,760 | 540,510,880 | 35,655,135,130 |
| aData for Nunavut are included. bPersons receiving Canadian OAS benefits under International Social Security Agreements. |
||||
| Actual | 2010-2011 | |||
|---|---|---|---|---|
| (millions of dollars) | 2008-2009 | 2009-2010 | Planned | Actual |
| Revenues | ||||
| Interest Revenue on Direct Loans | 472.8 | 369.8 | 434.6 | 444.8 |
| Recoveries on Guaranteed Loans | 38.5 | 27.4 | 18.5 | 23.9 |
| Recoveries on Put-Back Loans (RS) | 13.1 | 11.0 | 7.7 | 11.5 |
| Total Loan Revenue | 524.4 | 408.2 | 460.8 | 480.2 |
| Expenses | ||||
| Transfer payment | ||||
| Canada Study Grants, Canada Access Grants and Canada Student Grants Program | 143.2 | 533.7 | 557.2 | 620.7 |
| Loan Administration | ||||
| Collection Costs (All regimes)a | 10.7 | 5.2 | 0.0 | 2.5 |
| Program Delivery Costs (DL) | 76.0 | 61.7 | 63.4 | 66.0 |
| Risk Premium to Financial Institutions (RS) | 0.7 | 0.6 | 0.5 | 0.3 |
| Put-Back to Financial Institutions (RS) | 3.8 | 3.6 | 3.1 | 2.3 |
| Administrative Fees to Provinces and Territories and SIF (DL ) | 14.7 | 19.3 | 25.5 | 26.7 |
| Total Loan Administration Expenses | 105.9 | 90.4 | 92.5 | 97.8 |
| Cost of Government Benefits to Students | ||||
| In-Study Interest Borrowing Expense (Class A - DL)b | 166.9 | 177.4 | 168.0 | 173.3 |
| In Repayment Interest Borrowing Expense (Class B - DL)b | 160.7 | 180.0 | 188.4 | 182.9 |
| In-Study Interest Subsidy (RS & GL) | 4.0 | 1.4 | 0.8 | 1.2 |
| Repayment Assistance Programsc | 93.2 | 74.9 | 96.3 | 88.9 |
| Claims Paid & Loans Forgiven (All regimes) | 23.2 | 22.5 | 21.9 | 12.5 |
| Total Cost of Govt Benefits to Students | 448.0 | 456.2 | 475.4 | 458.8 |
| Bad Debt Expensed | ||||
| Debt Reduction in Repayment Expense (DL) | 53.2 | 133.4 | 20.0 | 40.7 |
| Bad Debt Expense (DL) | 293.6 | 129.1 | 342.4 | 323.6 |
| Total Bad Debt Expense | 346.8 | 262.5 | 362.4 | 364.3 |
| Total Loan Expenses | 1,043.9 | 1,342.8 | 1,487.53 | 1,541.6 |
| Net Operating Results | 519.5 | 934.6 | 1,026.7 | 1,061.4 |
| Alternative Payments to Non-Participating Provinces (DL)e | 111.0 | 223.1 | 244.0 | 300.1 |
| Final Net Operating Results | 630.5 | 1,157.7 | 1,270.7 | 1,361.5 |
|
(DL) = Direct Loans a. These costs are related to collection activities performed by the Canada Revenue Agency. Figures for 2008-2009 have been adjusted by CRA and the new collection costs have been reflected. |
||||
For further information about the Consolidated Report on Student Loans, refer to http://www.hrsdc-rhdcc.gc.ca/eng/publications_resources/dpr/dpr/index.shtml
4.3 Organizational Contact Information
nc-spr-psr-cpa-pim-gd@hrsdc-rhdcc.gc.ca
- Results represent totals for HRSDC only. Results from other participating departments and agencies can be found in the Youth Employment Strategy supplementary table at http://www.tbs-sct.gc.ca/dpr-rmr/2010-2011/inst/csd/st-ts00-eng.asp
- See Education at a Glance 2010: OECD Indicators, www.oecd.org. There is a two-year lag in the data analyzed by the OECD.
- www.pathwaystoeducation.ca/results.html
- This percentage is based on the number of full-time students (aged 18 – 34) for 2010 – 2011 (1,258,000) as forecasted in the Actuarial Report on the Canada Student Loans Program as at 31 July 2010, and does not include the province of Quebec, the Northwest Territories or Nunavut as these jurisdictions do not participate in the CSLP.
- This percentage is based on the number of full- and part-time students participating in PSE as per the Labour Force Survey (2,068,325).
- Students withdrawing funds from their RESP may also receive a loan, grant or in-study interest subsidy.
- The amount for and number of grants includes the Canada Millenium Scholarship Foundation transitional grants and the new Canada Student Grants for: Persons from Low and Middle-Income Families; Full and Part-Time Students with Dependants; Part-Time Studies; Students with Permanent Disabilities; and Services and Equipment for Students with Permanent Disabilities.
- The students who received loans and the students who received grants are not mutually exclusive as the same person often receives both.
- www.hrsdc.gc.ca/eng/publications_resources/evaluation/2008/
industry_practices/page00.shtml - The data now includes the effect of all government income support programs affecting seniors (e.g. provincial programs, refundable GST credit and the Canada and Quebec Pension Plans).
- The data now includes the effect of all government income support programs affecting seniors (e.g. provincial programs, refundable GST credit and the Canada and Quebec Pension Plans).
- The data now includes the effect of all government income support programs affecting seniors (e.g. provincial programs, refundable GST credit and the Canada and Quebec Pension Plans).
- For further information, see http://www.tpsgc-pwgsc.gc.ca/recgen/txt/72-eng.html
- For further information, see http://www.hrsdc.gc.ca/en/ei/legislation/ei_act_tofprov_1.shtml
- For further information, see http://www.tpsgc-pwgsc.gc.ca/recgen/txt/index-eng.html
- For further information, see http://www.tpsgc-pwgsc.gc.ca/recgen/txt/index-eng.html