
Common menu bar links
Breadcrumb Trail
ARCHIVED - Public Health Agency of Canada - Report
 This page has been archived.
Archived Content
Information identified as archived on the Web is for reference, research or recordkeeping purposes. It has not been altered or updated after the date of archiving. Web pages that are archived on the Web are not subject to the Government of Canada Web Standards. As per the Communications Policy of the Government of Canada, you can request alternate formats on the "Contact Us" page.
Section III - Supplementary Information
Financial Highlights
| Condensed Statement of Financial Position for the year ended March 31 |
% Change | 2009-10 ($ M) | 2010-11 ($ M) |
|---|---|---|---|
| Total Assets | (35.3%) | 268.8 | 174.0 |
| Total Liabilities | (46.8%) | (243.4) | (129.6) |
| Equity of Canada | 74.8% | (25.4) | (44.4) |
| 268.8 | 174.0 | ||
| Condensed Statement of Financial Operations for the year ended March 31 |
% Change | 2009-10 ($ M) | 2010-11 Forecast ($ M) | 2010-11 ($ M) |
|---|---|---|---|---|
| Total Expenses | (35.4%) | 950.2 | 651.0 | 613.8 |
| Total Revenues | (33.3%) | 0.3 | 0.3 | 0.2 |
| Net Cost of Operations | (35.4%) | 949.9 | 650.7 | 613.6 |
Financial Statements
The Agency's ![]() 2010-11 Financial Statements are available online.
2010-11 Financial Statements are available online.
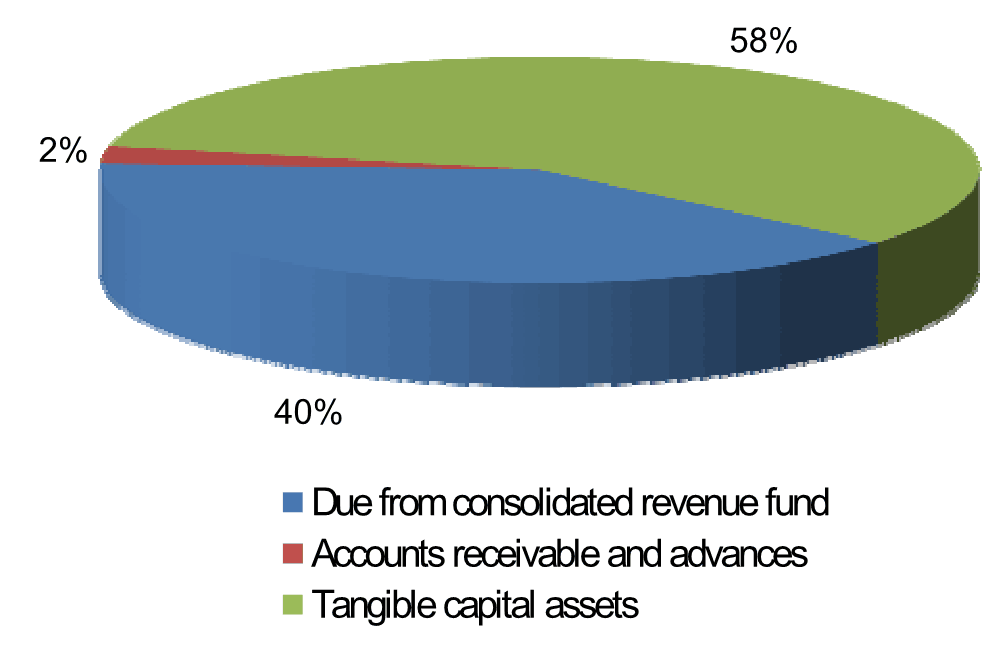
Assets by Type

Total assets were $174 million, a decrease of 35.3% ($94.8M) in comparison to the previous year's total of $268.8M. Due from consolidated revenue fund represented $69.2M (40%); Accounts receivable and advances represented $4.2M (2%) and Tangible capital assets represented $100.5M (58%) of total assets.
Liability by Type
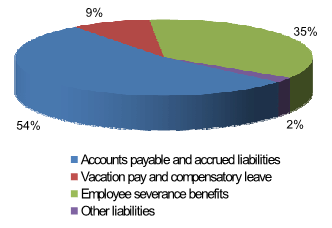
Total liabilities were $129.6M, a decrease of 46.8% ($113.8M) in comparison to the previous year's total of $243.4 million. Accounts Payable and Accrued Liabilities represented $69.5M (54%); Vacation Pay and Compensatory Leave represented $11.2M (9%); Employee Severance Benefits represented $46.0M (35%) and Other Liabilities represented $2.8M (2%) of total liabilities.
Expenses - Where Funds Go
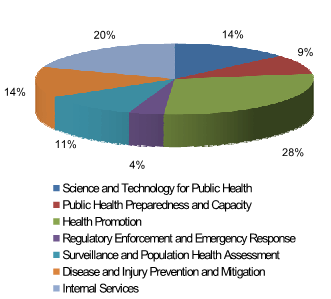
Total expenses for the Agency were $613.8M. The Agency spent $84..4M (14%) on Science and Technology for Public Health; $54.8M (9%) on Public Health Preparedness and Capacity; $175.6M (28%) on Health Promotion; $25.0M (4%) on Regulatory Enforcement and Emergency Response; $68.8M (11%) on Surveillance and Population Health Assessment; $84.9M (14%) on Disease and Injury Prevention and Mitigation and $120.5M (20%) on Internal Services.
Revenue - Where Funds Come From
The Agency receives most of its funding through annual Parliamentary appropriations although some revenue is generated from program activities. All cash received by the Agency is deposited to the Consolidated Revenue Fund (CRF) and all cash disbursements made by the Agency are paid from the CRF. The Agency's total revenue was $183.1 thousand of which $40.2 thousand is respendable.
List of Supplementary Information Tables
The following tables are located on the ![]() Treasury Board Secretariat Web site.
Treasury Board Secretariat Web site.
- Details on Transfer Payment Programs (TPPs)
- Green Procurement
- Horizontal Initiatives
- Internal Audits and Evaluations
- Sources of Respendable and Non-Respendable Revenue
Organizational Contact Information
Kathryn F. Howard
Assistant Deputy Minister
Emergency Management & Corporate Affairs
Public Health Agency of Canada
100 Colonnade Road
Ottawa ON - K1A 0K9
Footnotes
1 Statistics Canada. CANSIM Table 102-0121 and Catalogue no. 82-221-X.
2 Statistics Canada. CANSIM Table 102-0121 and Catalogue no. 82-221-X.
3 Statistics Canada. ![]() 37b-HLT: health adjusted life expectancy (HALE) by income. In: Comparable health indicators-Canada, provinces
and territories. Ottawa: Statistics Canada; 2001. Catalogue 82-401-XIE.
37b-HLT: health adjusted life expectancy (HALE) by income. In: Comparable health indicators-Canada, provinces
and territories. Ottawa: Statistics Canada; 2001. Catalogue 82-401-XIE.
4 ![]() Statistics Canada. [Accessed Aug 16, 2011.]
Statistics Canada. [Accessed Aug 16, 2011.]
5 Commencing in the 2009-10 Estimates cycle, the resources for Program Activity: Internal Services are displayed separately from other program activities; they are no longer distributed among the remaining program activities, as was the case in previous Main Estimates. This has affected the comparability of spending and FTE information by Program Activity between fiscal years.
6 ![]() See Public Accounts of Canada 2010.
See Public Accounts of Canada 2010.
7 Using a three-year period for publications creates a rolling average which smoothes year-over-year fluctuations in the amount of research published and provides sufficient time for publications to be cited.
8 The built environment can be broadly defined as environments that have been created or modified by people. These environments include: neighbourhood designs; schools; homes; workplaces; recreation areas; location of stores; and the location and design of roads; sidewalks, bike lanes and footpaths. The built environment is a key determining factor in the promotion of physical activity and the prevention of obesity.
9 The RPP 2010-11 commitment is to "increase or maintain workforce availability estimates based on April 1, 2009 baseline numbers." The percentage growth targets are still under development.