Common menu bar links
Breadcrumb Trail
ARCHIVED - Office of the Information Commissioner of Canada - Report
 This page has been archived.
Archived Content
Information identified as archived on the Web is for reference, research or recordkeeping purposes. It has not been altered or updated after the date of archiving. Web pages that are archived on the Web are not subject to the Government of Canada Web Standards. As per the Communications Policy of the Government of Canada, you can request alternate formats on the "Contact Us" page.
Section III: Supplementary Information
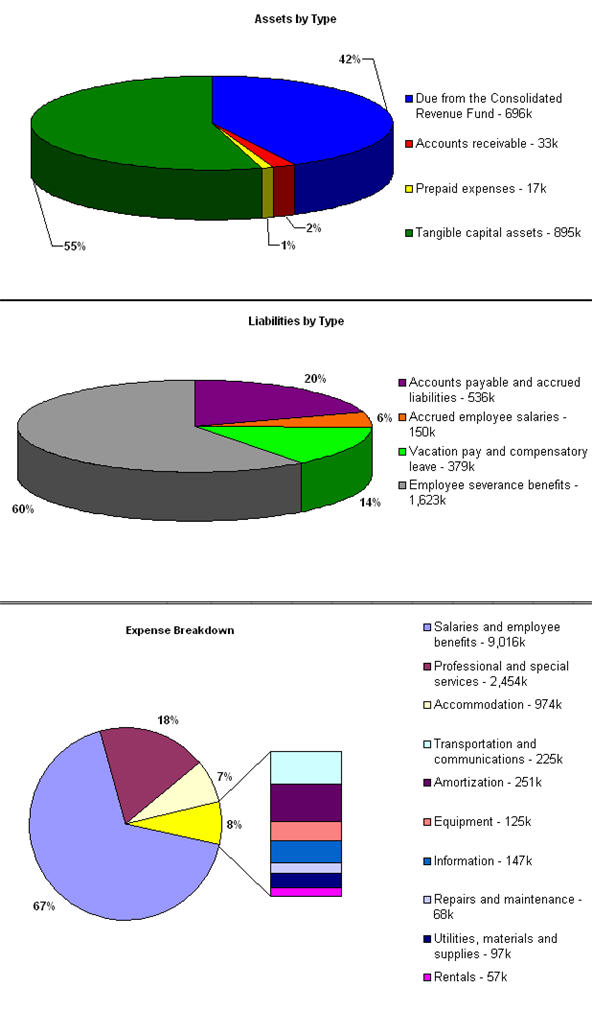
Financial Highlights
The OIC received additional funding of $2.5M in 2009-2010 to modernize and improve business processes and conduct activities in support of the Commissioner’s mandate.
The additional funding stems from a request submitted to the Advisory Panel on the Funding and Oversight of Officers of Parliament and recommended to Treasury Board Ministers. This request was based on an in-depth analysis of OIC organizational priorities, workload drivers and resource levels. It took into account internal reallocation of resources and efficiency improvements derived, in particular, from the Office’s streamlined investigations management process and IM/IT renewal initiatives.
As a result of this funding, more staffing resulted in greater salary expenditures. The OIC’s tangible assets also increased due to a refit of office space to accommodate the additional resources.
The financial highlights presented below are a general overview of the OIC’s financial position and operations. The audited financial statements can be found on the OIC website.
|
Condensed Statement of Financial Position |
% Change | 2009-2010 | 2008-2009 |
|---|---|---|---|
| ASSETS | |||
| Total Assets | 0% | 1,644,864 | 1,651,640 |
| TOTAL | 0% | 1,644,864 | 1,651,640 |
| LIABILITIES | |||
| Total Liabilities | 10% | 2,690,780 | 2,447,116 |
| EQUITY | |||
| Total Equity | 31% | (1,045,916) | (795,476) |
| TOTAL | 0% | 1,644,864 | 1,651,640 |
| Condensed Statement of Operations For the year ended March 31 |
% Change | 2009-2010 | 2008-2009 |
|---|---|---|---|
| EXPENSES | |||
| Total Expenses | 17% | 13,420,475 | 11,503,162 |
| REVENUES | |||
| Total Revenues | -62% | 199 | 525 |
| Net Cost of Operations | 17% | 13,420,276 | 11,502,637 |
The following charts illustrate the breakdown of OIC assets, liabilities and expenses in 2009-2010.